Strategy vault / Trend following
Advanced MACD Dynamic Trend Quantitative Trading Strategy
This strategy is an advanced quantitative trading system based on the Moving Average Convergence Divergence (MACD) indicator, enhancing trading decisions through dynamic background display and multiple preset…
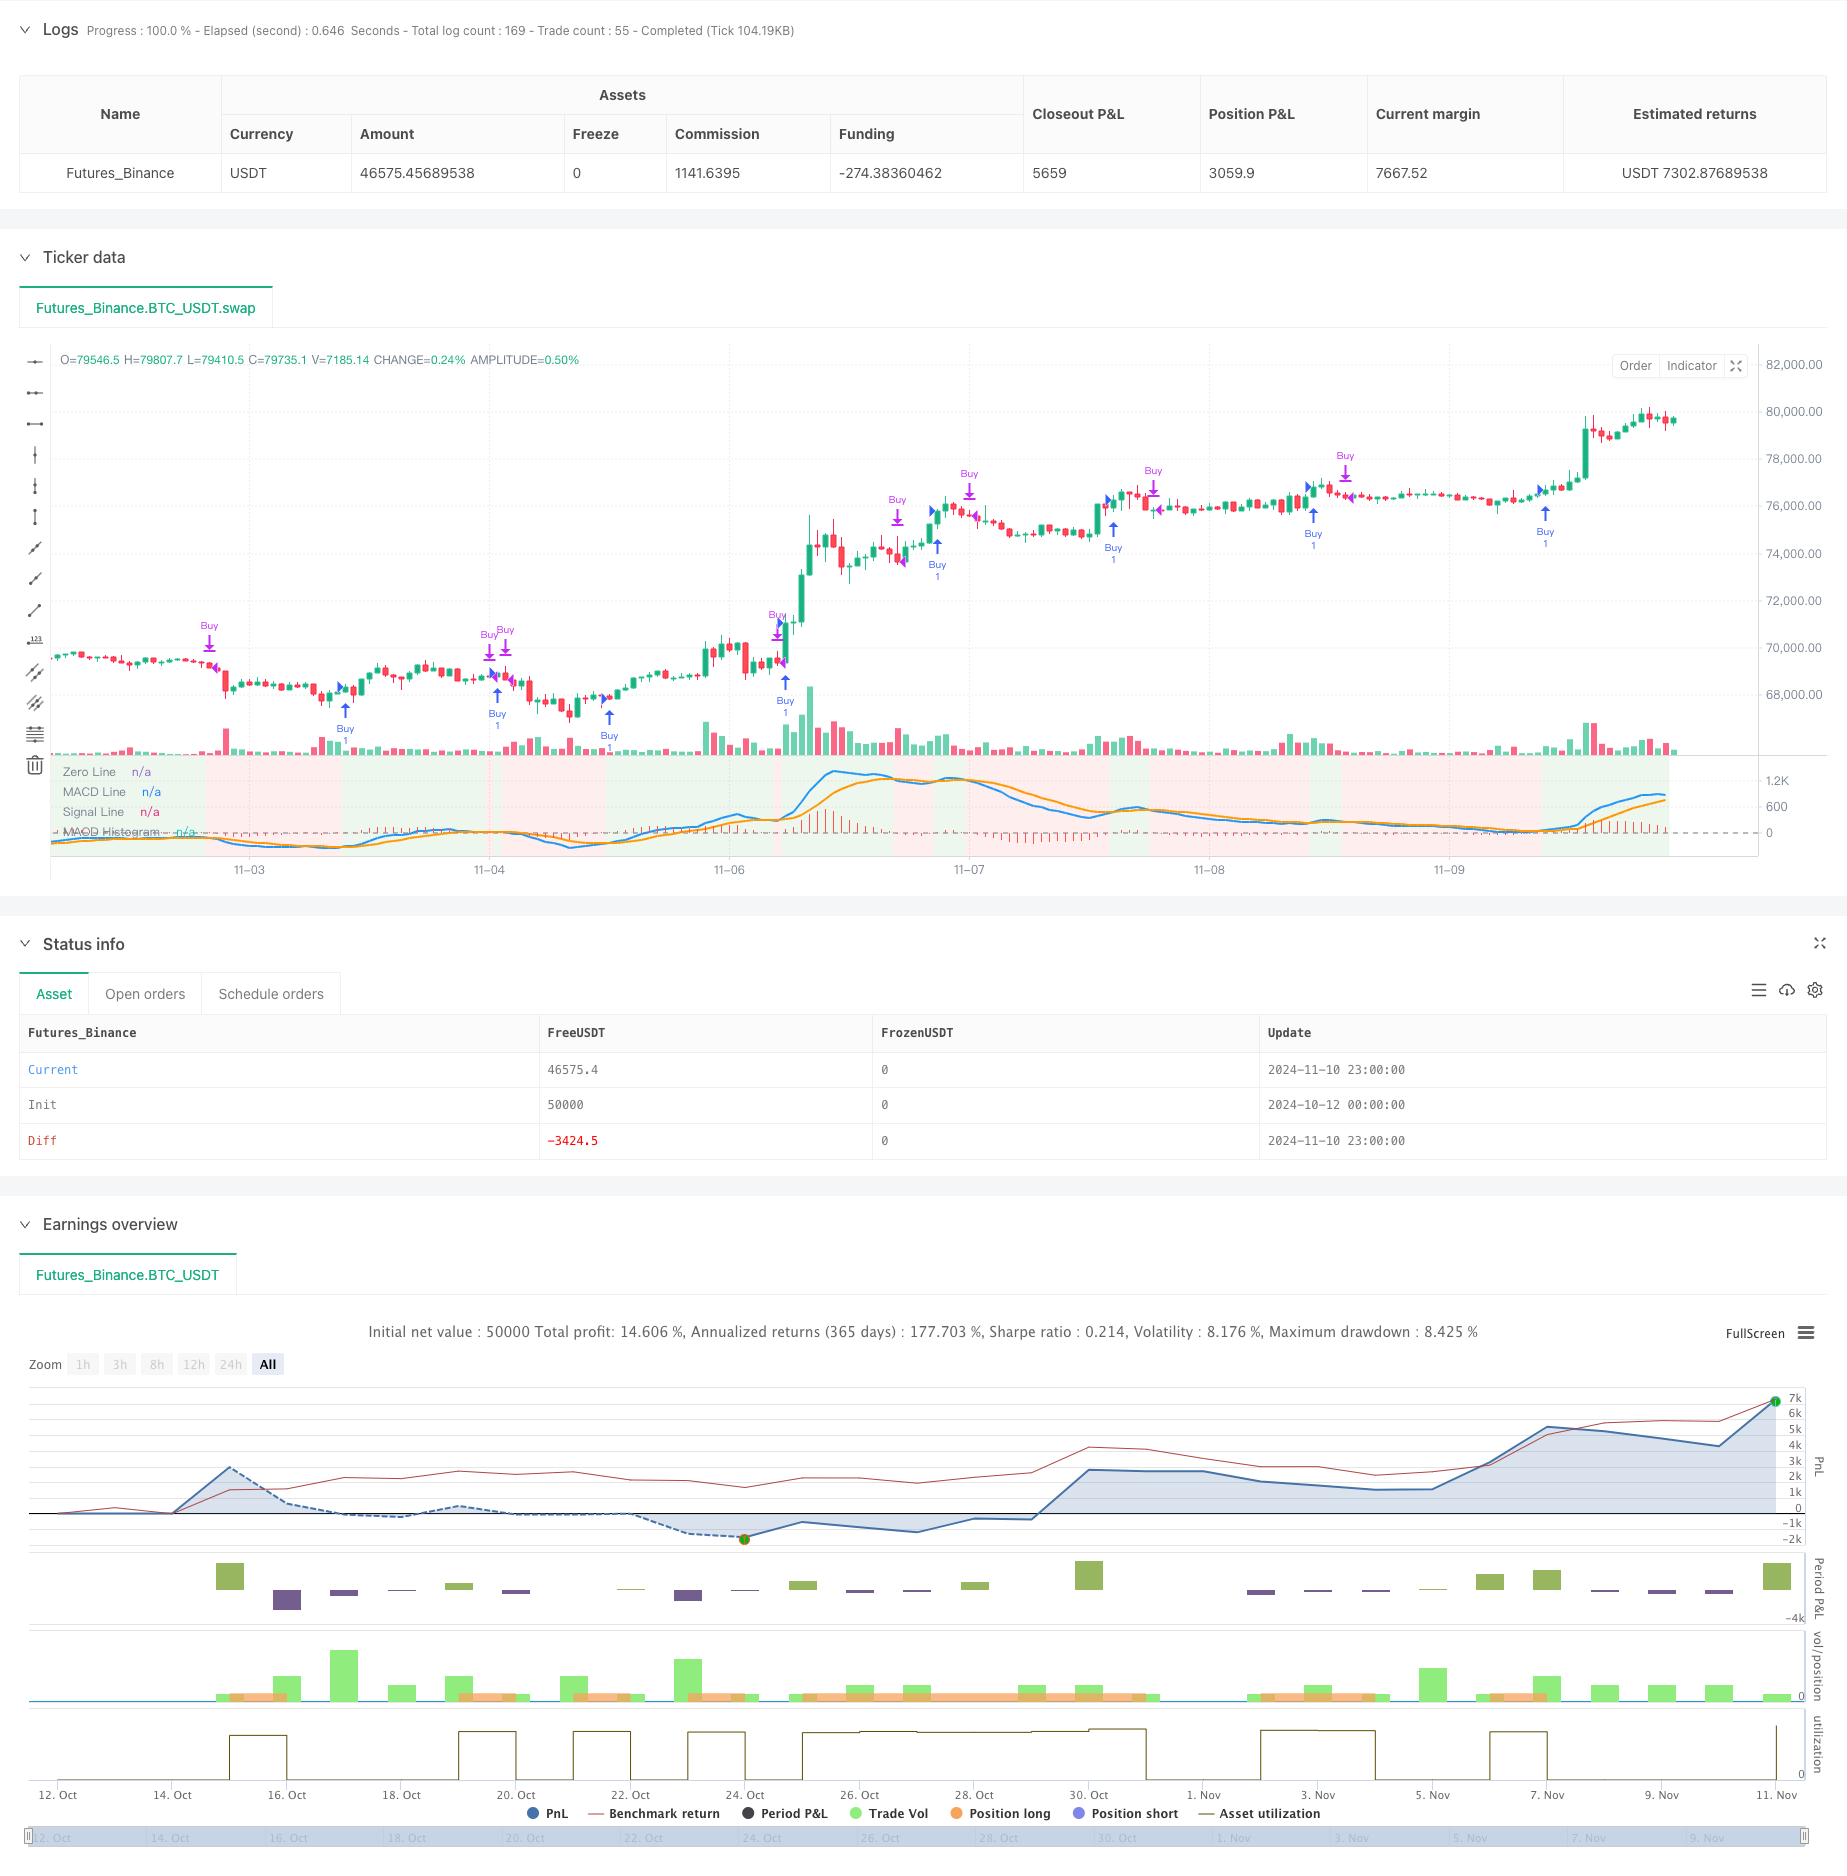
Overview
This strategy is an advanced quantitative trading system based on the Moving Average Convergence Divergence (MACD) indicator, enhancing trading decisions through dynamic background display and multiple preset parameter combinations. The core of the strategy lies in capturing market trend transition points through MACD crossover signals and visually displaying market conditions.
Strategy Principle
The strategy employs ten different MACD parameter presets, including Standard (12,26,9), Short-term (5,35,5), Long-term (19,39,9), etc., to adapt to different market environments and trading styles. The system generates buy signals when the MACD line crosses above the signal line (golden cross) and sell signals when it crosses below (death cross). The strategy enhances visual recognition through dynamic background color changes (green for bullish, red for bearish) to help traders better grasp market trends.
Strategy Advantages
- Parameter Flexibility: Offers ten preset parameter combinations for different market environments
- Clear Visual Feedback: Dynamic background color changes provide intuitive market trend display
- Clear Signals: Generates explicit buy/sell signals based on MACD crossovers
- High Adaptability: Applicable to different timeframe trading
- Clear Code Structure: Uses switch structure for parameter switching, easy to maintain and extend
Strategy Risks
- Lag Risk: MACD as a lagging indicator may generate delayed signals in volatile markets
- False Breakout Risk: May generate false crossover signals in ranging markets
- Parameter Dependency: Different parameter combinations perform differently in various market conditions
- Market Condition Limitations: May underperform in highly volatile or illiquid market environments
Strategy Optimization Directions
- Implement volatility filters to filter out trading signals during highly volatile periods
- Add trend confirmation indicators like RSI or ATR to improve signal reliability
- Implement adaptive parameter optimization based on market conditions
- Add stop-loss and take-profit functionality to enhance risk management
- Include volume analysis to improve signal reliability
Summary
This is a well-structured, logically sound advanced version of the MACD strategy. Through multiple parameter presets and dynamic visual feedback, it significantly enhances the strategy's practicality and operability. While inherent risks exist, the strategy has the potential to become a robust trading system with the suggested optimizations. Traders are advised to conduct thorough backtesting before live implementation and choose appropriate parameter settings based on specific market conditions.
Source Pine Script
/*backtest
start: 2024-10-12 00:00:00
end: 2024-11-11 00:00:00
period: 1h
basePeriod: 1h
exchanges: [{"eid":"Futures_Binance","currency":"BTC_USDT"}]
*/

//@version=5
strategy("Hanzo - Top 10 MACD Strategy", overlay=false)  // MACD in a separate pane

// Define dropdown options for MACD settings
macdOption = input.string(title="Select MACD Setting",
     defval="Standard (12, 26, 9)",
     options=["Standard (12, 26, 9)",
              "Short-Term (5, 35, 5)",
              "Long-Term (19, 39, 9)",
              "Scalping (3, 10, 16)",
              "Cryptocurrency (20, 50, 9)",
              "Forex (8, 17, 9)",
              "Conservative (24, 52, 18)",
              "Trend-Following (7, 28, 7)",
              "Swing Trading (5, 15, 5)",
              "Contrarian (15, 35, 5)"])

// MACD setting based on user selection
var int fastLength = 12
var int slowLength = 26
var int signalLength = 9

switch macdOption
    "Standard (12, 26, 9)" =>
        fastLength := 12
        slowLength := 26
        signalLength := 9
    "Short-Term (5, 35, 5)" =>
        fastLength := 5
        slowLength := 35
        signalLength := 5
    "Long-Term (19, 39, 9)" =>
        fastLength := 19
        slowLength := 39
        signalLength := 9
    "Scalping (3, 10, 16)" =>
        fastLength := 3
        slowLength := 10
        signalLength := 16
    "Cryptocurrency (20, 50, 9)" =>
        fastLength := 20
        slowLength := 50
        signalLength := 9
    "Forex (8, 17, 9)" =>
        fastLength := 8
        slowLength := 17
        signalLength := 9
    "Conservative (24, 52, 18)" =>
        fastLength := 24
        slowLength := 52
        signalLength := 18
    "Trend-Following (7, 28, 7)" =>
        fastLength := 7
        slowLength := 28
        signalLength := 7
    "Swing Trading (5, 15, 5)" =>
        fastLength := 5
        slowLength := 15
        signalLength := 5
    "Contrarian (15, 35, 5)" =>
        fastLength := 15
        slowLength := 35
        signalLength := 5

// MACD Calculation
[macdLine, signalLine, _] = ta.macd(close, fastLength, slowLength, signalLength)
macdHist = macdLine - signalLine

// Buy and Sell conditions based on MACD crossovers
enterLong = ta.crossover(macdLine, signalLine)
exitLong = ta.crossunder(macdLine, signalLine)

// Execute buy and sell orders with price labels in the comments
if (enterLong)
    strategy.entry("Buy", strategy.long, comment="Buy at " + str.tostring(close, "#.##"))

if (exitLong)
    strategy.close("Buy", comment="Sell at " + str.tostring(close, "#.##"))

// Plot the signal price using plotchar for buy/sell prices
//plotchar(enterLong ? close : na, location=location.belowbar, color=color.green, size=size.small, title="Buy Price", offset=0)
//plotchar(exitLong ? close : na, location=location.abovebar, color=color.red, size=size.small, title="Sell Price", offset=0)

// Background highlighting based on bullish or bearish MACD
isBullish = macdLine > signalLine
isBearish = macdLine < signalLine

// Change background to green for bullish periods and red for bearish periods
bgcolor(isBullish ? color.new(color.green, 90) : na, title="Bullish Background")
bgcolor(isBearish ? color.new(color.red, 90) : na, title="Bearish Background")

// Plot the MACD and Signal line in a separate pane
plot(macdLine, title="MACD Line", color=color.blue, linewidth=2)
plot(signalLine, title="Signal Line", color=color.orange, linewidth=2)
hline(0, "Zero Line", color=color.gray)
plot(macdHist, title="MACD Histogram", style=plot.style_histogram, color=color.red)
Published by ChaoZhang on the FMZ strategy square · last modified 2024-11-12. Collected in the Quant Trading Vault. Unvalidated research: re-test with your own data and costs before trusting it.
Build this with AgenKit
A spec is not a trading system. Paste this into your coding agent and AgenKit runs a specialist team — architecture, test-first build, risk gates, review — with paper trading on by default.
/agenkit build a production-grade trading bot with a backtest engine, risk controls and paper trading by default from strategies/Advanced-MACD-Dynamic-Trend-Quantitative-Trading-Strategy.md- npx agenkit install engineering-kit in your project
- Paste the command into your agent and approve each phase
- Get tests, backtest, risk controls and a paper-trading switch
Understand it first
Before you run this, read the lesson behind the idea and how to backtest it honestly. Specs like this one are the survivors of an unknown number of trials; deflate their results accordingly.
Related specs
- Adaptive ATR and RSI Trend Following Strategy with Trailing Stop LossPine Script · Trend following · 1h
- Advanced Supertrend Indicator Trading Mechanism Optimization StrategyPine Script · Trend following · 1d
- Bollinger Bands and RSI Trend Following StrategyPine Script · Trend following · 1h
- Dual ATR Channel Trend Following StrategyPine Script · Trend following · 15m
- Dual Indicator Dynamic Trend Trading Strategy Multi dimensional Technical Analysis System Based on RSI and MACDPine Script · Trend following
- Dynamic Dual EMA Crossover Strategy with Adaptive Profit Loss ControlPine Script · Trend following · 1d