Strategy vault / Trend following
AO Indicator Based Trend Following Strategy
This strategy uses the Awesome Oscillator (AO) indicator to determine the trend direction and moving averages to confirm the trend. It belongs to the trend following strategy. It goes long when the AO indicator…
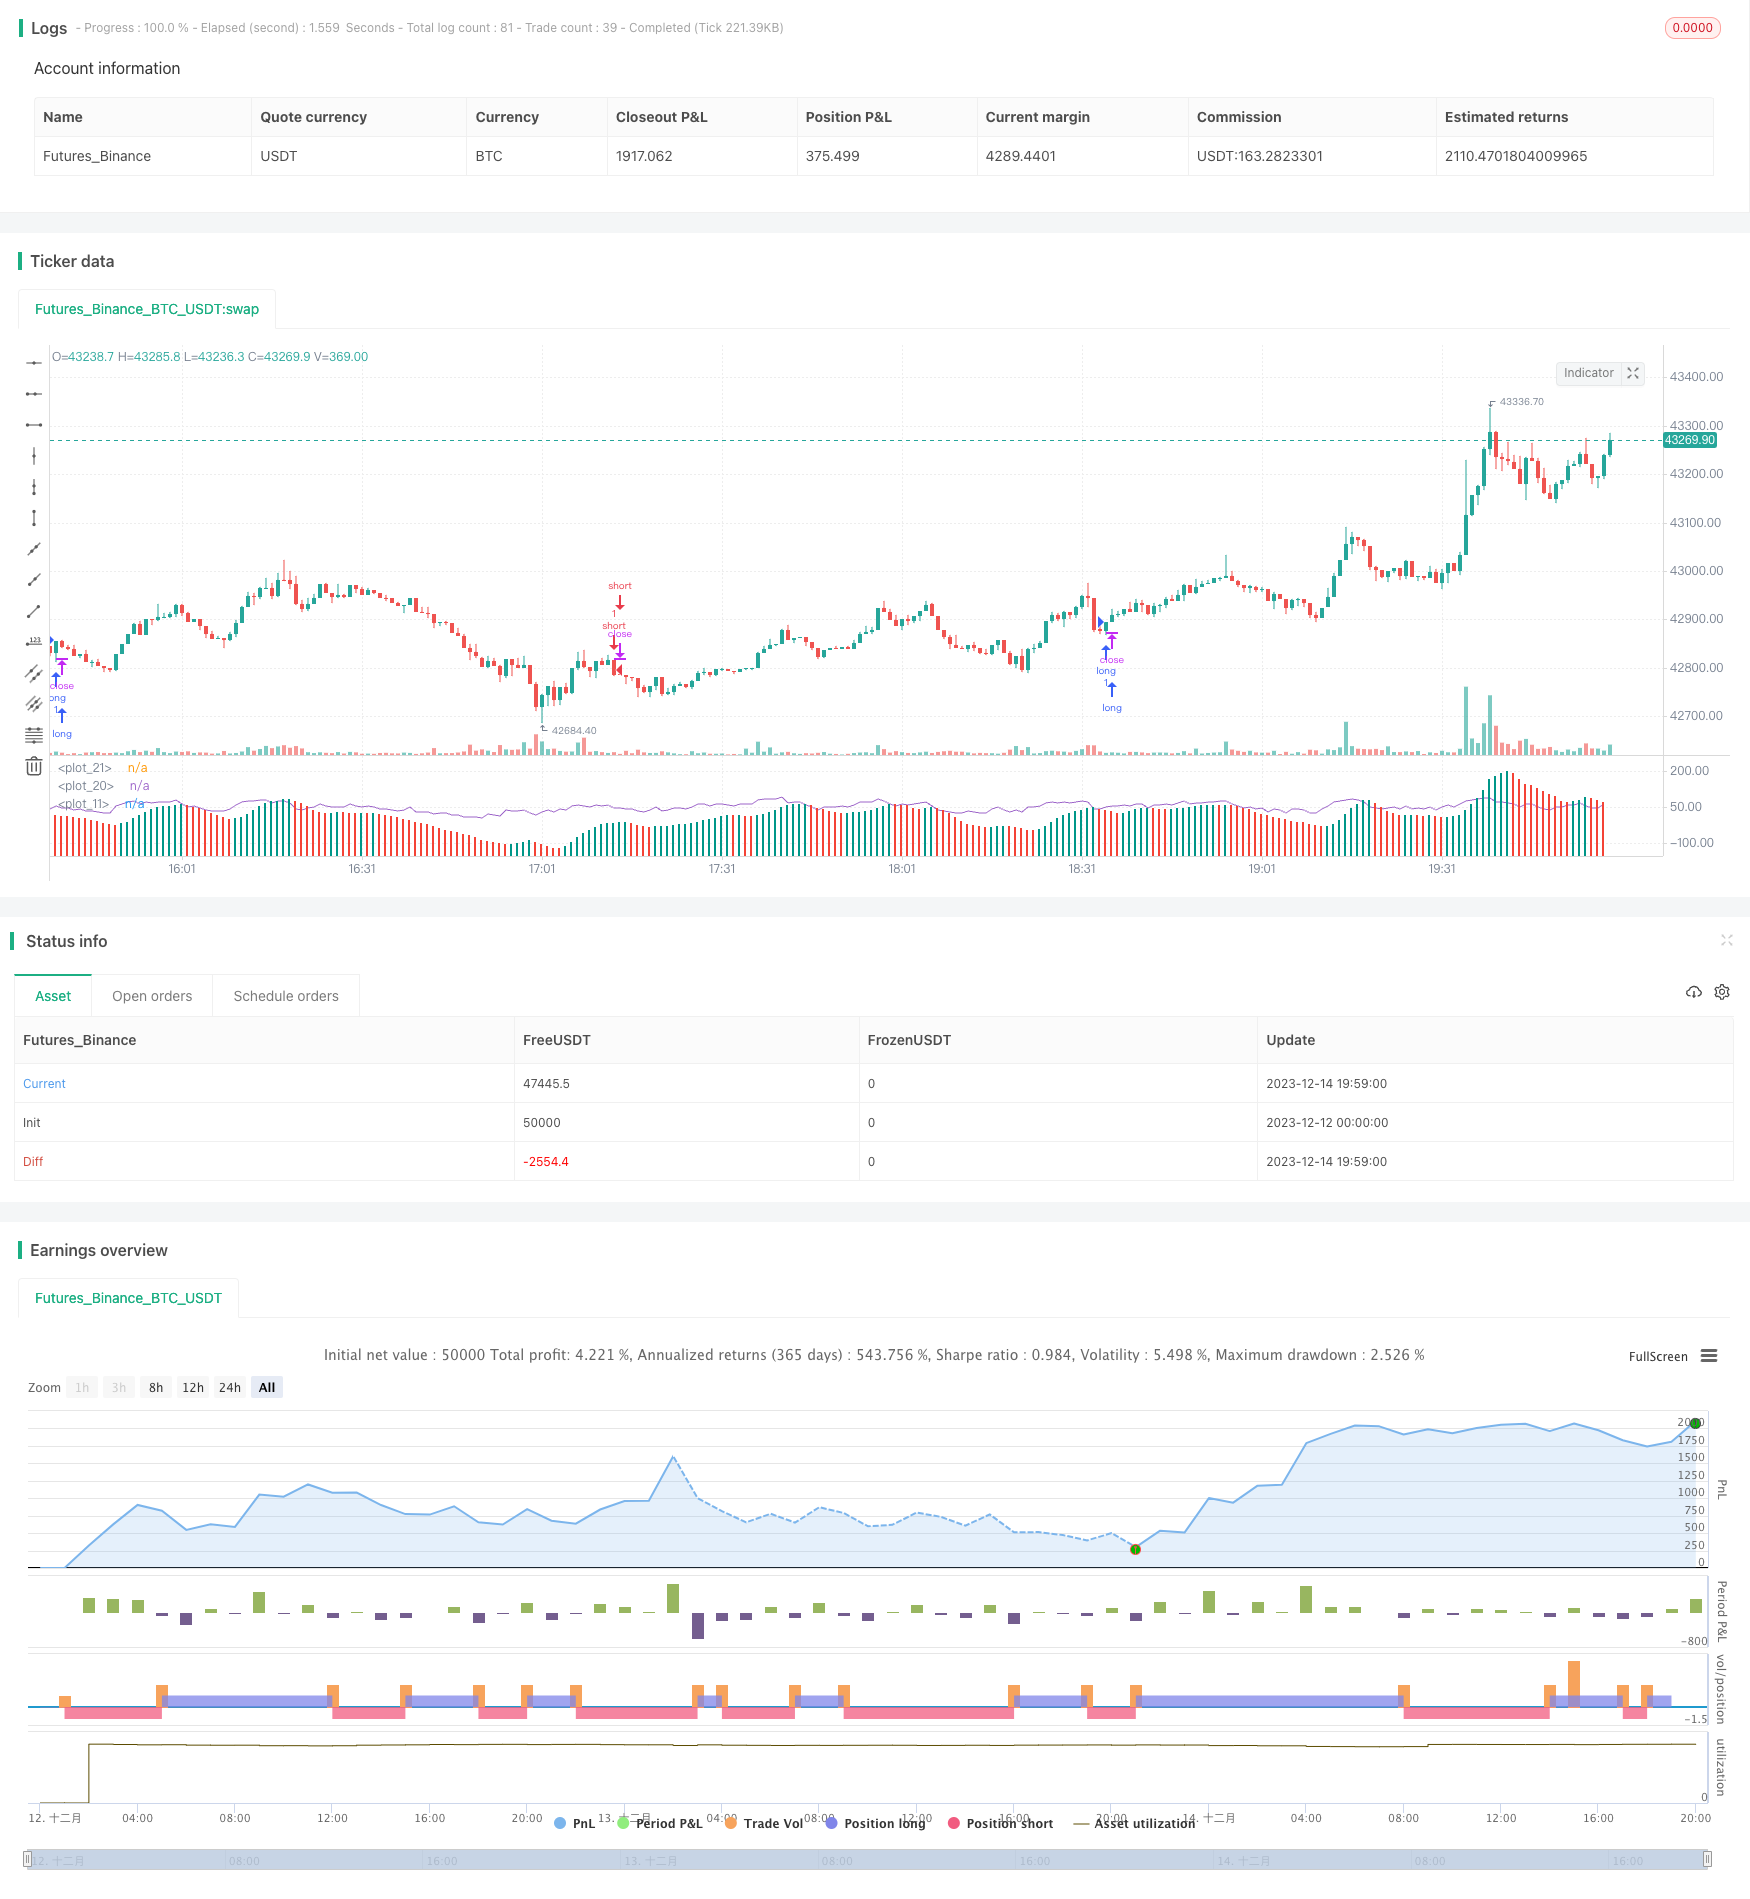
Overview
This strategy uses the Awesome Oscillator (AO) indicator to determine the trend direction and moving averages to confirm the trend. It belongs to the trend following strategy. It goes long when the AO indicator crosses above the 0 level and the fast MA crosses above the slow MA, and goes short when the AO crosses below the 0 level and the fast MA crosses below the slow MA, taking advantage of the directionality of trends to profit.
Strategy Logic
This strategy mainly relies on the AO indicator to determine the short-term trend direction. The AO indicator is calculated based on the difference between the 5-period and 34-period simple moving averages of the mid-price. It belongs to the Momentum category of indicators. When the AO is positive, it means the short-term MA is above the long-term MA, which should be interpreted as a bullish sign. When the AO is negative, it means the short-term MA is below the long-term MA, which should be interpreted as a bearish sign.
Therefore, the AO indicator can effectively determine the direction of the trend. When the AO crosses above the 0 level, it signals that the market trend has turned bullish and we should go long. When the AO crosses below the 0 level, it signals that the market trend has turned bearish and we should go short.
In addition, this strategy also incorporates the 20-period and 200-period moving averages. The slope of these two MAs represents the direction of the medium to long-term trend. Judging only by the AO indicator for the short-term trend direction is not enough, confirmation from the mid-long term trend is also needed, hence the addition of the MA crossover rules.
When the fast MA crosses above the slow MA, the mid-long term trend turns bullish, we go long when the AO crosses above 0 to ride the uptrend. When the fast MA crosses below the slow MA, the mid-long term trend turns bearish, we go short when the AO crosses below 0 to ride the downtrend.
Advantages
- Accurately determining short-term trend direction using the AO indicator
- Adding MA filters to confirm mid-long term trend, effectively avoiding false breakouts
- Fast profits, suitable for short-term trading
Risk Analysis
- Risk of failed entry when going short. Price may continue going up for some time after AO crosses below 0 and MA signals sell before turning down.
- Risk of failed entry when going long. Price may continue going down for some time after AO crosses above 0 and MA signals buy before turning up.
- Risk of distorted AO signals at major technical levels.
Improvement Directions
- Test different MA combinations to find better settings, e.g. 10- and 50-period MAs
- Add other indicators like RSI for signal confirmation
- Optimize stop loss percentage for better risk/reward ratio
Conclusion
This is a simple trend following strategy. Using the AO to determine short-term trend direction confirmed by mid-long term MAs is logically sound. The combination of AO and MAs sees widespread usage and is relatively mature. This strategy is also very reliable. Further optimization of parameters and other indicators can improve strategy performance.
Parameters
| Name | Default | What it controls |
|---|---|---|
| v_input_bool_1 | true | long |
| v_input_bool_2 | true | short |
| v_input_float_1 | 10 | profit |
| v_input_float_2 | 5 | stop |
Source Pine Script
/*backtest
start: 2023-12-12 00:00:00
end: 2023-12-14 20:00:00
period: 1m
basePeriod: 1m
exchanges: [{"eid":"Futures_Binance","currency":"BTC_USDT"}]
*/

// https://www.youtube.com/watch?v=zr3AVwjCtDA

//@version=5
strategy(title="Bingx ESTRATEGIA de Trading en 1 minuto ", shorttitle="AO")
long = input.bool(true, "long")
short = input.bool(true, "short")
profit = (input.float(10, "profit") / 100) + 1
stop = (input.float(5, "stop") / 100) + 1
ao = ta.sma(hl2,5) - ta.sma(hl2,34)
diff = ao - ao[1]
plot(ao, color = diff <= 0 ? #F44336 : #009688, style=plot.style_columns)
changeToGreen = ta.crossover(diff, 0)
changeToRed = ta.crossunder(diff, 0)
alertcondition(changeToGreen, title = "AO color changed to green", message = "Awesome Oscillator's color has changed to green")
alertcondition(changeToRed, title = "AO color changed to red", message = "Awesome Oscillator's color has changed to red")

ema20 = ta.ema(close, 20)
ema200 = ta.ema(close, 200)
rsi = ta.rsi(close, 7)
plot(rsi)
plot(0, color=color.white)
var float pentry = 0.0
var float lentry = 0.0
var bool oab = false
// oab := ta.crossover(ao, 0) ? true : ta.crossover(0, ao) ? false : oab[1]

if long and close > open and ta.crossover(close, ema20) and ema20 > ema200 and ao > 0 and rsi > 50
    strategy.entry("long", strategy.long)
    pentry := close
strategy.exit("exit long", "long", limit=pentry * profit, stop=pentry / stop)

if short and close < open and ta.crossunder(close, ema20) and ema20 < ema200 and ao < 0 and rsi < 50
    strategy.entry("short", strategy.short)
    lentry := close
strategy.exit("exit short", "short", limit=lentry / profit, stop=lentry * stop)
Published by ChaoZhang on the FMZ strategy square · last modified 2023-12-20. Collected in the Quant Trading Vault. Unvalidated research: re-test with your own data and costs before trusting it.
Build this with AgenKit
A spec is not a trading system. Paste this into your coding agent and AgenKit runs a specialist team — architecture, test-first build, risk gates, review — with paper trading on by default.
/agenkit build a production-grade trading bot with a backtest engine, risk controls and paper trading by default from strategies/AO-Indicator-Based-Trend-Following-Strategy.md- npx agenkit install engineering-kit in your project
- Paste the command into your agent and approve each phase
- Get tests, backtest, risk controls and a paper-trading switch
Understand it first
Before you run this, read the lesson behind the idea and how to backtest it honestly. Specs like this one are the survivors of an unknown number of trials; deflate their results accordingly.
Related specs
- Bollinger Bands and RSI Trend Following StrategyPine Script · Trend following · 1h
- Dual ATR Channel Trend Following StrategyPine Script · Trend following · 15m
- Dual Mode Adaptive Trend Trading Strategy EMA Crossover with ATR Volatility Based Risk Management SystemPine Script · Trend following · 1d
- Dynamic Dual EMA Crossover Strategy with Adaptive Profit Loss ControlPine Script · Trend following · 1d
- Dynamic Signal Line Trend Following and Volatility Filtering StrategyPine Script · Trend following · 1h
- EMA AROON ASHPine Script · Trend following · 3m