Bollinger Bands Breakout Strategy 449497
This strategy uses Bollinger Bands as buy and sell signals. It buys when the price breaks below the lower band and sells when it breaks above the upper band. It also employs a pyramiding approach, continuing to buy…
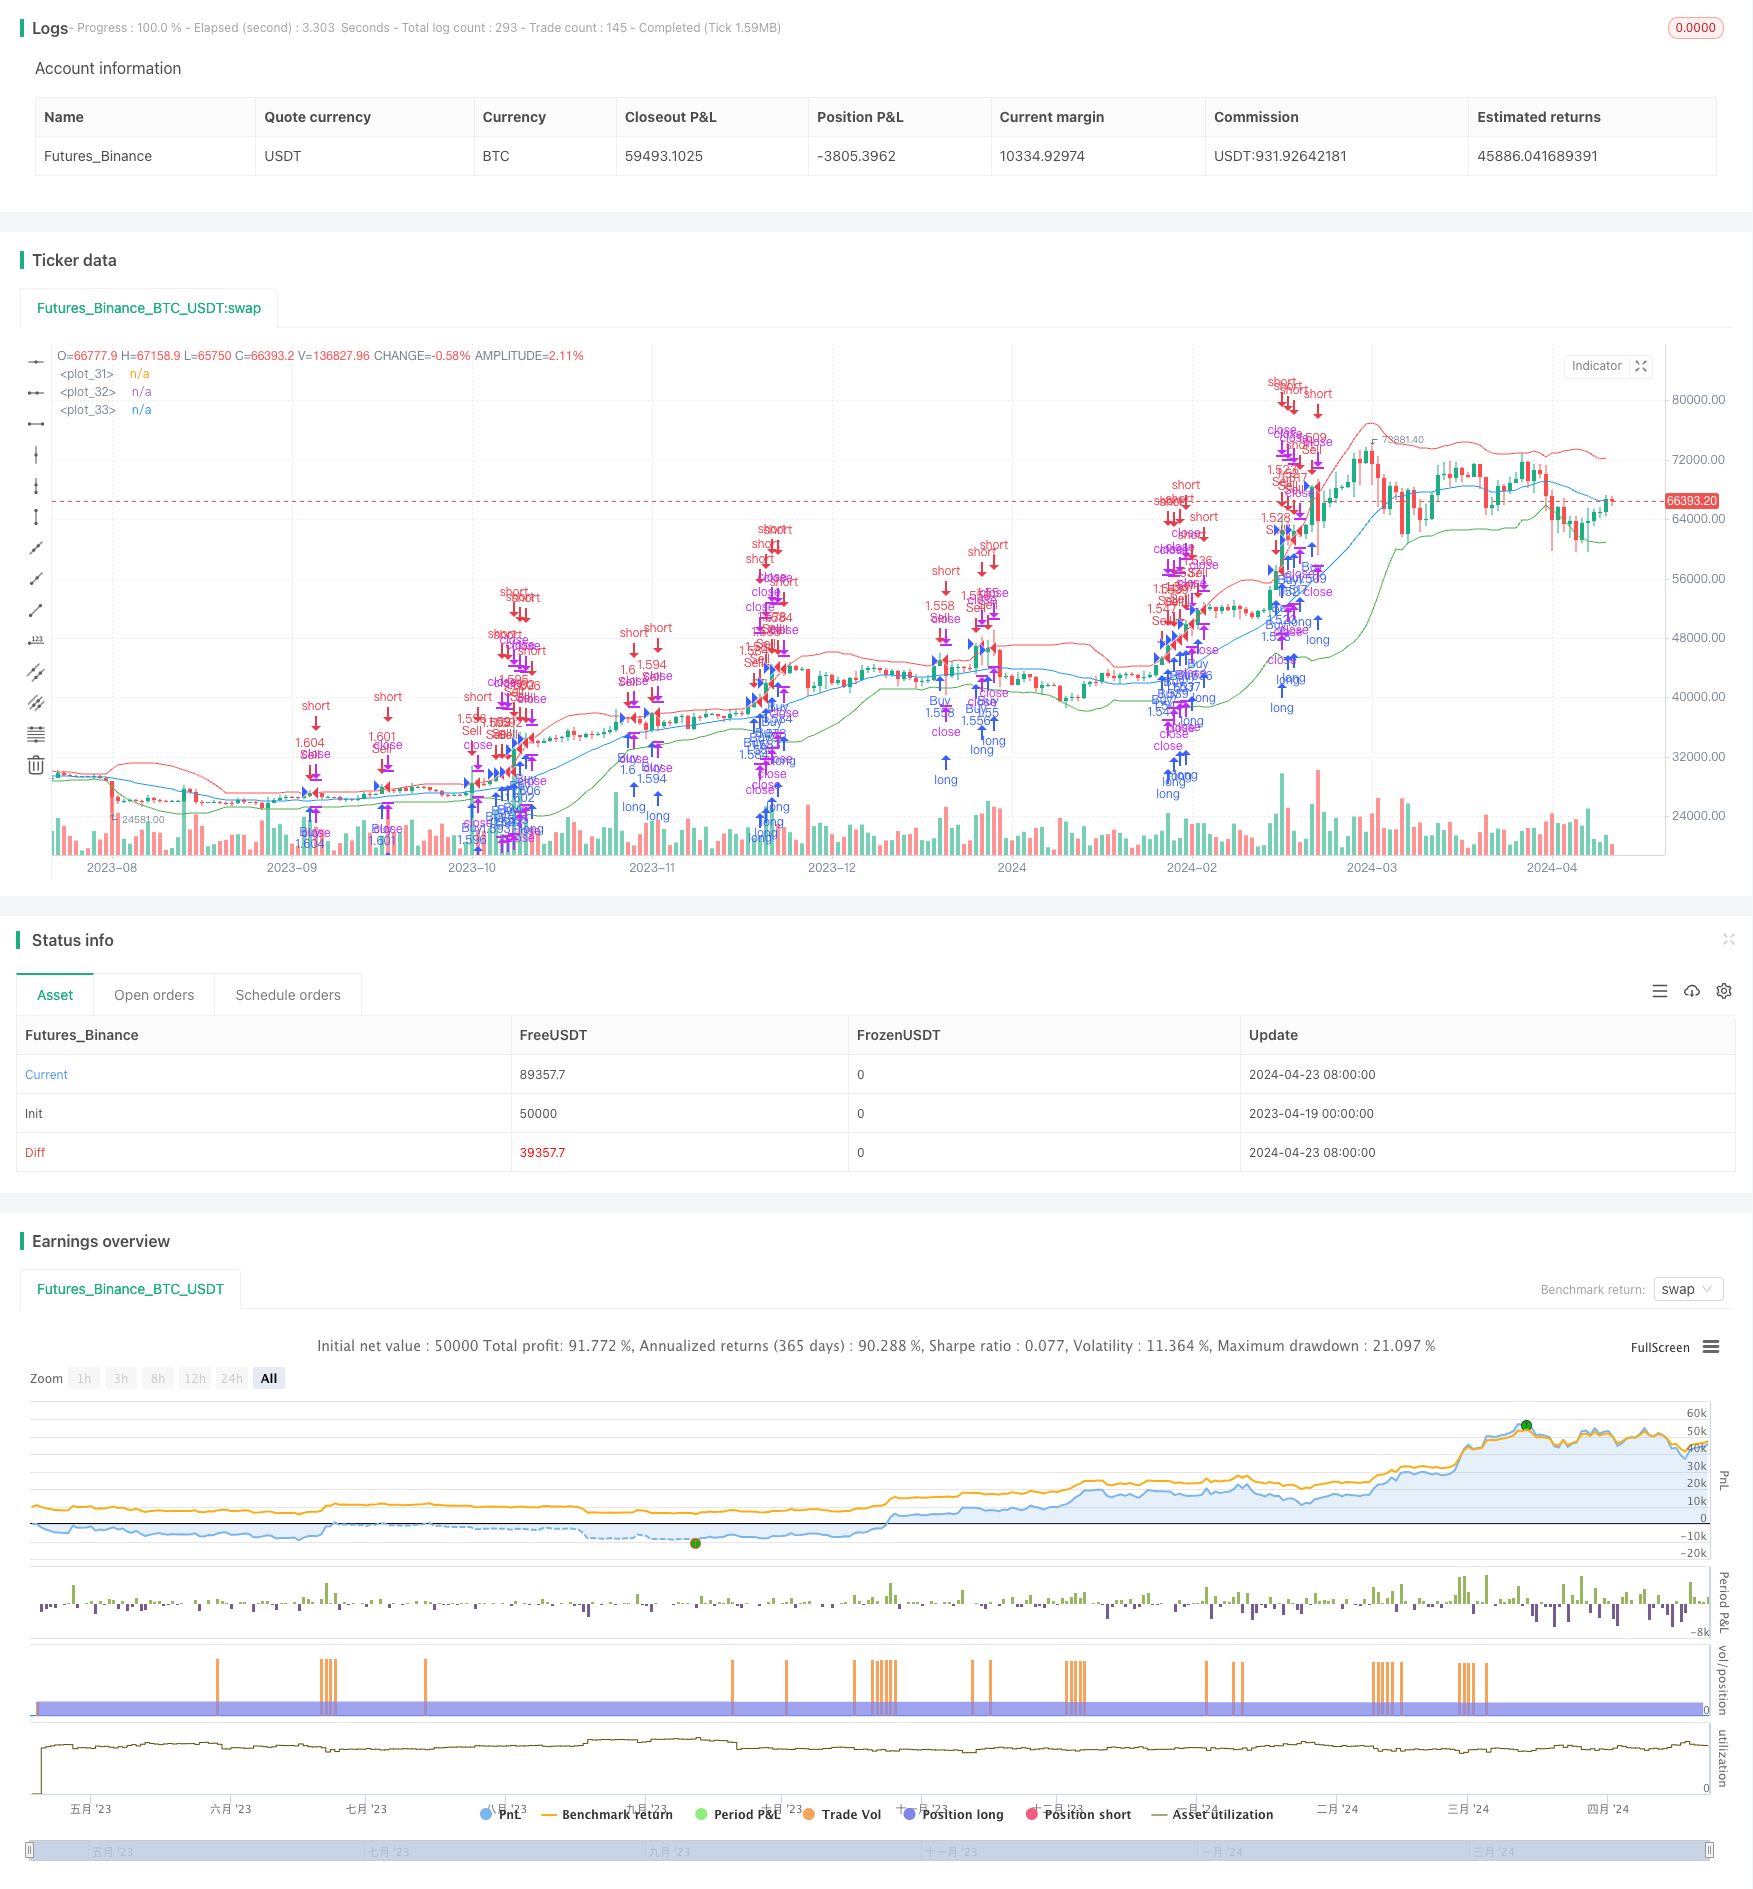
Overview
This strategy uses Bollinger Bands as buy and sell signals. It buys when the price breaks below the lower band and sells when it breaks above the upper band. It also employs a pyramiding approach, continuing to buy when the number of open positions is below a set value and selling when above it. The strategy is suitable for market conditions with clear trends.
Strategy Principle
- Calculate the upper, middle, and lower Bollinger Bands. The middle band is the simple moving average of the closing price, while the upper and lower bands are the middle band plus or minus a multiple of the standard deviation of the closing price.
- When the closing price is less than or equal to the lower band, a buy signal is generated; when it is greater than or equal to the upper band, a sell signal is generated.
- If the current number of open positions is less than the set pyramiding number, continue buying; if greater than the set number, sell.
- Plot the upper, middle, and lower Bollinger Bands on the chart.
Strategy Advantages
- Bollinger Bands can quantify the volatility range of prices, provide clear buy and sell signals, and are easy to operate.
- The pyramiding approach can amplify the profitability of trend moves.
- Bollinger Bands have a certain ability to identify trends and control risk, making them suitable for trend traders.
Strategy Risks
- When the market is in a choppy condition, frequent buy and sell signals may lead to losses.
- If a trend reversal occurs, the pyramiding approach amplifies the downside risk.
- The selection of Bollinger Band parameters needs to be optimized for different markets and timeframes; inappropriate parameters may cause the strategy to fail.
Strategy Optimization Directions
- It can be combined with other indicators such as RSI, MACD, etc., to secondarily confirm Bollinger Band signals and improve signal accuracy.
- Control the quantity and proportion of pyramiding, set stop-loss positions, and reduce downside risk.
- Optimize and test Bollinger Band parameters such as period and multiple to select the best parameter combination.
- In choppy markets, consider using a Bollinger Band channel strategy to buy low and sell high between the upper and lower bands.
Summary
The Bollinger Bands Breakout strategy uses the position of the price relative to the Bollinger Bands to generate trend-following signals, while amplifying trend profits through pyramiding. However, it performs poorly in rangebound markets, and pyramiding may amplify losses. Therefore, in actual use, it needs to be combined with other indicators to verify signals, control pyramiding risks, and optimize parameters. At the same time, the strategy should be flexibly adjusted according to market characteristics.
Parameters
| Name | Default | What it controls |
|---|---|---|
| v_input_1 | 20 | Bollinger Bands Length |
| v_input_2 | 2 | Multiplier |
| v_input_3 | 10 | Pyramiding |
Source Pine Script
/*backtest
start: 2023-04-19 00:00:00
end: 2024-04-24 00:00:00
period: 1d
basePeriod: 1h
exchanges: [{"eid":"Futures_Binance","currency":"BTC_USDT"}]
*/

//@version=5
strategy("Bollinger Bands Breakout Strategy", overlay=true, initial_capital=100, default_qty_type=strategy.percent_of_equity, default_qty_value=100)

// Définition des paramètres
length = input(20, title="Bollinger Bands Length")
multiplier = input(2.0, title="Multiplier")
pyramiding = input(10, title="Pyramiding")

// Calcul des bandes de Bollinger
basis = ta.sma(close, length)
dev = multiplier * ta.stdev(close, length)
upper_band = basis + dev
lower_band = basis - dev

// Règles d'entrée
buy_signal = close <= lower_band
sell_signal = close >= upper_band
// Gestion des positions
if (buy_signal)
    strategy.entry("Buy", strategy.long)
if (sell_signal)
    strategy.entry("Sell", strategy.short)

// Pyramiding
if (strategy.opentrades < pyramiding)
    strategy.entry("Buy", strategy.long)
else if (strategy.opentrades > pyramiding)
    strategy.entry("Sell", strategy.short)

// Tracé des bandes de Bollinger
plot(basis, color=color.blue)
plot(upper_band, color=color.red)
plot(lower_band, color=color.green)
Published by ChaoZhang on the FMZ strategy square · last modified 2024-04-26. Collected in the Quant Trading Vault. Unvalidated research: re-test with your own data and costs before trusting it.
Build this with AgenKit
A spec is not a trading system. Paste this into your coding agent and AgenKit runs a specialist team — architecture, test-first build, risk gates, review — with paper trading on by default.
/agenkit build a production-grade trading bot with a backtest engine, risk controls and paper trading by default from strategies/Bollinger-Bands-Breakout-Strategy-449497.md- npx agenkit install engineering-kit in your project
- Paste the command into your agent and approve each phase
- Get tests, backtest, risk controls and a paper-trading switch
Understand it first
Before you run this, read the lesson behind the idea and how to backtest it honestly. Specs like this one are the survivors of an unknown number of trials; deflate their results accordingly.
Related specs
- Bollinger Bands Dynamic Breakout StrategyPine Script · Breakout · 1h
- Cross boundary Dynamic Range Quantitative Trading Strategy Based on Bollinger BandsPine Script · Breakout · 3h
- Momentum Breakout Moving Average StrategyPine Script · Breakout · 1d
- Momentum Breakout Trading Strategy 440964Pine Script · Breakout · 5m
- Moving Average Crossover and Upper Rail Breakthrough Impulse StrategyPine Script · Breakout · 1m
- Multi Indicator Bollinger Bands Trading StrategyPine Script · Breakout · 2h