Dual Confirmation MACD and RSI Strategy
This strategy combines the MACD indicator and RSI indicator to implement a dual confirmation mechanism for entry signals, balancing profitability and risk control, aiming for steady returns in the medium to long term.
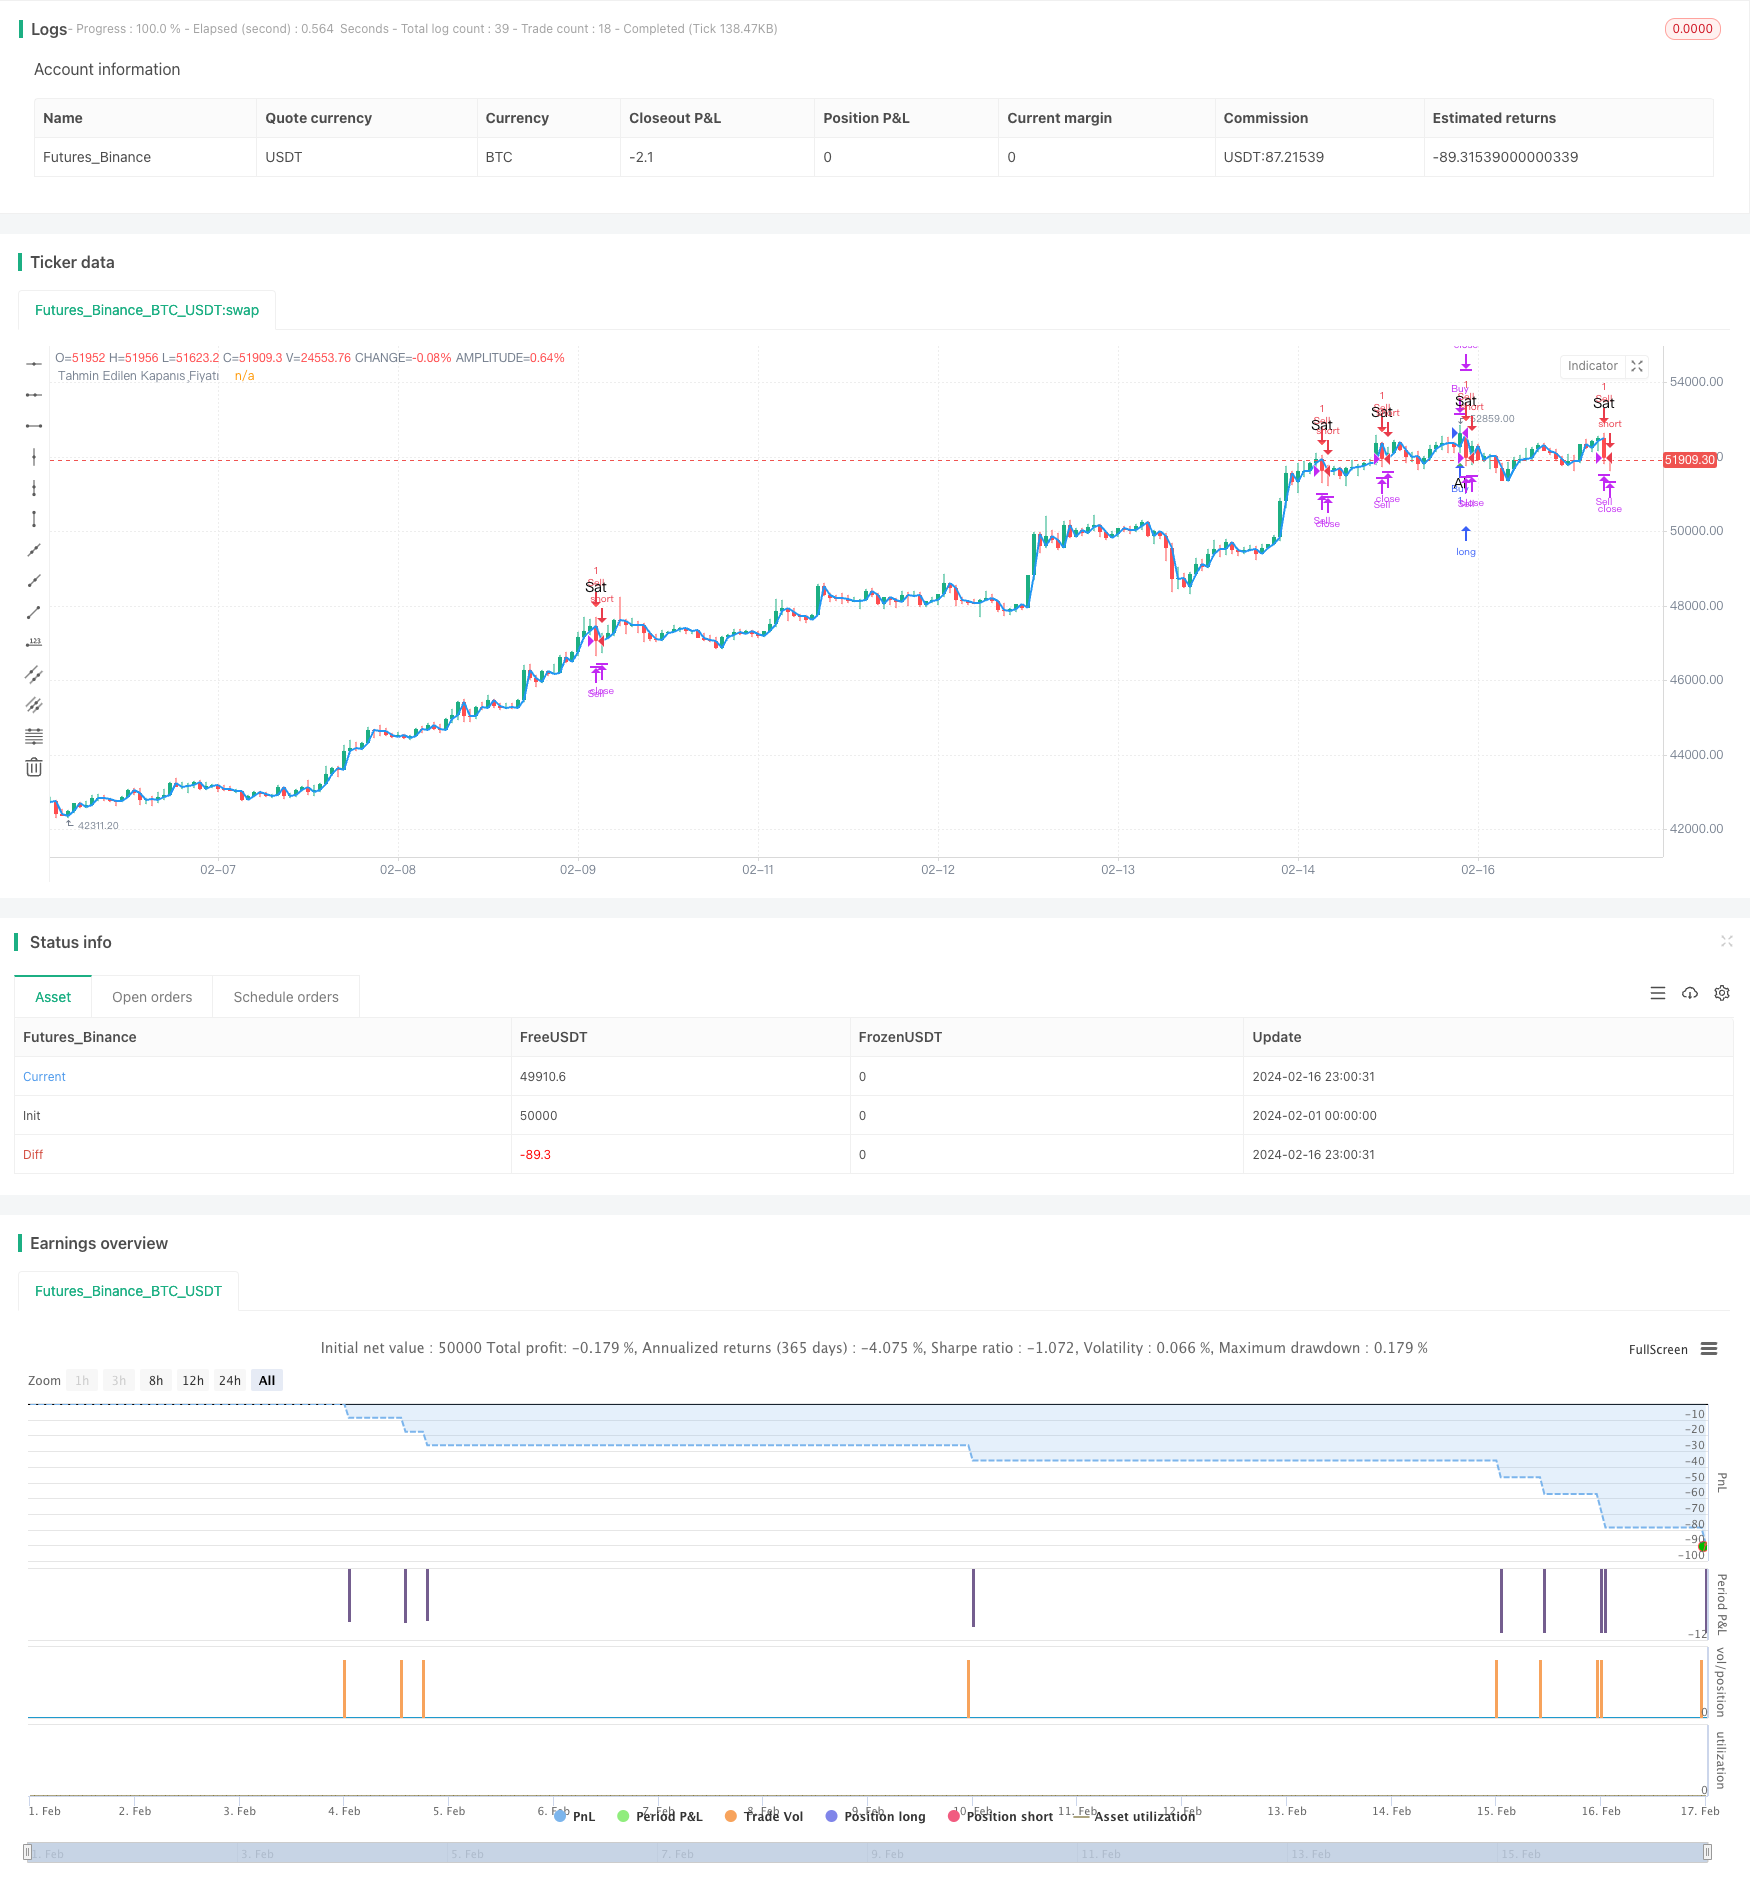
Overview
This strategy combines the MACD indicator and RSI indicator to implement a dual confirmation mechanism for entry signals, balancing profitability and risk control, aiming for steady returns in the medium to long term.
Strategy Logic
The strategy mainly uses the MACD indicator to determine market trends and entry points. A MACD line crossover above the signal line is considered a buy signal, while a MACD line crossover below the signal line is as sell signal. Additionally, the overbought area of the RSI indicator is used to filter false breakouts. The strategy only issues a buy signal when the MACD buy signal occurs and the RSI indicator has not entered the overbought zone. The judgment of sell signals is similar.
To ensure the reliability of trading signals, this strategy also incorporates volume analysis. Only when the volume is greater than the 20-day average volume will the strategy issue trading signals. This avoids wrong signals when the market has insufficient trading volume.
Finally, the strategy also uses the direction of candlestick bodies as a way of tracking stops and confirmation. When the direction of the candlestick body changes, it closes out the current position. This locks in profits and prevents profit retracement.
Advantage Analysis
- MACD judges market trends and entry points, allowing entry at the beginning of trends for greater profit potential
- RSI avoids entering during overbought/oversold levels, reducing losses
- Volume analysis further filters false signals, increasing profitability
- Candlestick tracking stops reasonably control risks
Risk Analysis
- MACD has lagging capability and may miss short-term trend reversals
- Volume rules may miss trends sparked by low volumes
- Candlestick stops may get stopped out by short-term spikes
Optimization Directions
- Consider adding more filtering indicators like Bollinger Bands to further improve signal quality
- Test adding rail stops to lock in long-term profits
- Optimize MACD parameter combinations to increase indicator sensitivity
Summary
Overall this strategy balances stability and profitability. MACD judges the main trend, RSI and volume provide dual filtering to improve signal quality, candlestick tracking stops control risk. The strategy can be further improved through parameter optimization and incorporating additional technical indicators. Notably, avoiding excessive complexity and maintaining simplicity and stability is very important.
Source Pine Script
/*backtest
start: 2024-02-01 00:00:00
end: 2024-02-17 00:00:00
period: 1h
basePeriod: 15m
exchanges: [{"eid":"Futures_Binance","currency":"BTC_USDT"}]
*/

//@version=5
strategy("Al-Sat Sinyali ve Teyidi", overlay=true)

// MACD (Hareketli Ortalama Yakınsaklık Sapma)
[macdLine, signalLine, _] = ta.macd(close, 5, 13, 5)

// RSI (Göreceli Güç Endeksi)
rsiValue = ta.rsi(close, 14)

// Hacim
volumeAverage = ta.sma(volume, 20)

// RSI ve MACD Filtreleri
rsiOverbought = rsiValue > 70
rsiOversold = rsiValue < 30
macdBuySignal = ta.crossover(macdLine, signalLine) and not rsiOverbought
macdSellSignal = ta.crossunder(macdLine, signalLine) and not rsiOversold

// Al-Sat Stratejisi
shouldBuy = ta.crossover(close, open) and not ta.crossover(close[1], open[1]) and macdBuySignal and volume > volumeAverage
shouldSell = ta.crossunder(close, open) and not ta.crossunder(close[1], open[1]) and macdSellSignal and volume > volumeAverage

strategy.entry("Buy", strategy.long, when=shouldBuy)
strategy.entry("Sell", strategy.short, when=shouldSell)

// Teyit için bir sonraki mumu bekleme
strategy.close("Buy", when=ta.crossover(close, open))
strategy.close("Sell", when=ta.crossunder(close, open))

// Görselleştirmeyi devre dışı bırakma
plot(na)

// Al-Sat Etiketleri
plotshape(series=shouldBuy, title="Al Sinyali", color=color.green, style=shape.triangleup, location=location.belowbar, size=size.small, text="Al")
plotshape(series=shouldSell, title="Sat Sinyali", color=color.red, style=shape.triangledown, location=location.abovebar, size=size.small, text="Sat")

// Varsayımsal bir sonraki mumun kapanış fiyatını hesapla
nextBarClose = close[1]
plot(nextBarClose, color=color.blue, linewidth=2, title="Tahmin Edilen Kapanış Fiyatı")
Published by ChaoZhang on the FMZ strategy square · last modified 2024-02-18. Collected in the Quant Trading Vault. Unvalidated research: re-test with your own data and costs before trusting it.
Build this with AgenKit
A spec is not a trading system. Paste this into your coding agent and AgenKit runs a specialist team — architecture, test-first build, risk gates, review — with paper trading on by default.
/agenkit build a production-grade trading bot with a backtest engine, risk controls and paper trading by default from strategies/Dual-Confirmation-MACD-and-RSI-Strategy.md- npx agenkit install engineering-kit in your project
- Paste the command into your agent and approve each phase
- Get tests, backtest, risk controls and a paper-trading switch
Understand it first
Before you run this, read the lesson behind the idea and how to backtest it honestly. Specs like this one are the survivors of an unknown number of trials; deflate their results accordingly.
Related specs
- Bollinger Bands Dynamic Breakout StrategyPine Script · Breakout · 1h
- Cross boundary Dynamic Range Quantitative Trading Strategy Based on Bollinger BandsPine Script · Breakout · 3h
- Momentum Breakout Moving Average StrategyPine Script · Breakout · 1d
- Momentum Breakout Trading Strategy 440964Pine Script · Breakout · 5m
- Moving Average Crossover and Upper Rail Breakthrough Impulse StrategyPine Script · Breakout · 1m
- Multi Indicator Bollinger Bands Trading StrategyPine Script · Breakout · 2h