Strategy vault / Trend following
Dual Moving Average Crossover MACD Quantitative Strategy
This strategy generates the MACD indicator by calculating the difference between the fast and slow moving average lines, and judges the trend and overbought/oversold areas of the financial markets together with the…
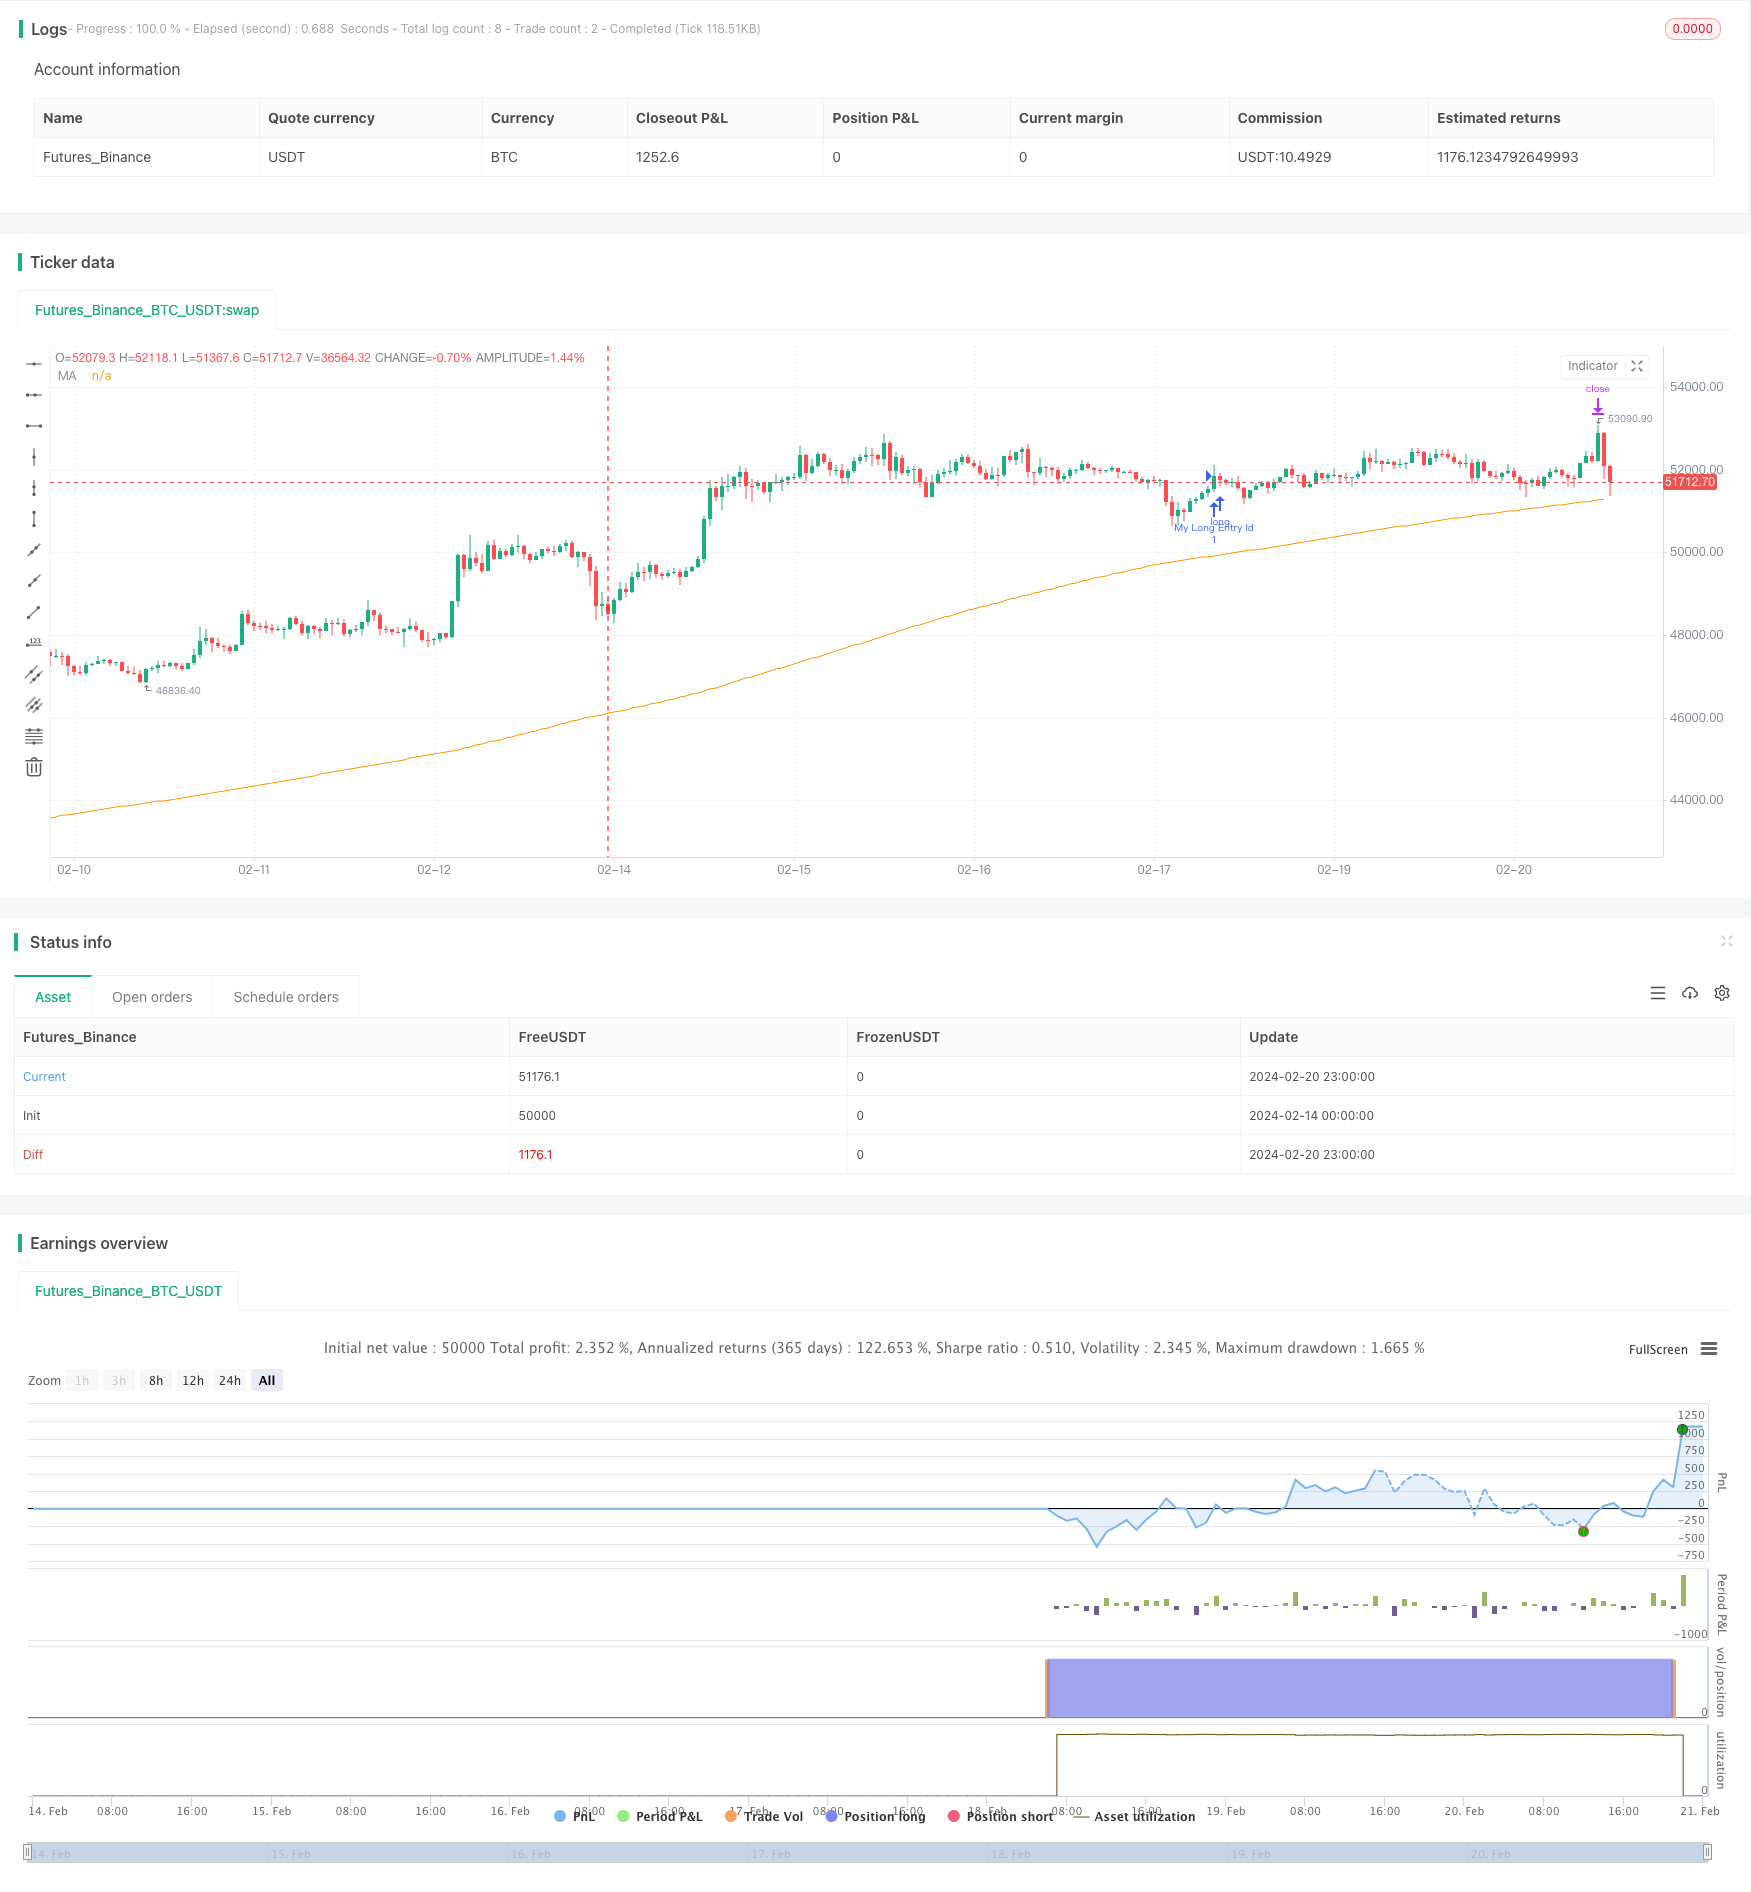
Overview
This strategy generates the MACD indicator by calculating the difference between the fast and slow moving average lines, and judges the trend and overbought/oversold areas of the financial markets together with the signal line. It goes long when the MACD and signal line form a golden cross while the price is above the 200-day MA, and goes short when forms a dead cross while the price is below the 200-day MA. This belongs to a typical dual moving average crossover breakout strategy.
Strategy Logic
The basic logic is using the MACD indicator generated from the fast and slow MA difference to determine the market trend direction, and the signal line to judge the overbought/oversold levels. When MACD and signal line form a golden cross, it is a long signal to go long. When forms a dead cross, it is a short signal to go short. Meanwhile, it uses the price's relationship with the 200-day MA to filter the signals, only taking long signals when price is above 200-day MA and short signals when price is below 200-day MA, so as to avoid whipsaws during strong trends.
The specific calculation method is:
- Fast Moving Average (12-day EMA) minus Slow Moving Average (26-day EMA) to get MACD
- The 9-day EMA of MACD to get the signal line
- MACD minus signal line to get the MACD histogram
When MACD crosses above signal line while they are both below 0, it is a golden cross long signal. When MACD crosses below signal line while they are both above 0, it is a dead cross short signal. Meanwhile, only taking long when price is above 200-day MA, and short when price is below 200-day MA.
Advantages
- Using dual indicator system avoids the limitations of single indicator and improves accuracy
- Combining price action and MA double filters avoids whipsaws during strong trends
- Large parameter optimization space to adapt to different market environments
- Conservative parameter setting leads to fewer but higher quality signals
- Simple and easy-to-implement strategy logic
Risks
- Market volatility may cause errors in indicator judgement
- Lagging nature of MAs affects strategy timeliness
- Fewer signals may miss trend opportunities
- Over-optimization risks when optimizing parameters
- Lack of drawdown control and stop loss mechanisms
Can lower risks by shortening MA periods, adding other indicators, and adding stop loss.
Optimization Directions
1.Tested on different timeframes from 15m upto 1D, optimal results on 4H in risk adjusted returns
2.Optimize fast and slow MA so MACD captures cycles, 7-21 good for 15m
3.Hull MA for MACD gave good results
4.Trailing stoploss improves risk management
Conclusion
This is overall a very simple and practical strategy, generating high probability trading signals through dual indicator system and price filtering. It has relatively high margin of profit, uses the classic MACD parameter combination to avoid over-optimization. There is still large room for optimization by adjusting the MA parameters, adding other indicators and stop loss mechanisms to further improve performance. Overall it is a typical quantitative strategy based on fundamentals.
Parameters
| Name | Default | What it controls |
|---|---|---|
| v_input_1 | 12 | Fast Length |
| v_input_2 | 26 | Slow Length |
| v_input_3_close | 0 | Source: close | high | low | open | hl2 | hlc3 | hlcc4 | ohlc4 |
| v_input_4 | 9 | Signal Smoothing |
| v_input_5 | false | Simple MA (Oscillator) |
| v_input_6 | false | Simple MA (Signal Line) |
| v_input_7 | 200 | movinga 2 |
| v_input_8 | 2 | Short Take Profit (%) |
| v_input_9 | 2 | Long Take Profit (%) |
| v_input_10 | 2 | stoploss in % |
Source Pine Script
/*backtest
start: 2024-02-14 00:00:00
end: 2024-02-21 00:00:00
period: 1h
basePeriod: 15m
exchanges: [{"eid":"Futures_Binance","currency":"BTC_USDT"}]
*/

// This source code is subject to the terms of the Mozilla Public License 2.0 at https://mozilla.org/MPL/2.0/
// © Hurmun

//@version=4
strategy("Simple MACD strategy ", overlay=true, margin_long=100, margin_short=100)


fast_length = input(title="Fast Length", type=input.integer, defval=12)
slow_length = input(title="Slow Length", type=input.integer, defval=26)
src = input(title="Source", type=input.source, defval=close)
signal_length = input(title="Signal Smoothing", type=input.integer, minval = 1, maxval = 50, defval = 9)
sma_source = input(title="Simple MA (Oscillator)", type=input.bool, defval=false)
sma_signal = input(title="Simple MA (Signal Line)", type=input.bool, defval=false)
// Plot colors
col_grow_above = #26A69A
col_grow_below = #FFCDD2
col_fall_above = #B2DFDB
col_fall_below = #EF5350
col_macd = #0094ff
col_signal = #ff6a00
// Calculating
fast_ma = sma_source ? sma(src, fast_length) : ema(src, fast_length)
slow_ma = sma_source ? sma(src, slow_length) : ema(src, slow_length)
macd = fast_ma - slow_ma
signal = sma_signal ? sma(macd, signal_length) : ema(macd, signal_length)
hist = macd - signal


movinga2 = input(title="movinga 2", type=input.integer, defval=200)

movinga200 = sma(close, movinga2)

plot(movinga200, "MA", color.orange)
longCondition = crossover(macd, signal) and macd < 0 and signal < 0 and close > movinga200
if (longCondition)
    strategy.entry("My Long Entry Id", strategy.long)

shortCondition = crossunder(macd, signal) and macd > 0 and signal > 0 and close < movinga200
if (shortCondition)
    strategy.entry("My Short Entry Id", strategy.short)

shortProfitPerc = input(title="Short Take Profit (%)", minval=0.0, step=0.1, defval=2) / 100
longProfitPerc = input(title="Long Take Profit (%)", minval=0.0, step=0.1, defval=2) / 100

stoploss = input(title="stoploss in %", minval = 0.0, step=1, defval=2) /100

longStoploss = strategy.position_avg_price * (1 - stoploss)
longExitPrice  = strategy.position_avg_price * (1 + longProfitPerc)

shortExitPrice = strategy.position_avg_price * (1 - shortProfitPerc)
shortStoploss = strategy.position_avg_price * (1 + stoploss)

if (strategy.position_size > 0 )
    strategy.exit(id="XL TP", limit=longExitPrice, stop=longStoploss)


if (strategy.position_size < 0 )
strategy.exit(id="XS TP", limit=shortExitPrice, stop=shortStoploss)Published by ChaoZhang on the FMZ strategy square · last modified 2024-02-22. Collected in the Quant Trading Vault. Unvalidated research: re-test with your own data and costs before trusting it.
Build this with AgenKit
A spec is not a trading system. Paste this into your coding agent and AgenKit runs a specialist team — architecture, test-first build, risk gates, review — with paper trading on by default.
/agenkit build a production-grade trading bot with a backtest engine, risk controls and paper trading by default from strategies/Dual-Moving-Average-Crossover-MACD-Quantitative-Strategy.md- npx agenkit install engineering-kit in your project
- Paste the command into your agent and approve each phase
- Get tests, backtest, risk controls and a paper-trading switch
Understand it first
Before you run this, read the lesson behind the idea and how to backtest it honestly. Specs like this one are the survivors of an unknown number of trials; deflate their results accordingly.
Related specs
- Bollinger Bands and RSI Trend Following StrategyPine Script · Trend following · 1h
- Dual ATR Channel Trend Following StrategyPine Script · Trend following · 15m
- Dual MA Crossover Trend Tracking StrategyPine Script · Trend following · 1h
- Dynamic Dual EMA Crossover Strategy with Adaptive Profit Loss ControlPine Script · Trend following · 1d
- EMA SMA Multi Indicator Comprehensive Trend Following StrategyPine Script · Trend following · 1h
- EMA and RSI Trend Trading StrategyPine Script · Trend following · 1d