Strategy vault / Trend following
Dynamic Multi Indicator Intraday Trend Following Strategy
This is an intraday trading strategy based on multiple technical indicators, primarily utilizing EMA channels, RSI overbought/oversold levels, and MACD trend confirmation signals. The strategy operates on a 3-minute…
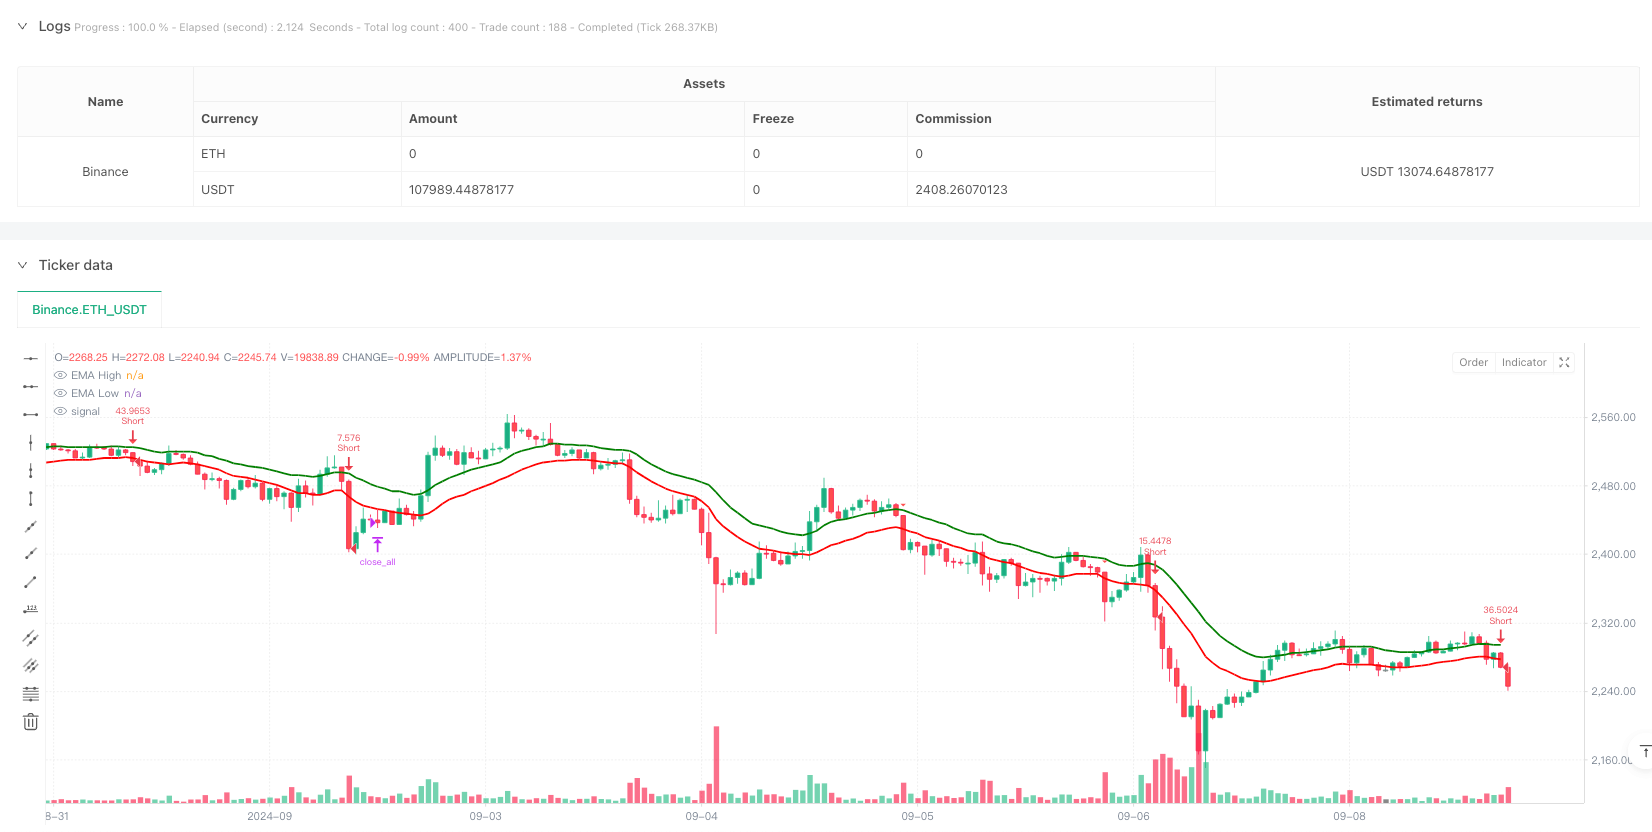
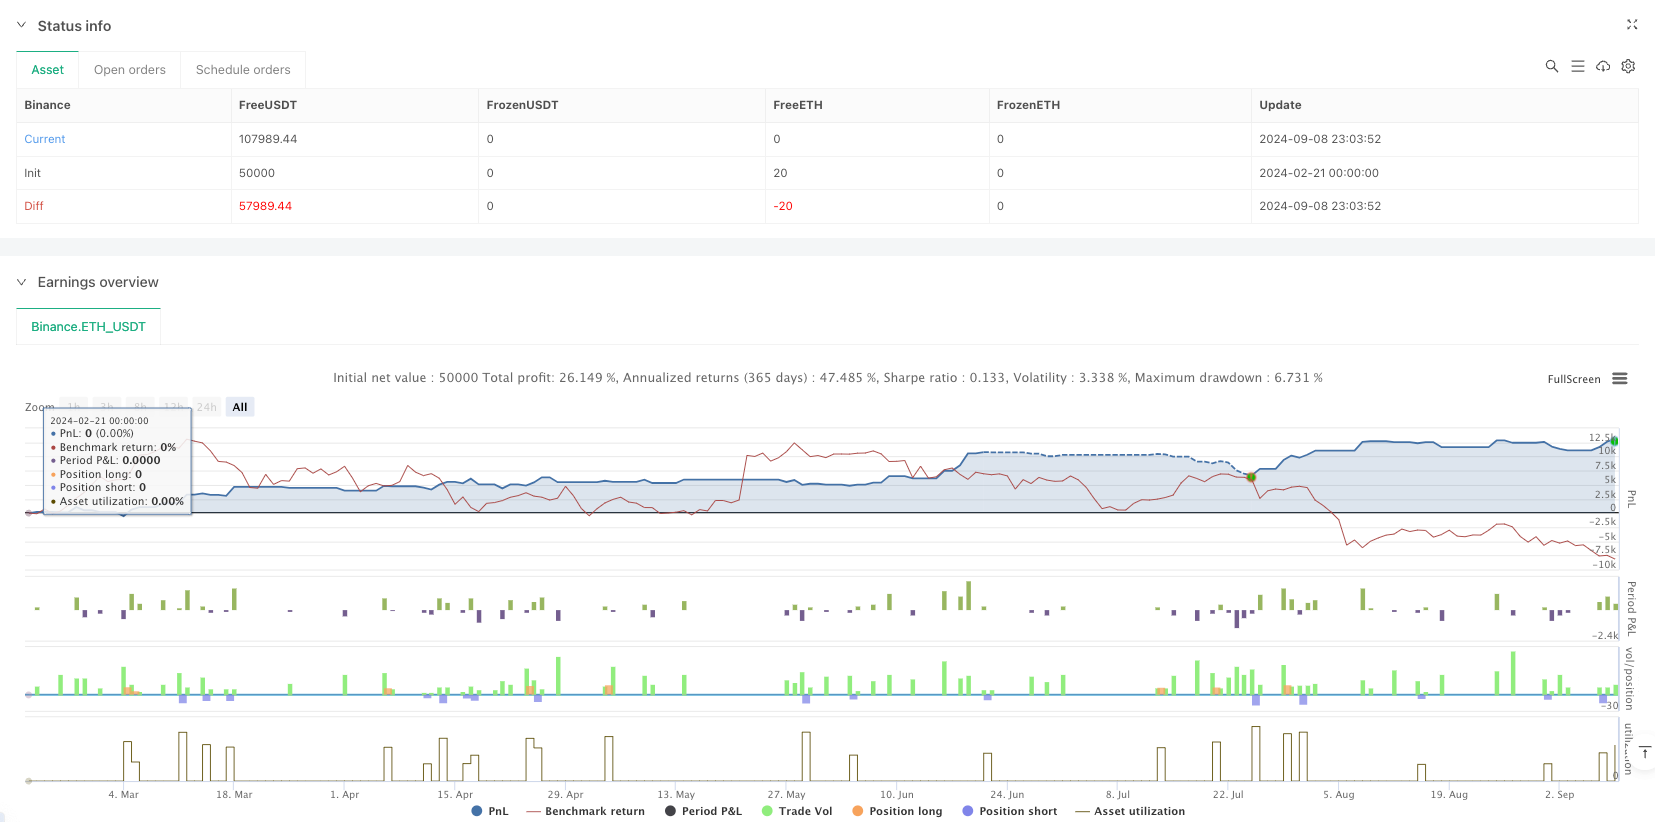
Overview
This is an intraday trading strategy based on multiple technical indicators, primarily utilizing EMA channels, RSI overbought/oversold levels, and MACD trend confirmation signals. The strategy operates on a 3-minute timeframe, capturing market trends through EMA high-low channels combined with RSI and MACD crossover confirmations, featuring ATR-based dynamic stop-loss and take-profit levels, and a fixed session closing time.
Strategy Principles
The strategy uses 20-period EMAs on high and low prices to form a channel, entering positions when price breaks the channel and meets the following conditions:
- Long Entry: Close above EMA high, RSI between 50-70, MACD line crosses above signal line
- Short Entry: Close below EMA low, RSI between 30-50, MACD line crosses below signal line
- Uses ATR for dynamic stop-loss calculation, with 2.5:1 risk-reward ratio for take-profit
- Risks 1% of account per trade, with position sizing based on stop-loss distance
- Forces position closure at 15:00 IST
Strategy Advantages
- Multiple technical indicator cross-validation improves signal reliability
- Dynamic stop-loss based on ATR better adapts to market volatility
- Fixed risk percentage and risk-reward ratio for effective risk control
- Considers trading costs with commission calculations
- Prevents pyramiding to avoid excessive position risk
- Fixed closing time eliminates overnight risk
Strategy Risks
- Multiple indicators may lead to delayed signals affecting entry timing
- EMA channels might generate frequent false breakouts in ranging markets
- Fixed risk-reward ratio may lack flexibility in different market conditions
- RSI range restrictions might miss some strong trend movements
- Forced closure at session end may lead to premature exits at critical levels
Strategy Optimization Directions
- Consider adding volume indicators for additional confirmation
- Implement dynamic risk-reward ratios based on different session volatility characteristics
- Introduce volatility-based dynamic RSI thresholds
- Add trend strength filters to reduce false breakouts
- Consider parameter adjustments based on intraday session characteristics
- Incorporate historical volatility analysis for position sizing optimization
Summary
The strategy constructs a relatively complete trading system through the combination of multiple technical indicators. Its strength lies in comprehensive risk control, including dynamic stops, fixed risk parameters, and session-end closure mechanisms. While there are inherent lag risks, performance can be further enhanced through parameter optimization and additional confirmatory indicators. The strategy is particularly suited for volatile intraday markets, achieving stable returns through strict risk control and multiple signal confirmation.
Source Pine Script
/*backtest
start: 2024-02-21 00:00:00
end: 2024-09-09 00:00:00
period: 1h
basePeriod: 1h
exchanges: [{"eid":"Binance","currency":"ETH_USDT"}]
*/

//@version=6
strategy("Intraday 3min EMA HL Strategy v6",
     overlay=true,
     margin_long=100,
     margin_short=100,
     initial_capital=100000,
     default_qty_type=strategy.percent_of_equity,
     default_qty_value=100,
     commission_type=strategy.commission.percent,
     commission_value=0.05,
     calc_on_every_tick=false,
     process_orders_on_close=true,
     pyramiding=0)

// Input Parameters
i_emaLength = input.int(20, "EMA Length", minval=5, group="Strategy Parameters")
i_rsiLength = input.int(14, "RSI Length", minval=5, group="Strategy Parameters")
i_atrLength = input.int(14, "ATR Length", minval=5, group="Risk Management")
i_rrRatio = input.float(2.5, "Risk:Reward Ratio", minval=1, maxval=10, step=0.5, group="Risk Management")
i_riskPercent = input.float(1, "Risk % per Trade", minval=0.1, maxval=5, step=0.1, group="Risk Management")

// Time Exit Parameters (IST)
i_exitHour = input.int(15, "Exit Hour (IST)", minval=0, maxval=23, group="Session Rules")
i_exitMinute = input.int(0, "Exit Minute (IST)", minval=0, maxval=59, group="Session Rules")

// Indicator Calculations
emaHigh = ta.ema(high, i_emaLength)
emaLow = ta.ema(low, i_emaLength)

rsi = ta.rsi(close, i_rsiLength)
atr = ta.atr(i_atrLength)

fastMA = ta.ema(close, 12)
slowMA = ta.ema(close, 26)
macdLine = fastMA - slowMA
signalLine = ta.ema(macdLine, 9)

// Time Calculations (UTC to IST Conversion)
istHour = (hour(time) + 5) % 24  // UTC+5
istMinute = minute(time) + 30    // 30 minute offset
istHour += istMinute >= 60 ? 1 : 0
istMinute := istMinute % 60

// Exit Condition
timeExit = istHour > i_exitHour or (istHour == i_exitHour and istMinute >= i_exitMinute)

// Entry Conditions (Multi-line formatting fix)
longCondition = close > emaHigh and
     rsi > 50 and
     rsi < 70 and
     ta.crossover(macdLine, signalLine)

shortCondition = close < emaLow and
     rsi < 50 and
     rsi > 30 and
     ta.crossunder(macdLine, signalLine)

// Risk Calculations
var float entryPrice = na
var float stopLoss = na
var float takeProfit = na
var float posSize = na

// Strategy Logic
if longCondition and not timeExit and strategy.position_size == 0
    entryPrice := close
    stopLoss := math.min(low, entryPrice - atr)
    takeProfit := entryPrice + (entryPrice - stopLoss) * i_rrRatio
    posSize := strategy.equity * i_riskPercent / 100 / (entryPrice - stopLoss)
    strategy.entry("Long", strategy.long, qty=posSize)
    strategy.exit("Long Exit", "Long", stop=stopLoss, limit=takeProfit)

if shortCondition and not timeExit and strategy.position_size == 0
    entryPrice := close
    stopLoss := math.max(high, entryPrice + atr)
    takeProfit := entryPrice - (stopLoss - entryPrice) * i_rrRatio
    posSize := strategy.equity * i_riskPercent / 100 / (stopLoss - entryPrice)
    strategy.entry("Short", strategy.short, qty=posSize)
    strategy.exit("Short Exit", "Short", stop=stopLoss, limit=takeProfit)

// Force Close at Session End
if timeExit
    strategy.close_all()

// Visual Components
plot(emaHigh, "EMA High", color=color.rgb(0, 128, 0), linewidth=2)
plot(emaLow, "EMA Low", color=color.rgb(255, 0, 0), linewidth=2)

plotshape(longCondition, "Long Signal", shape.triangleup,
  location.belowbar, color=color.green, size=size.small)
plotshape(shortCondition, "Short Signal", shape.triangledown,
  location.abovebar, color=color.red, size=size.small)

// Debugging Table
var table infoTable = table.new(position.top_right, 3, 3)
if barstate.islast
    table.cell(infoTable, 0, 0, "EMA High: " + str.tostring(emaHigh, "#.00"))
    table.cell(infoTable, 0, 1, "EMA Low: " + str.tostring(emaLow, "#.00"))
table.cell(infoTable, 0, 2, "Current RSI: " + str.tostring(rsi, "#.00"))Published by ianzeng123 on the FMZ strategy square · last modified 2025-02-21. Collected in the Quant Trading Vault. Unvalidated research: re-test with your own data and costs before trusting it.
Build this with AgenKit
A spec is not a trading system. Paste this into your coding agent and AgenKit runs a specialist team — architecture, test-first build, risk gates, review — with paper trading on by default.
/agenkit build a production-grade trading bot with a backtest engine, risk controls and paper trading by default from strategies/Dynamic-Multi-Indicator-Intraday-Trend-Following-Strategy.md- npx agenkit install engineering-kit in your project
- Paste the command into your agent and approve each phase
- Get tests, backtest, risk controls and a paper-trading switch
Understand it first
Before you run this, read the lesson behind the idea and how to backtest it honestly. Specs like this one are the survivors of an unknown number of trials; deflate their results accordingly.
Related specs
- Adaptive ATR and RSI Trend Following Strategy with Trailing Stop LossPine Script · Trend following · 1h
- Bollinger Bands and RSI Trend Following StrategyPine Script · Trend following · 1h
- Dual ATR Channel Trend Following StrategyPine Script · Trend following · 15m
- Dynamic Dual EMA Crossover Strategy with Adaptive Profit Loss ControlPine Script · Trend following · 1d
- EMA and RSI Trend Trading StrategyPine Script · Trend following · 1d
- Fixed Range Volume Profile And Anchored VWAP Trend Identification Strategy With Dynamic Stop LossPine Script · Trend following · 1h