Strategy vault / Trend following
Dynamic RSI Enhanced EMA Trend Trading Strategy
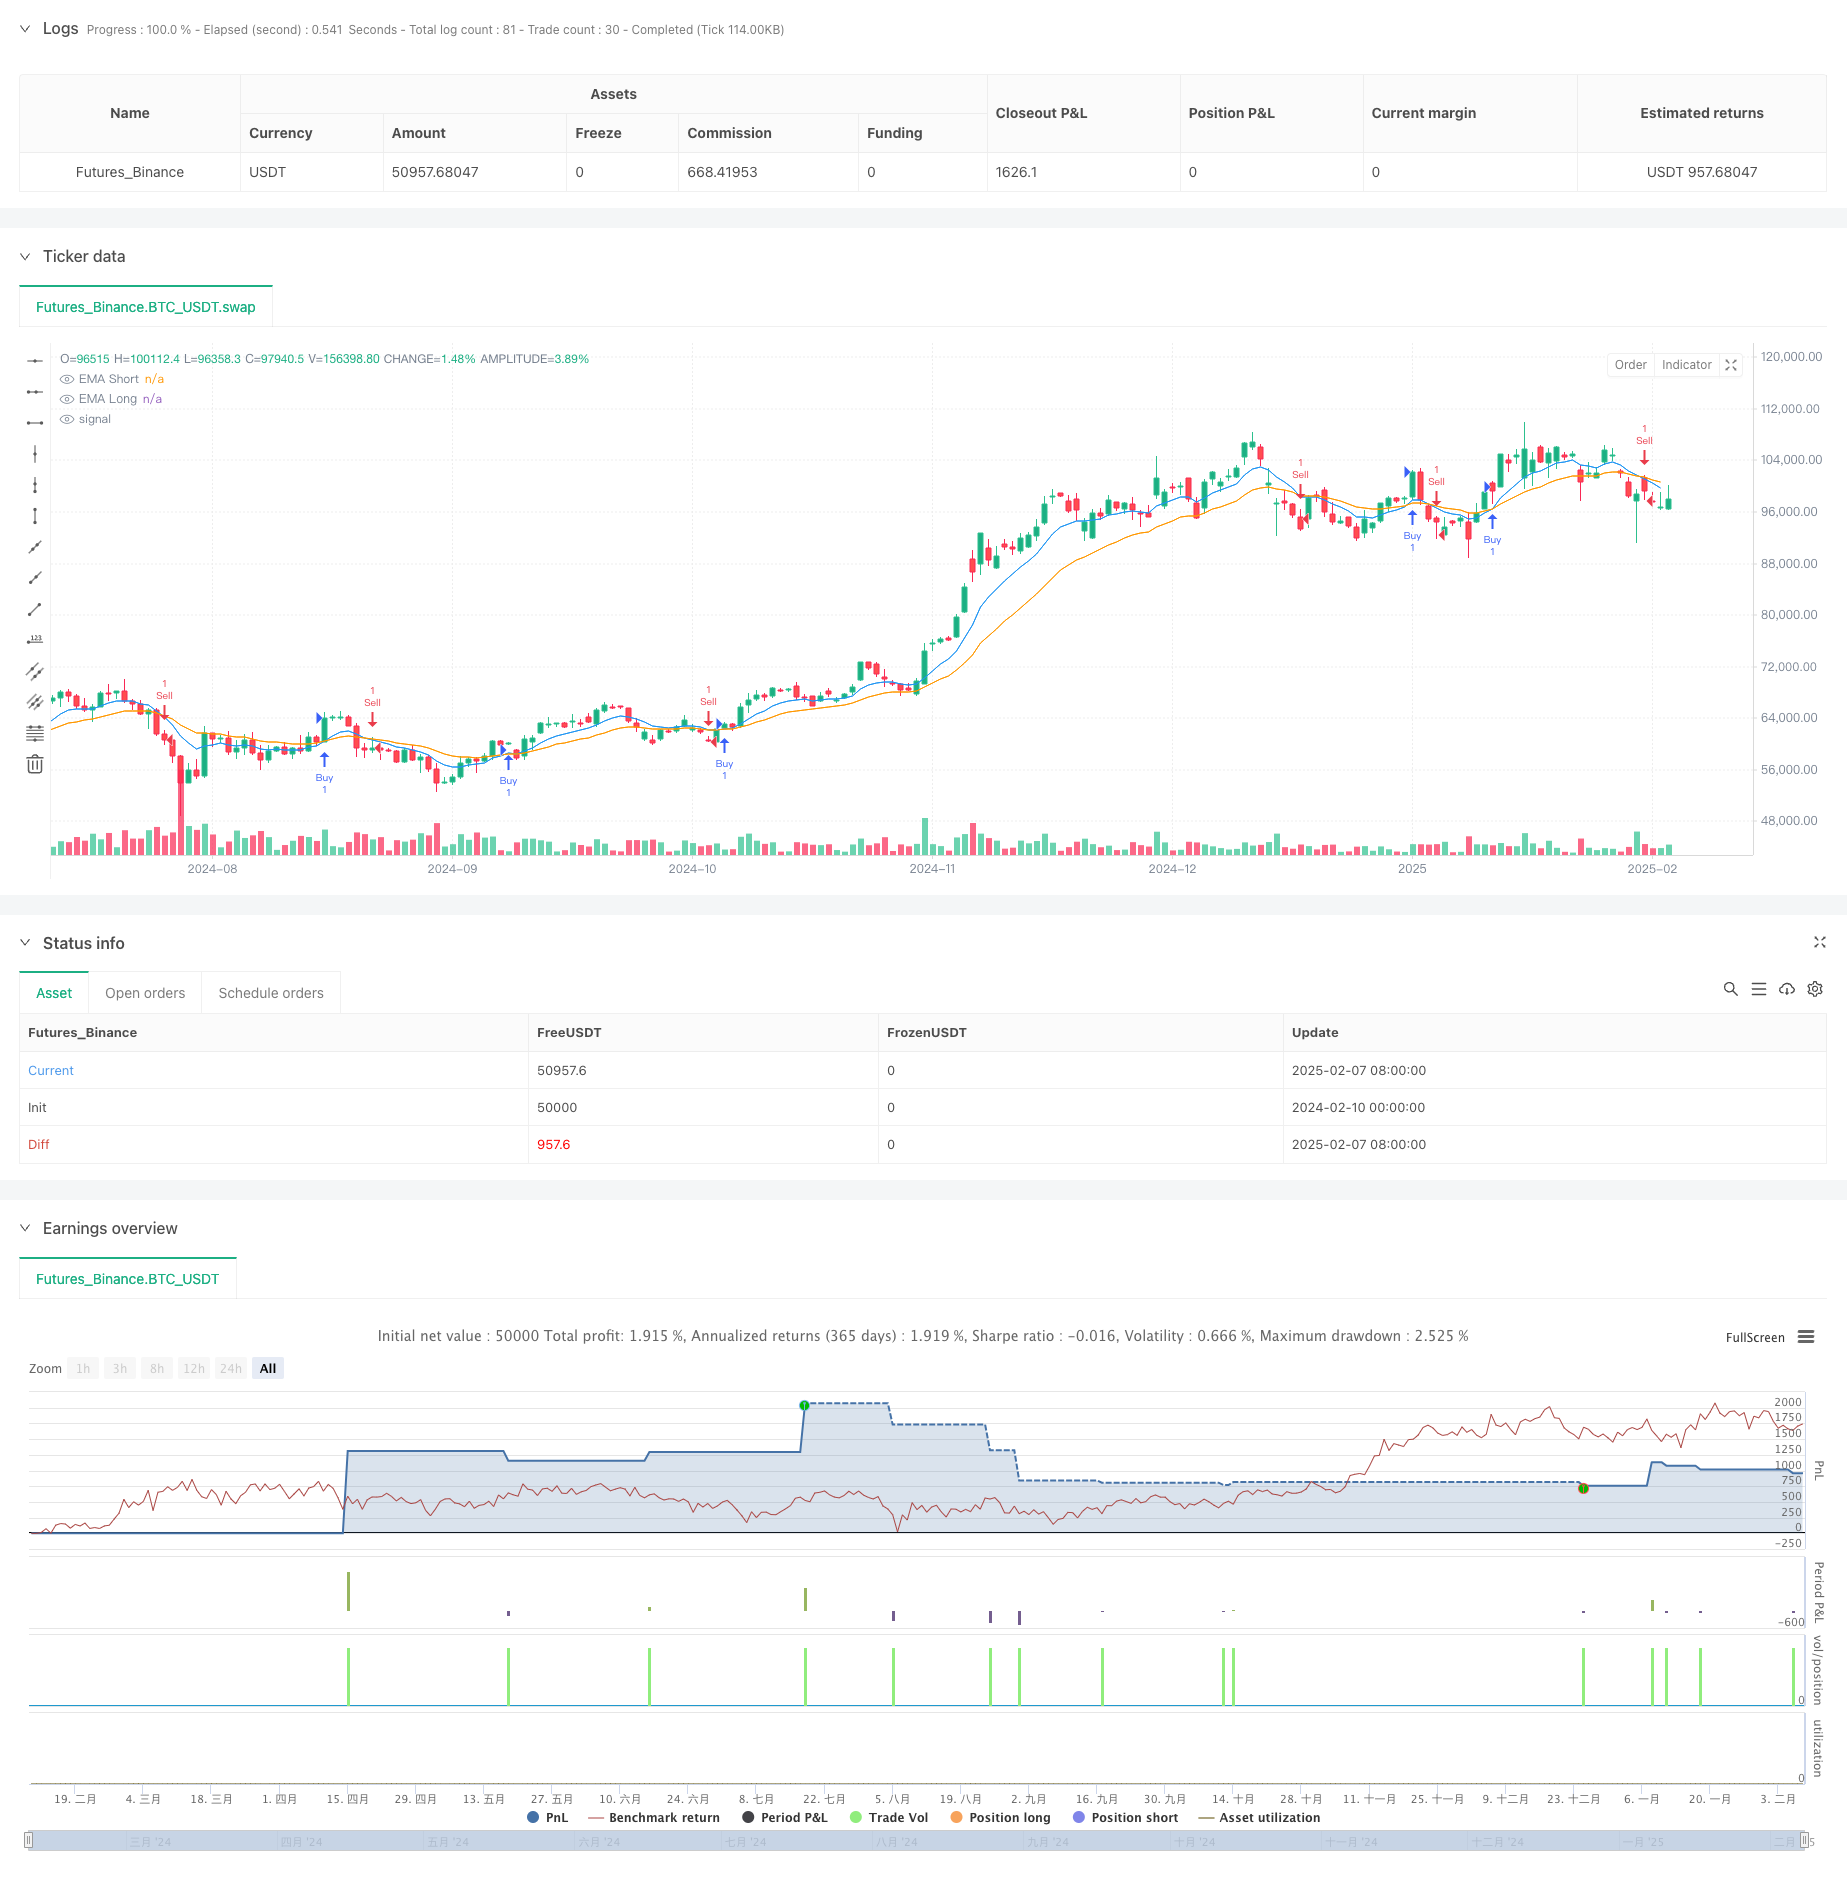
This strategy is a dynamic trend following system that combines Exponential Moving Averages (EMA) with Relative Strength Index (RSI). It identifies trend direction through 9-period and 21-period EMA crossovers, using…
Overview
This strategy is a dynamic trend following system that combines Exponential Moving Averages (EMA) with Relative Strength Index (RSI). It identifies trend direction through 9-period and 21-period EMA crossovers, using RSI as trend confirmation. The strategy includes a comprehensive money management system with dynamic stop-loss and profit target settings.
Strategy Principles
The core logic is based on several key elements:
- Using short-term (9-period) and long-term (21-period) EMA crossovers to capture trend changes
- Confirming trends with 14-period RSI, requiring RSI>50 for longs and RSI<50 for shorts
- Implementing fixed-point stop-losses (default 30 points) with dynamic position sizing based on risk amount
- Calculating profit targets dynamically using money management parameters
- Displaying real-time entry markers, target prices, and stop-loss levels on the chart
Strategy Advantages
- Combines trend and momentum indicators for improved signal reliability
- Complete money management system adaptable to account size
- Clear visual feedback system including trade failure markers
- Fully customizable parameters to suit different trading styles
- Automated entry and exit execution reducing manual intervention
Strategy Risks
- EMA as a lagging indicator may generate delayed signals in volatile markets
- Frequent false breakout signals possible in ranging markets
- Fixed-point stop-losses may lack flexibility during volatility changes
- Careful parameter adjustment needed for different market conditions
- Potential slippage risks in low liquidity environments
Strategy Optimization Directions
- Introduce adaptive stop-loss mechanisms, such as ATR-based dynamic stops
- Add market volatility filters to adjust strategy parameters during high volatility
- Implement trading time filters to avoid unfavorable periods
- Develop smarter position sizing system considering market volatility
- Incorporate additional indicators to filter false signals
Summary
This strategy establishes a complete trend following system by combining EMA crossovers with RSI confirmation. Its main strength lies in the organic integration of technical analysis and risk management, offering good scalability and adaptability. While inherent risks exist, through continuous optimization and parameter adjustment, the strategy can provide traders with a robust trading framework.
Source Pine Script
/*backtest
start: 2024-02-10 00:00:00
end: 2025-02-08 08:00:00
period: 1d
basePeriod: 1d
exchanges: [{"eid":"Futures_Binance","currency":"BTC_USDT"}]
*/

// This Pine Script™ code is subject to the terms of the Mozilla Public License 2.0 at https://mozilla.org/MPL/2.0/
// © Lukhi24

//@version=6
strategy("Lukhi EMA Crossover_TWL educational strategy", overlay=true)

// Input Parameters
capital = input.float(15000, title="Capital (₹)", tooltip="Total capital")
risk_per_trade = input.float(1000, title="Risk per Trade (₹)", tooltip="Risk per trade amount")
target_per_trade = input.float(5000, title="Take Profit per Trade (₹)", tooltip="Target profit per trade")
lot_size = input.int(1, title="Lot Size", tooltip="Nifty option lot size")
stop_loss_distance = input.float(30, title="Stop Loss Distance (Points)", tooltip="Fixed stop-loss in points")

// EMA Parameters
short_ema_length = input.int(9, title="Short EMA Length")
long_ema_length = input.int(21, title="Long EMA Length")

// RSI Parameters
rsi_length = input.int(14, title="RSI Length")
rsi_overbought = input.float(70, title="RSI Overbought Level")
rsi_oversold = input.float(30, title="RSI Oversold Level")

// Calculate EMAs and RSI
ema_short = ta.ema(close, short_ema_length)
ema_long = ta.ema(close, long_ema_length)
rsi = ta.rsi(close, rsi_length)

// Buy and Sell Signals
buy_signal = ta.crossover(ema_short, ema_long) and rsi > 50
sell_signal = ta.crossunder(ema_short, ema_long) and rsi < 50

// Plot EMAs
plot(ema_short, color=color.blue, title="EMA Short")
plot(ema_long, color=color.orange, title="EMA Long")

// Position Size Calculation
position_size = risk_per_trade / stop_loss_distance

// Stop Loss and Take Profit Levels
long_stop_loss = close - stop_loss_distance
long_take_profit = close + (target_per_trade / position_size)

short_stop_loss = close + stop_loss_distance
short_take_profit = close - (target_per_trade / position_size)

// Entry and Exit Logic
if buy_signal
    strategy.entry("Buy", strategy.long, qty=lot_size)
    strategy.exit("Exit Buy", "Buy", stop=long_stop_loss, limit=long_take_profit)

if sell_signal
    strategy.entry("Sell", strategy.short, qty=lot_size)
    strategy.exit("Exit Sell", "Sell", stop=short_stop_loss, limit=short_take_profit)

// Add Entry Signal Labels
var label long_label = na
var label short_label = na

if buy_signal
    label.delete(long_label)
    long_label := label.new(bar_index,close,text="BUY\nEntry: " + str.tostring(close, "#.##") + "\nTarget: " + str.tostring(long_take_profit, "#.##") + "\nSL: " + str.tostring(long_stop_loss, "#.##"),style=label.style_label_up,color=color.rgb(12, 90, 90, 73),textcolor=#010000)

if sell_signal
    label.delete(short_label)
    short_label := label.new(bar_index,close,text="SELL\nEntry: " + str.tostring(close, "#.##") + "\nTarget: " + str.tostring(short_take_profit, "#.##") + "\nSL: " + str.tostring(short_stop_loss, "#.##"),style=label.style_label_down,color=#5d371752,textcolor=#000000)

// Trade Failure Indicators
long_trade_loss = strategy.position_size > 0 and close <= long_stop_loss
short_trade_loss = strategy.position_size < 0 and close >= short_stop_loss

plotshape(long_trade_loss, location=location.belowbar, color=color.red, style=shape.cross, title="Long Trade Failed", text="SL Hit")
plotshape(short_trade_loss, location=location.abovebar, color=color.red, style=shape.cross, title="Short Trade Failed", text="SL Hit")
Published by ChaoZhang on the FMZ strategy square · last modified 2025-02-10. Collected in the Quant Trading Vault. Unvalidated research: re-test with your own data and costs before trusting it.
Build this with AgenKit
A spec is not a trading system. Paste this into your coding agent and AgenKit runs a specialist team — architecture, test-first build, risk gates, review — with paper trading on by default.
/agenkit build a production-grade trading bot with a backtest engine, risk controls and paper trading by default from strategies/Dynamic-RSI-Enhanced-EMA-Trend-Trading-Strategy.md- npx agenkit install engineering-kit in your project
- Paste the command into your agent and approve each phase
- Get tests, backtest, risk controls and a paper-trading switch
Understand it first
Before you run this, read the lesson behind the idea and how to backtest it honestly. Specs like this one are the survivors of an unknown number of trials; deflate their results accordingly.
Related specs
- Adaptive ATR and RSI Trend Following Strategy with Trailing Stop LossPine Script · Trend following · 1h
- Bollinger Bands and RSI Trend Following StrategyPine Script · Trend following · 1h
- Dual ATR Channel Trend Following StrategyPine Script · Trend following · 15m
- Dual Mode Adaptive Trend Trading Strategy EMA Crossover with ATR Volatility Based Risk Management SystemPine Script · Trend following · 1d
- Dynamic Dual EMA Crossover Strategy with Adaptive Profit Loss ControlPine Script · Trend following · 1d
- Dynamic Multi Timeframe ATR Crossover Strategy Optimizing Trend Following and Risk Management with Flexible ParametersPine Script · Trend following · 1h