Strategy vault / Trend following
Dynamic RSI Low High Point Divergence Trend Strategy
This article elaborates on a trend trading strategy based on the Relative Strength Index (RSI) low-high point divergence. The strategy captures potential trend reversal opportunities by identifying divergences…
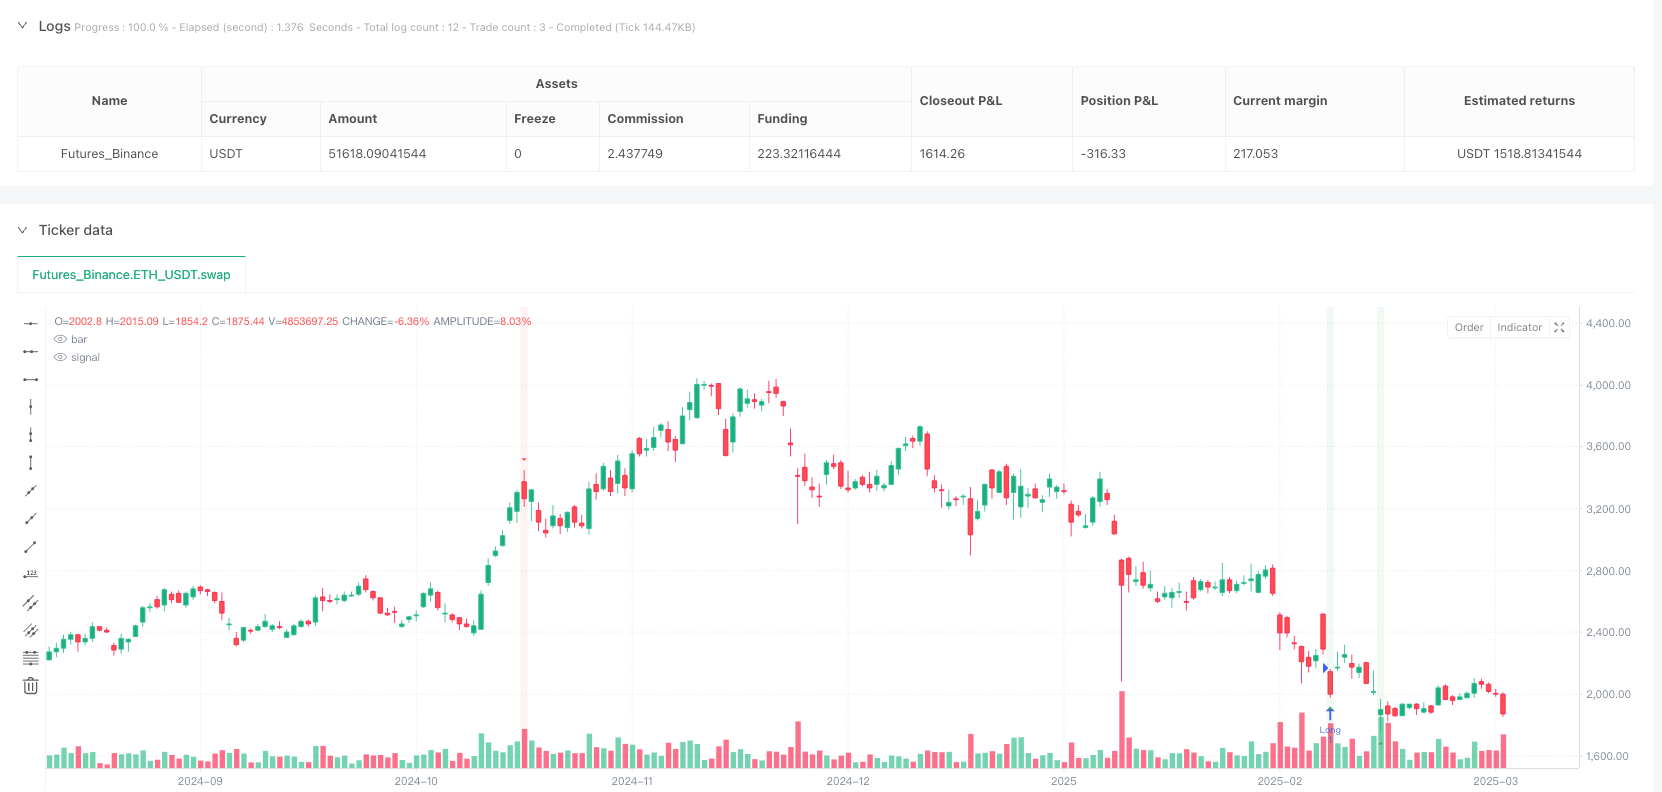
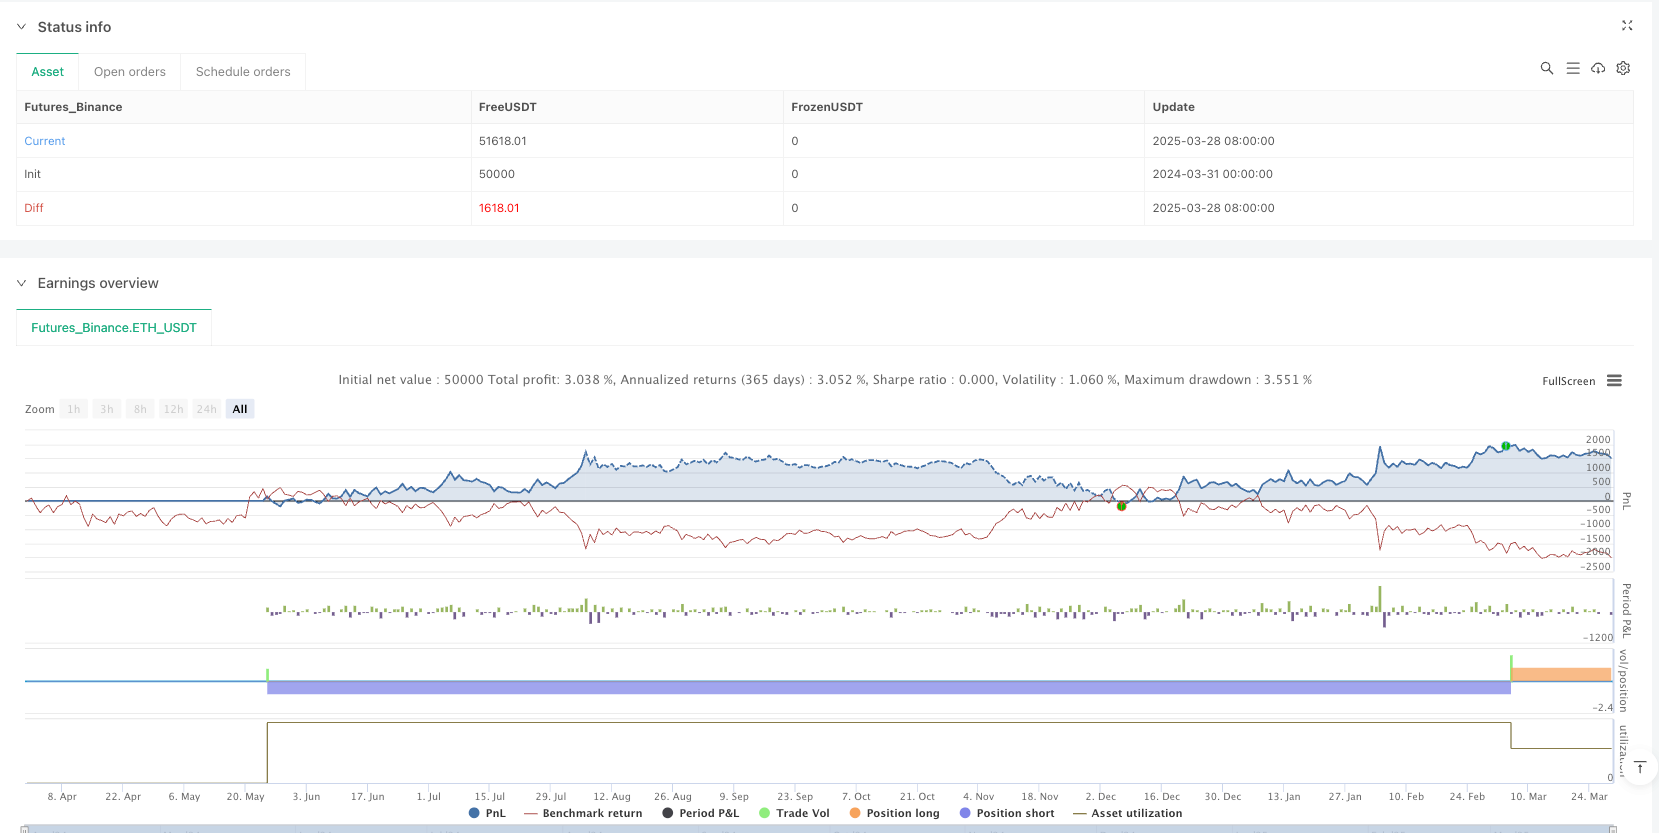
Overview
This article elaborates on a trend trading strategy based on the Relative Strength Index (RSI) low-high point divergence. The strategy captures potential trend reversal opportunities by identifying divergences between price and RSI indicators, providing traders with precise entry and exit signals. The strategy uniquely combines visual signals and technical indicator analysis to enhance the accuracy and timeliness of trading decisions.
Strategy Principles
The core principle is based on the RSI low-high point divergence theory. Key implementation steps include:
- RSI Calculation: Using 14-period RSI length to assess market overbought and oversold states.
- Price Extreme Identification: Determining low and high points through lookback period.
- Divergence Judgment Mechanism:
- Bullish Divergence: Price makes a new low, but RSI does not synchronously decline
- Bearish Divergence: Price makes a new high, but RSI does not synchronously rise
- Signal Generation:
- Bullish divergence in oversold zone (below 30)
- Bearish divergence in overbought zone (above 70)
Strategy Advantages
- High-precision Signal Identification: Reduce false signals through strict divergence conditions.
- Visualization of Signals: Large triangular markers and background highlighting enhance readability.
- High Flexibility: Adjustable RSI parameters, lookback periods, and overbought/oversold thresholds.
- Multi-timeframe Adaptability: Best performance on 1-hour to 4-hour periods.
- Debugging Functionality: Built-in debug table for verifying key indicators.
Strategy Risks
- Misjudgment Risk: Divergence signals are not 100% accurate.
- Market Volatility: May underperform in strongly trending markets.
- Parameter Sensitivity: Improper RSI and lookback period settings can reduce strategy effectiveness.
- Transaction Costs: Frequent trading may incur high commission and slippage expenses.
Strategy Optimization Directions
- Multi-indicator Confirmation: Incorporate moving averages, MACD to improve signal accuracy.
- Dynamic Parameter Adjustment: Intelligently adjust RSI parameters based on market volatility.
- Stop-loss Mechanism: Introduce ATR-based dynamic stop-loss strategy.
- Machine Learning Optimization: Use machine learning algorithms to optimize entry and exit points.
- Risk Management: Adjust position sizes based on market volatility.
Summary
The Dynamic RSI Low-High Point Divergence Trend Strategy provides traders with an efficient trend trading method through precise technical indicator analysis and visual signals. Continuous optimization and risk management can help maintain stable performance across different market environments.
Source Pine Script
/*backtest
start: 2024-03-31 00:00:00
end: 2025-03-29 08:00:00
period: 1d
basePeriod: 1d
exchanges: [{"eid":"Futures_Binance","currency":"ETH_USDT"}]
*/

//@version=6
strategy("RSI Divergence Strategy - Visible Signals", overlay=true)

// 1. Basic Inputs (Keep it simple)
rsiLength = input.int(14, "RSI Length")
lookback = input.int(10, "Lookback Period", minval=5)
oversold = input.int(30, "Oversold Level")
overbought = input.int(70, "Overbought Level")

// 2. Calculate Indicators
rsi = ta.rsi(close, rsiLength)
priceLow = ta.lowest(low, lookback)
priceHigh = ta.highest(high, lookback)
rsiLow = ta.lowest(rsi, lookback)
rsiHigh = ta.highest(rsi, lookback)

// 3. Simple Divergence Detection
bullishDiv = low == priceLow and rsi > rsiLow and rsi < oversold
bearishDiv = high == priceHigh and rsi < rsiHigh and rsi > overbought

// 4. Visual Signals (Large and Clear)
plotshape(bullishDiv, "Buy", shape.triangleup, location.belowbar,
     color=color.new(color.green, 0), size=size.large)
plotshape(bearishDiv, "Sell", shape.triangledown, location.abovebar,
     color=color.new(color.red, 0), size=size.large)

// 5. Optional: Add Background for Better Visibility
bgcolor(bullishDiv ? color.new(color.green, 90) : bearishDiv ? color.new(color.red, 90) : na)

// 6. Basic Strategy Execution
if bullishDiv
    strategy.entry("Long", strategy.long)

if bearishDiv
    strategy.entry("Short", strategy.short)

// 7. Debugging Table (To verify values)
var table debugTable = table.new(position.top_right, 4, 1)
if barstate.islast
    table.cell(debugTable, 0, 0, "RSI: " + str.tostring(rsi))
    table.cell(debugTable, 1, 0, "Price Low: " + str.tostring(priceLow))
    table.cell(debugTable, 2, 0, "RSI Low: " + str.tostring(rsiLow))
    table.cell(debugTable, 3, 0, "Signal: " + (bullishDiv ? "BUY" : bearishDiv ? "SELL" : "NONE"))
    // Test Settings (paste these above the strategy call)
//rsiLength := 5
//lookback := 5
//oversold := 20
//overbought := 80
Published by ianzeng123 on the FMZ strategy square · last modified 2025-03-31. Collected in the Quant Trading Vault. Unvalidated research: re-test with your own data and costs before trusting it.
Build this with AgenKit
A spec is not a trading system. Paste this into your coding agent and AgenKit runs a specialist team — architecture, test-first build, risk gates, review — with paper trading on by default.
/agenkit build a production-grade trading bot with a backtest engine, risk controls and paper trading by default from strategies/Dynamic-RSI-Low-High-Point-Divergence-Trend-Strategy.md- npx agenkit install engineering-kit in your project
- Paste the command into your agent and approve each phase
- Get tests, backtest, risk controls and a paper-trading switch
Understand it first
Before you run this, read the lesson behind the idea and how to backtest it honestly. Specs like this one are the survivors of an unknown number of trials; deflate their results accordingly.
Related specs
- Adaptive ATR and RSI Trend Following Strategy with Trailing Stop LossPine Script · Trend following · 1h
- Advanced Supertrend Indicator Trading Mechanism Optimization StrategyPine Script · Trend following · 1d
- Bollinger Bands and RSI Trend Following StrategyPine Script · Trend following · 1h
- Dual ATR Channel Trend Following StrategyPine Script · Trend following · 15m
- Dual Indicator Dynamic Trend Trading Strategy Multi dimensional Technical Analysis System Based on RSI and MACDPine Script · Trend following
- Dynamic Dual EMA Crossover Strategy with Adaptive Profit Loss ControlPine Script · Trend following · 1d