Strategy vault / Trend following
Dynamic Trend Following Strategy 434996
The main idea of this strategy is to dynamically track market trends by buying when the trend goes up and selling when the trend goes down. It combines multiple technical indicators to determine the trend direction…
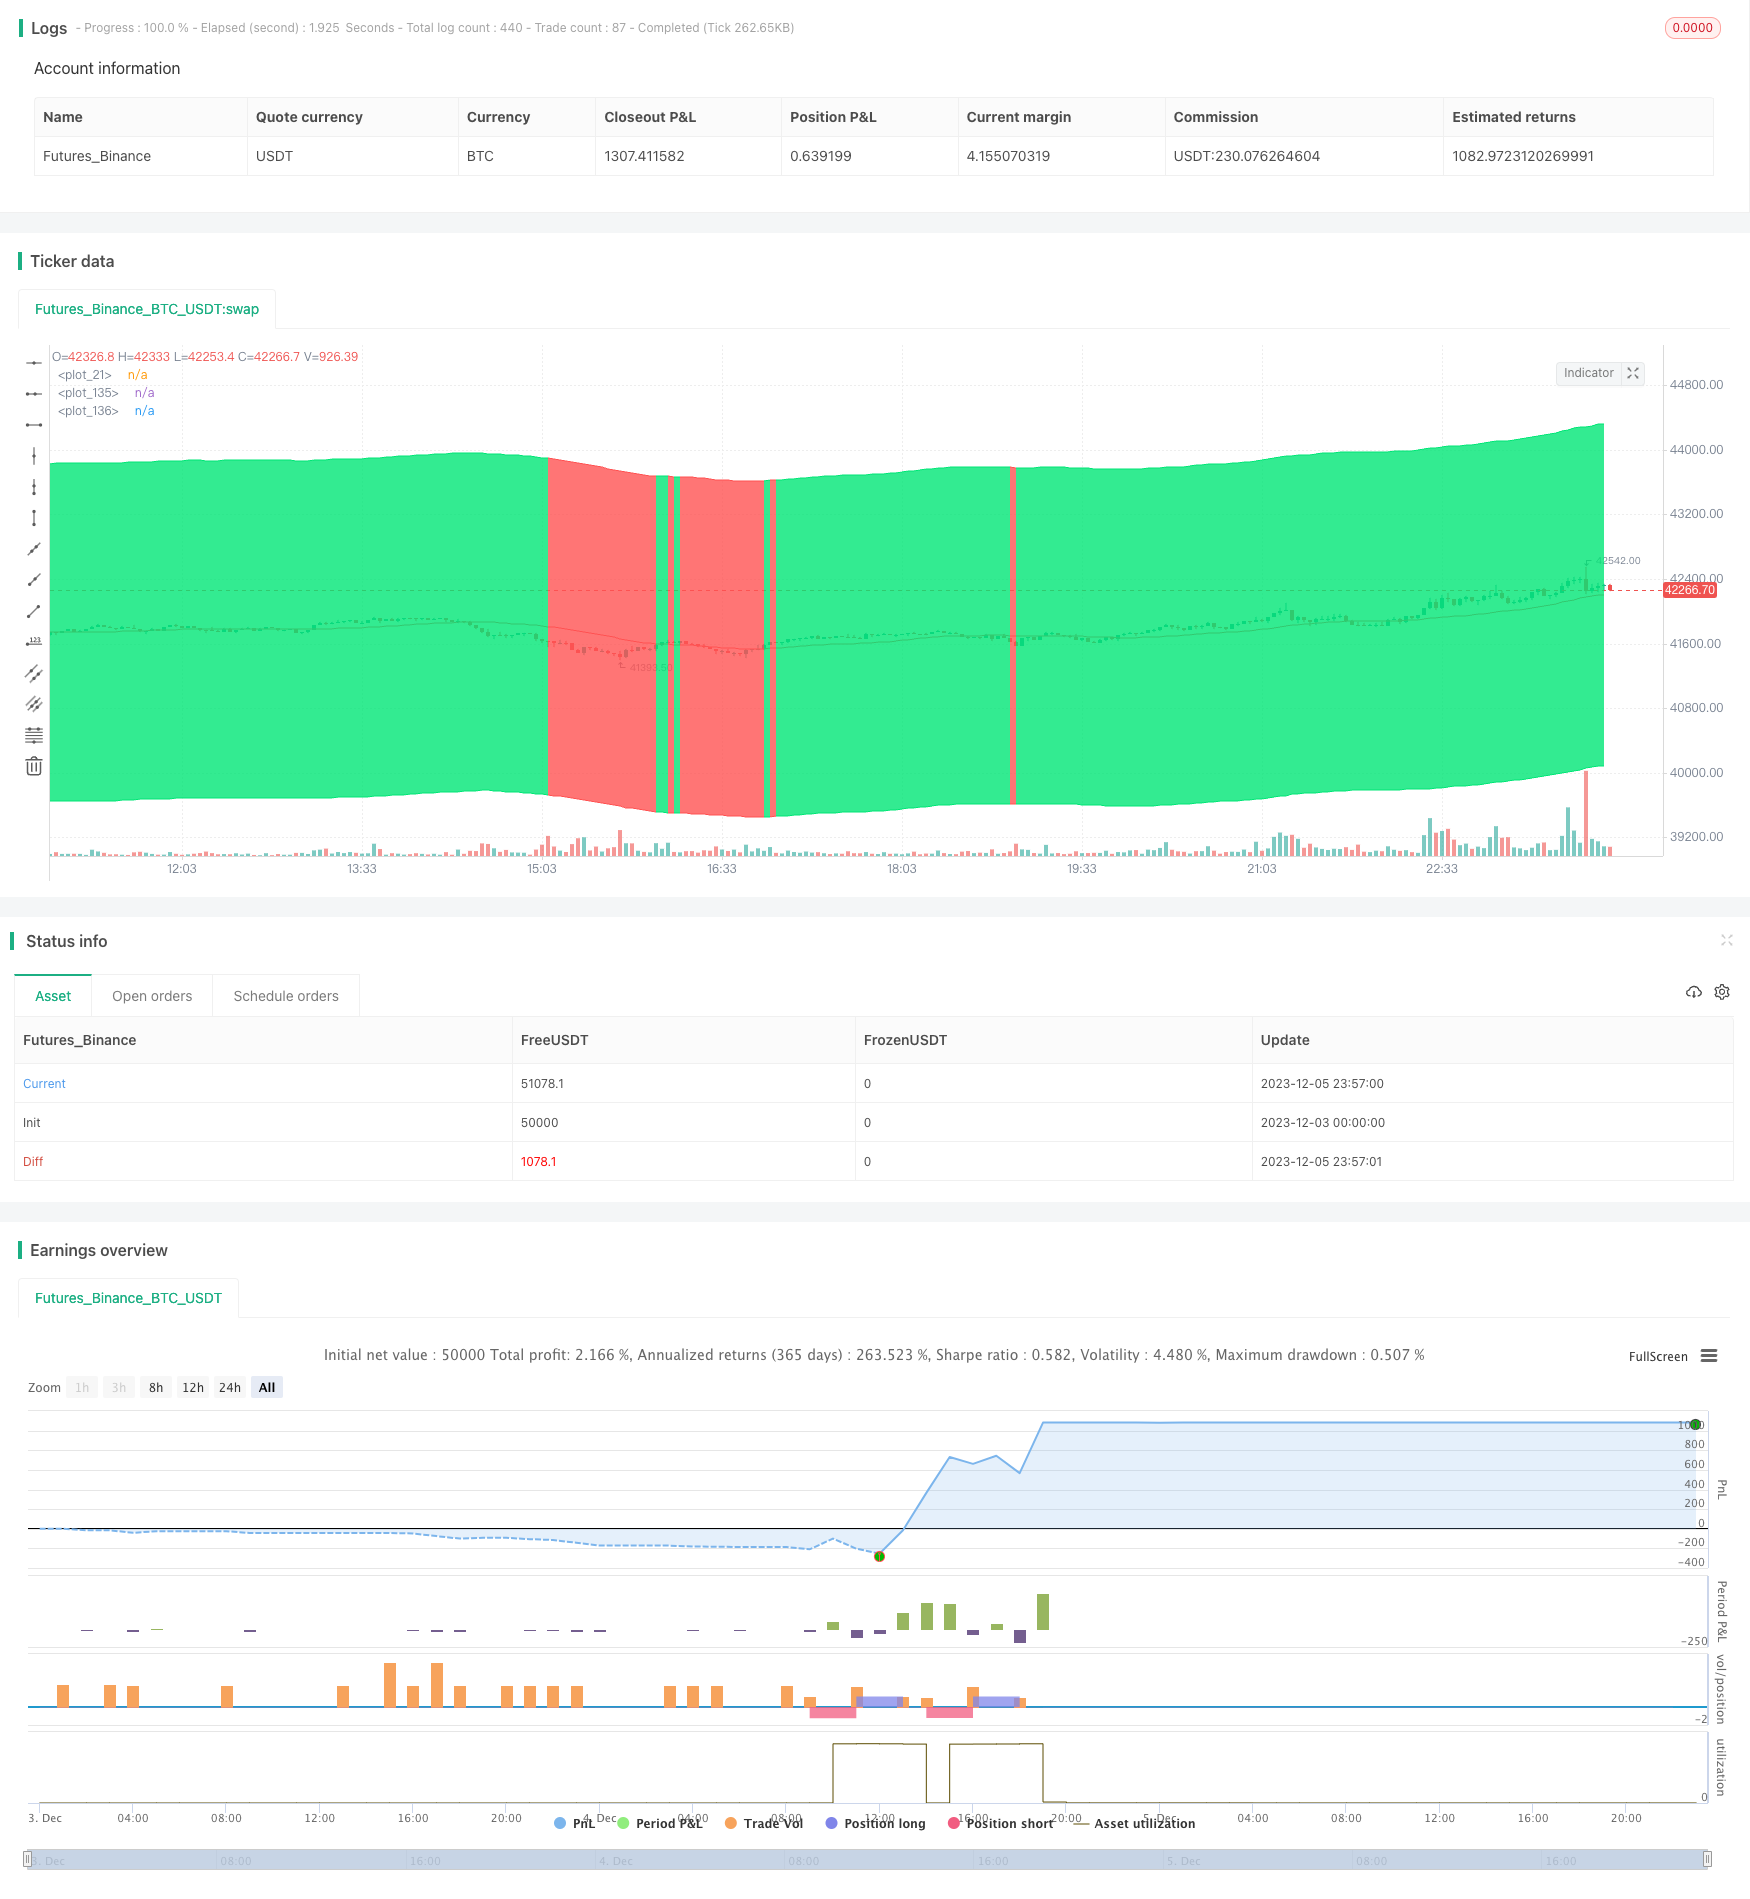
Overview
The main idea of this strategy is to dynamically track market trends by buying when the trend goes up and selling when the trend goes down. It combines multiple technical indicators to determine the trend direction, such as linear regression, modified Hull Moving Average, etc.
Strategy Logic
This strategy utilizes various technical indicators to determine the trend direction. First, it calculates a price channel, with the upper and lower limits based on the simple moving average of close and an input parameter. Then, it calculates the modified Hull Moving Average, which is considered better at depicting trends. In addition, the linear regression indicator is also calculated. It generates buy signals when the modified HMA crosses above the linear regression line, and sell signals when crossing below. This allows dynamically tracking changes in the trend.
To reduce false signals, the strategy also incorporates several filters, such as using EMA to determine if it's in a downtrend, and a windowed indicator to check for RSI divergence. These filters help avoid taking trades during choppy, sideways markets.
For entries and exits, the strategy records the price of the last open position, and sets take profit and stop loss percentages. For example, if the last long entry price is $100, it may set the take profit target at $102, and stop loss price at $95. This achieves dynamic tracking of the trends.
Advantage Analysis
This strategy has the following advantages:
- Dynamically tracking trend changes can smoothly catch longer-term directional moves.
- Using multiple filters reduces noise and avoids over-trading during choppy markets.
- Automatically adjusting stop loss and take profit levels achieves trend following.
- Parameters can be optimized through backtesting to find the best combination automatically.
Risk Analysis
There are also some risks with this strategy:
- Still cannot completely avoid being caught in trend reversals, which may lead to larger floating losses when trends reverse.
- Improper parameter settings may lead to poor strategy performance. Requires optimization to find the best parameters.
- Long data processing time may cause signal delays. Need to optimize indicator calculation to be as real-time as possible.
To control risks, one can set stop loss, use trailing stops or options to lock in profits. Also, extensive testing of parameter combinations is necessary to find reliable ranges. Finally, execution time of indicators should be monitored to ensure timely signals.
Optimization Directions
This strategy can be improved in the following aspects:
- Test combinations of more indicators to find more reliable ways of determining trends.
- Adjust parameter ranges to find optimal parameters.
- Optimize signal filters to find balance between noise reduction and lagging.
- Try machine learning approaches to automatically generate trading rules.
During optimization, backtesting and paper trading should be utilized extensively to evaluate signal quality and stability. Only well-validated optimizations should be applied in live trading.
Conclusion
Overall this is a decent trend following strategy. It uses multiple indicators to gauge trends, sets up filters to reduce false signals, and can automatically adjust stops and targets to follow trends. With proper parameter tuning, it can smoothly catch mid to long-term trends. Next steps would be finding optimal parameters, and continue validating and improving the strategy.
Parameters
| Name | Default | What it controls |
|---|---|---|
| v_input_1 | 0 | Strategy Direction: all | short | long |
| v_input_2 | 30 | length of channel |
| v_input_3 | 5 | upper percent |
| v_input_4 | 5 | lower percent |
| v_input_5 | 3 | Fast filter length |
| v_input_6 | 21 | Slow filter length |
| v_input_7 | 1D | HTF |
| v_input_8 | 0 | Timeframe: 1 | 5 | 15 | 30 | 60 | 120 | 240 | 360 | 720 | D | W |
| v_input_9 | 50 | Period |
| v_input_10 | true | Shift |
| v_input_11 | 25 | len |
| v_input_12 | 15 | Min |
| v_input_13 | 2 | Exit Profit % |
| v_input_14 | true | buy Loss Long |
| v_input_15 | 5 | rebuy % |
| v_input_16 | true | filter |
| v_input_17 | 100 | risk |
| v_input_18 | true | leverage |
| v_input_19 | 5 | stop loss |
| v_input_20 | 50 | qty_percent1 |
| v_input_21 | 50 | qty_percent2 |
| v_input_22 | true | Take profit1 |
| v_input_23 | 2 | Take profit2 |
Source Pine Script
/*backtest
start: 2023-12-03 00:00:00
end: 2023-12-06 00:00:00
period: 3m
basePeriod: 1m
exchanges: [{"eid":"Futures_Binance","currency":"BTC_USDT"}]
*/

// This source code is subject to the terms of the Mozilla Public License 2.0 at https://mozilla.org/MPL/2.0/
// © RafaelZioni

//@version=4
strategy(title = " BTC 15 min", overlay = true, pyramiding=1,initial_capital = 10000, default_qty_type= strategy.percent_of_equity, default_qty_value = 20, calc_on_order_fills=false, slippage=0,commission_type=strategy.commission.percent,commission_value=0.075)
strat_dir_input = input(title="Strategy Direction", defval="all", options=["long", "short", "all"])
strat_dir_value = strat_dir_input == "long" ? strategy.direction.long : strat_dir_input == "short" ? strategy.direction.short : strategy.direction.all
strategy.risk.allow_entry_in(strat_dir_value)
price = close
length8 = input(30,title = 'length of channel')
upmult = input(title = 'upper percent',type=input.float, step=0.1, defval=5)
lowmult = input(title = 'lower percent',type=input.float, step=0.1, defval=5)

basis = sma(close, length8)

vup = upmult * price / 100
vlow = lowmult * price / 100

upper = basis + vup
lower = basis - vlow
plot(basis, color=color.red)


//
fastLength = input(3, title="Fast filter length ", minval=1)
slowLength = input(21,title="Slow filter length",  minval=1)
source=close
v1=ema(source,fastLength)
v2=ema(source,slowLength)
//

leng=1
p1=close[1]

len55 = 10
//taken from https://www.tradingview.com/script/Ql1FjjfX-security-free-MTF-example-JD/
HTF = input("1D", type=input.resolution)
ti = change( time(HTF) ) != 0
T_c = fixnan( ti ? close : na )

vrsi = rsi(cum(change(T_c) * volume), leng)
pp=wma(vrsi,len55)

d=(vrsi[1]-pp[1])
len100 = 10
x=ema(d,len100)
//
zx=x/-1
col=zx > 0? color.lime : color.orange

//

tf10 = input("1", title = "Timeframe", type = input.resolution, options = ["1", "5", "15", "30", "60","120", "240","360","720", "D", "W"])

length = input(50, title = "Period", type = input.integer)
shift = input(1, title = "Shift", type = input.integer)

hma(_src, _length)=>
    wma((2 * wma(_src, _length / 2)) - wma(_src, _length), round(sqrt(_length)))

hma3(_src, _length)=>
    p = length/2
    wma(wma(close,p/3)*3 - wma(close,p/2) - wma(close,p),p)

b =security(syminfo.tickerid, tf10, hma3(close[1], length)[shift])
//plot(a,color=color.gray)
//plot(b,color=color.yellow)
close_price = close[0]
len = input(25)

linear_reg = linreg(close_price, len, 0)


buy=crossover(linear_reg, b)
sell=crossunder(linear_reg, b) or crossunder(close[1],upper)
//

src2=low
src3=high
Min =input(15)
leni = timeframe.isintraday and timeframe.multiplier >= 1 ?
   Min / timeframe.multiplier * 7 :
   timeframe.isintraday and timeframe.multiplier < 60 ?
   60 / timeframe.multiplier * 24 * 7 : 7

l1 = wma(src2,leni)
h1 = wma(src3,leni)
//
m=(h1+l1)/2
//
len5 = 100

src5=m

//
multi = 2

mean = ema(src5, len5)
stddev = multi * stdev(src5, len5)
b5 = mean + stddev
s5 = mean - stddev


var bool long = na
var bool short = na

long :=crossover(src5, s5)
short :=  crossunder(src5, b5)

var float last_open_long = na
var float last_open_short = na

last_open_long := long ? close : nz(last_open_long[1])
last_open_short := short ? close : nz(last_open_short[1])


entry_value =last_open_long
entry_value1=last_open_short

r=100
//
highb = highest(entry_value1, r)
lowb = lowest(entry_value, r)
d5 = highb - lowb
me = (highb + lowb) / 2
h4 = highb - d5 * 0.236
c3 = highb - d5 * 0.382
c4 = highb - d5 * 0.618
l4 = highb - d5 * 0.764
//
col2 = close >= me ? color.lime : color.red

p5 = plot(upper, color=col2)
p2 = plot(lower, color=col2)
fill(p5, p2,color=col2)
// Conditions

longCond = bool(na)
shortCond = bool(na)
longCond := crossover(zx,0) or buy
shortCond := sell

// Count your long short conditions for more control with Pyramiding

sectionLongs = 0
sectionLongs := nz(sectionLongs[1])
sectionShorts = 0
sectionShorts := nz(sectionShorts[1])

if longCond
    sectionLongs := sectionLongs + 1
    sectionShorts := 0
    sectionShorts

if shortCond
    sectionLongs := 0
    sectionShorts := sectionShorts + 1
    sectionShorts

// Pyramiding

pyrl = 1


// These check to see your signal and cross references it against the pyramiding settings above

longCondition = longCond and sectionLongs <= pyrl
shortCondition = shortCond and sectionShorts <= pyrl

// Get the price of the last opened long or short

last_open_longCondition = float(na)
last_open_shortCondition = float(na)
last_open_longCondition := longCondition ? open : nz(last_open_longCondition[1])
last_open_shortCondition := shortCondition ? open : nz(last_open_shortCondition[1])

// Check if your last postion was a long or a short

last_longCondition = float(na)
last_shortCondition = float(na)
last_longCondition := longCondition ? time : nz(last_longCondition[1])
last_shortCondition := shortCondition ? time : nz(last_shortCondition[1])

in_longCondition = last_longCondition > last_shortCondition
in_shortCondition = last_shortCondition > last_longCondition

// Take profit

isTPl = true
//isTPs = input(false, "Take Profit Short")
tp = input(2, "Exit Profit %", type=input.float)
long_tp = isTPl and crossover(high, (1 + tp / 100) * last_open_longCondition) and longCondition == 0 and in_longCondition == 1
//short_tp = isTPs and crossunder(low, (1 - tp / 100) * last_open_shortCondition) and
   //shortCondition == 0 and in_shortCondition == 1

// Stop Loss

isSLl = input(true,"buy Loss Long")
//isSLs = input(false, "buy Loss Short")
sl = 0.0
sl := input(5, " rebuy %", type=input.float)
long_sl = isSLl and crossunder(low, (1 - sl / 100) * last_open_longCondition) and
   longCondition == 0 and in_longCondition == 1
//short_sl = isSLs and crossover(high, (1 + sl / 100) * last_open_shortCondition) and
   //shortCondition == 0 and in_shortCondition == 1

//
// Conditions

longCond5 = bool(na)
shortCond5 = bool(na)
longCond5 := longCondition
shortCond5 := long_tp

//

sectionLongs5 = 0
sectionLongs5 := nz(sectionLongs5[1])
sectionShorts5 = 0
sectionShorts5 := nz(sectionShorts5[1])

if longCond5
    sectionLongs5 := sectionLongs5 + 1
    sectionShorts5 := 0
    sectionShorts5

if shortCond5
    sectionLongs5 := 0
    sectionShorts5 := sectionShorts5 + 1
    sectionShorts5

//

pyr5 = 1


longCondition5 = longCond5 and sectionLongs5 <= pyr5
shortCondition5 = shortCond5 and sectionShorts5 <= pyr5

// Get the price of the last opened long or short

last_open_longCondition5 = float(na)
last_open_shortCondition5 = float(na)
last_open_longCondition5 := longCondition5 ? open : nz(last_open_longCondition5[1])
last_open_shortCondition5 := shortCondition5 ? open : nz(last_open_shortCondition5[1])

last_longCondition5 = float(na)
last_shortCondition5 = float(na)
last_longCondition5 := longCondition5 ? time : nz(last_longCondition5[1])
last_shortCondition5 := shortCondition5 ? time : nz(last_shortCondition5[1])

in_longCondition5 = last_longCondition5 > last_shortCondition5
in_shortCondition5 = last_shortCondition5 > last_longCondition5
//
filter=input(true)
g(v, p) => round(v * (pow(10, p))) / pow(10, p)
risk     = input(100)
leverage = input(1)
c = g((strategy.equity * leverage / open) * (risk / 100), 4)

//
l =(v1 > v2 or filter == false ) and longCondition or long_sl
//
//l = longCondition or long_sl
s=shortCondition5
if l
    strategy.entry("buy", strategy.long,c)
if s
    strategy.entry("sell", strategy.short,c)


per(pcnt) =>
    strategy.position_size != 0 ? round(pcnt / 100 * strategy.position_avg_price / syminfo.mintick) : float(na)
stoploss=input(title=" stop loss", defval=5, minval=0.01)
los = per(stoploss)
q1=input(title=" qty_percent1", defval=50, minval=1)
q2=input(title=" qty_percent2", defval=50, minval=1)

tp10=input(title=" Take profit1", defval=1, minval=0.01)
tp20=input(title=" Take profit2", defval=2, minval=0.01)

strategy.exit("x1", qty_percent = q1, profit = per(tp10), loss = los)
strategy.exit("x2", qty_percent = q2, profit = per(tp20), loss = los)
Published by ChaoZhang on the FMZ strategy square · last modified 2023-12-11. Collected in the Quant Trading Vault. Unvalidated research: re-test with your own data and costs before trusting it.
Build this with AgenKit
A spec is not a trading system. Paste this into your coding agent and AgenKit runs a specialist team — architecture, test-first build, risk gates, review — with paper trading on by default.
/agenkit build a production-grade trading bot with a backtest engine, risk controls and paper trading by default from strategies/Dynamic-Trend-Following-Strategy-434996.md- npx agenkit install engineering-kit in your project
- Paste the command into your agent and approve each phase
- Get tests, backtest, risk controls and a paper-trading switch
Understand it first
Before you run this, read the lesson behind the idea and how to backtest it honestly. Specs like this one are the survivors of an unknown number of trials; deflate their results accordingly.
Related specs
- Bollinger Bands and RSI Trend Following StrategyPine Script · Trend following · 1h
- Dual ATR Channel Trend Following StrategyPine Script · Trend following · 15m
- Dual Mode Adaptive Trend Trading Strategy EMA Crossover with ATR Volatility Based Risk Management SystemPine Script · Trend following · 1d
- Dynamic Dual EMA Crossover Strategy with Adaptive Profit Loss ControlPine Script · Trend following · 1d
- Dynamic Signal Line Trend Following and Volatility Filtering StrategyPine Script · Trend following · 1h
- EMA AROON ASHPine Script · Trend following · 3m