Dynamic Volume Weighted Moving Average Trend Following with HLCC4 Breakout Trading Strategy
This strategy is a multi-timeframe trend following system that combines a 50-period Weekly Volume-Weighted Moving Average (VWMA) as a major trend filter, using the 200-period VWMA and HLCC4 price breakout on the…
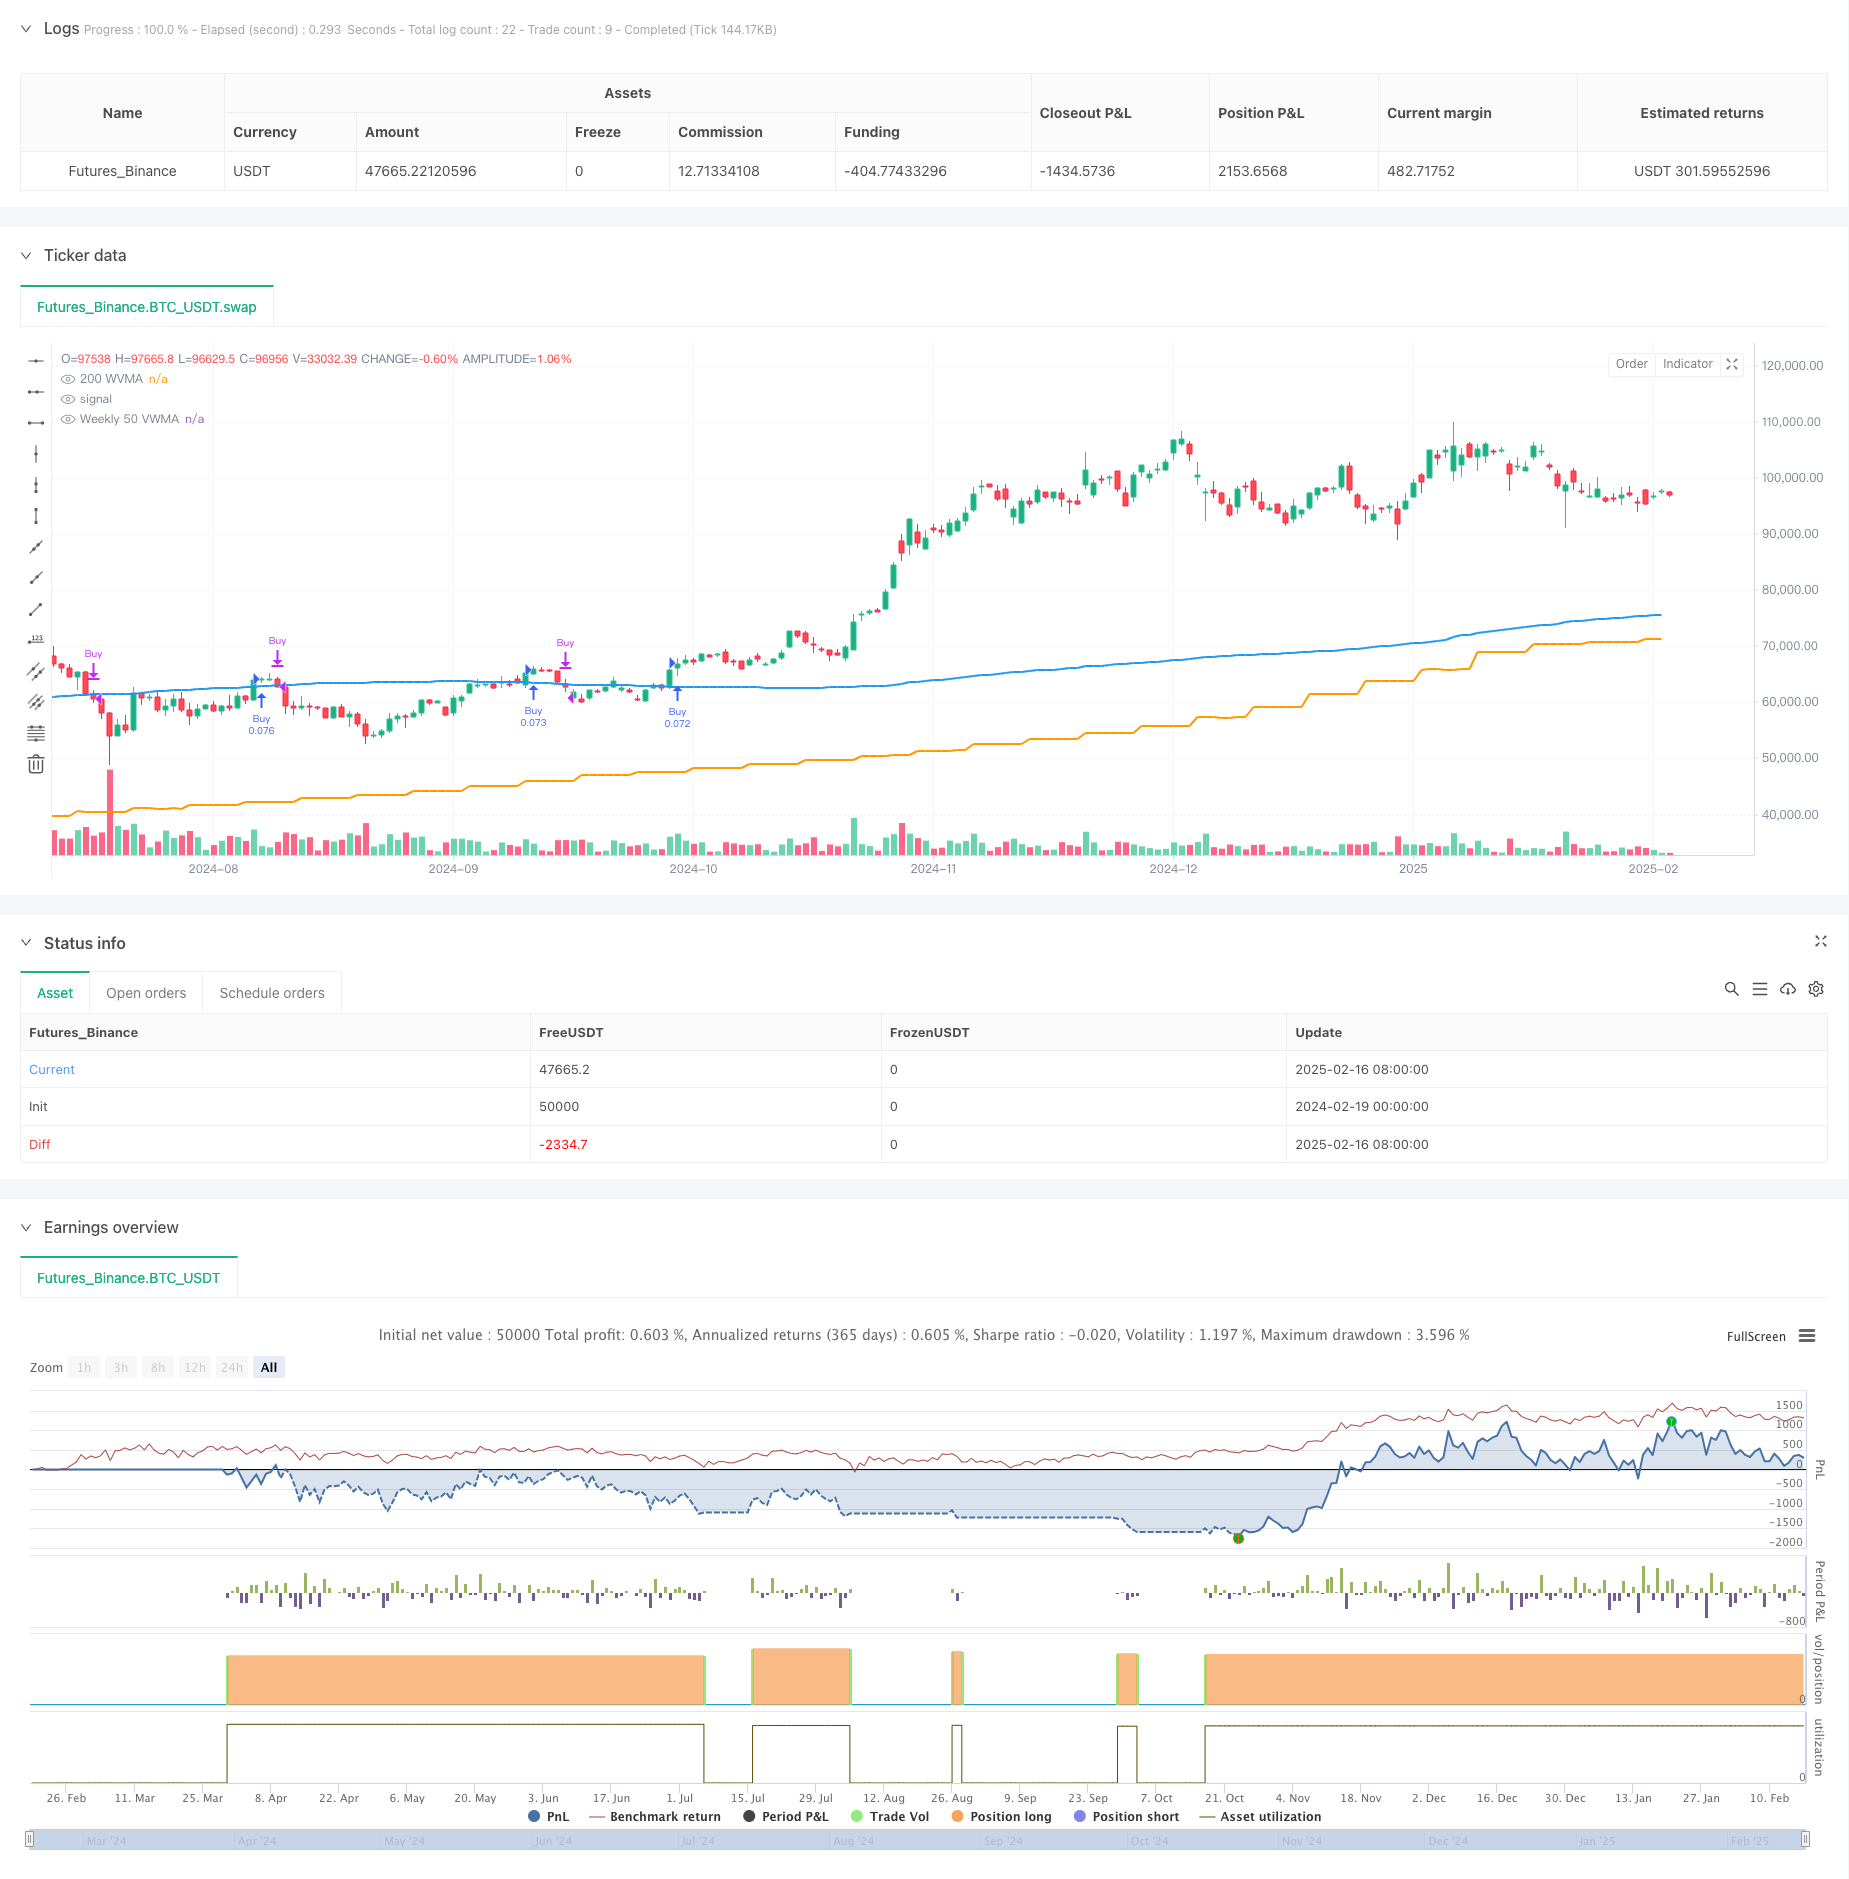
Overview
This strategy is a multi-timeframe trend following system that combines a 50-period Weekly Volume-Weighted Moving Average (VWMA) as a major trend filter, using the 200-period VWMA and HLCC4 price breakout on the current timeframe for specific trading signals. It is a long-only strategy that enhances trading reliability through strict trend confirmation and multi-timeframe validation.
Strategy Principles
The core logic includes several key components:
- Uses the 50-period Weekly VWMA as a major trend criterion, allowing positions only when price is above this moving average.
- Entry conditions require two consecutive closing prices above the 200-period VWMA, with the second candle's close higher than the first candle's HLCC4 average.
- Exit signals are based on the daily timeframe, closing positions when the daily close falls below the daily 200-period VWMA.
- The strategy employs fixed position sizing, using 10% of account equity per trade.
- Backtesting is restricted to the last 5 years to ensure strategy effectiveness in recent market conditions.
Strategy Advantages
- Multi-timeframe validation: Combines weekly and daily timeframes to capture major trends while responding to market changes timely.
- Robust risk control: Uses VWMA instead of simple moving averages for better reflection of true market trends.
- Rigorous trend confirmation: Requires multiple conditions to be met for entry, reducing false breakout risks.
- Rational position management: Fixed proportion position sizing controls risk while maintaining profit potential.
- High automation level: Clear strategy logic enables full automation implementation.
Strategy Risks
- Trend reversal risk: Significant drawdowns may occur during violent market fluctuations.
- Slippage impact: Actual trading prices may deviate from theoretical prices during low liquidity periods.
- Signal lag: Using longer-period moving averages may result in delayed reactions at trend turning points.
- False breakout risk: Despite multiple confirmations, losses from false breakouts are still possible.
- Unidirectional trading limitation: Being long-only, the strategy misses potential short opportunities in downtrends.
Strategy Optimization Directions
- Dynamic parameter optimization: Automatically adjust VWMA periods based on market volatility.
- Position management enhancement: Introduce volatility-based dynamic position sizing system.
- Exit mechanism improvement: Add trailing stops or technical indicator-based dynamic stop losses.
- Market sentiment integration: Incorporate RSI or MACD indicators to improve signal reliability.
- Volume analysis enhancement: Deepen volume analysis and optimize VWMA calculation methods.
Summary
This is a rigorously designed trend following strategy that achieves effective risk control through multi-timeframe coordination and strict trading conditions. Its core advantages lie in its comprehensive trend confirmation mechanism and clear trading logic, suitable for capturing medium to long-term trending opportunities in strong markets. Through the suggested optimization directions, the strategy has room for further improvement.
Source Pine Script
/*backtest
start: 2024-02-19 00:00:00
end: 2025-02-17 00:00:00
period: 1d
basePeriod: 1d
exchanges: [{"eid":"Futures_Binance","currency":"BTC_USDT"}]
*/

//@version=6
strategy("Long-Only 200 WVMA + HLCC4 Strategy (Weekly 50 VWMA Filter, Daily Exit, Last 5 Years)", overlay=true, default_qty_type=strategy.percent_of_equity, default_qty_value=10)

// Parameters
wvma_length = input(200, title="200 WVMA Length")

// Restrict backtesting to the last 5 years
var int backtest_start_year = na
if na(backtest_start_year)
    backtest_start_year = year - 5  // Calculate the start year (5 years ago)

// Check if the current time is within the last 5 years
within_backtest_period = true

// Fetch Weekly 50 VWMA
weekly_vwma_50 = request.security(syminfo.tickerid, "W", ta.vwma(close, 50))

// Basic Condition: Price must be above Weekly 50 VWMA
above_weekly_vwma = (close > weekly_vwma_50)

// 200 Weighted Volume Moving Average (WVMA) on the current timeframe
wvma = ta.vwma(close, wvma_length)
plot(wvma, title="200 WVMA", color=color.blue, linewidth=2)

// HLCC4 Calculation
hlcc4 = (high + low + close + close) / 4

// Fetch Daily 200 WVMA
daily_wvma = request.security(syminfo.tickerid, "D", ta.vwma(close, wvma_length))

// Fetch Daily Close
daily_close = request.security(syminfo.tickerid, "D", close)

// Long Entry Condition
long_condition = (close[1] > wvma[1]) and (close > wvma) and (close > hlcc4[1])

// Long Exit Condition (Daily Close below Daily 200 WVMA)
exit_condition = (daily_close < daily_wvma)

// Check if there is an open position
var bool in_position = false

// Execute trades only within the last 5 years and above Weekly 50 VWMA
if within_backtest_period and above_weekly_vwma
    if (long_condition and not in_position)
        strategy.entry("Buy", strategy.long)
        in_position := true

    if (exit_condition and in_position)
        strategy.close("Buy")
        in_position := false

// Plotting Entry and Exit Signals
plotshape(series=long_condition and not in_position and within_backtest_period and above_weekly_vwma, style=shape.labelup, location=location.belowbar, color=color.green, text="Buy", size=size.small)
plotshape(series=exit_condition and in_position and within_backtest_period and above_weekly_vwma, style=shape.labeldown, location=location.abovebar, color=color.red, text="Exit", size=size.small)

// Highlight background for trend direction
bgcolor(long_condition and not in_position and within_backtest_period and above_weekly_vwma ? color.new(color.green, 90) : na, title="Uptrend Background")
bgcolor(exit_condition and in_position and within_backtest_period and above_weekly_vwma ? color.new(color.red, 90) : na, title="Exit Background")

// Plot Weekly 50 VWMA
plot(weekly_vwma_50, title="Weekly 50 VWMA", color=color.orange, linewidth=2)Published by ChaoZhang on the FMZ strategy square · last modified 2025-02-18. Collected in the Quant Trading Vault. Unvalidated research: re-test with your own data and costs before trusting it.
Build this with AgenKit
A spec is not a trading system. Paste this into your coding agent and AgenKit runs a specialist team — architecture, test-first build, risk gates, review — with paper trading on by default.
/agenkit build a production-grade trading bot with a backtest engine, risk controls and paper trading by default from strategies/Dynamic-Volume-Weighted-Moving-Average-Trend-Following-with-HLCC4-Breakout-Trading-Strategy.md- npx agenkit install engineering-kit in your project
- Paste the command into your agent and approve each phase
- Get tests, backtest, risk controls and a paper-trading switch
Understand it first
Before you run this, read the lesson behind the idea and how to backtest it honestly. Specs like this one are the survivors of an unknown number of trials; deflate their results accordingly.
Related specs
- Bollinger Bands Dynamic Breakout StrategyPine Script · Breakout · 1h
- Bull Market Tracking SystemPine Script · Breakout · 1h
- Cross boundary Dynamic Range Quantitative Trading Strategy Based on Bollinger BandsPine Script · Breakout · 3h
- Momentum Breakout Moving Average StrategyPine Script · Breakout · 1d
- Momentum Breakout Trading Strategy 440964Pine Script · Breakout · 5m
- Moving Average Crossover and Upper Rail Breakthrough Impulse StrategyPine Script · Breakout · 1m