Strategy vault / Trend following
EMA and MACD Based BTC Trading Strategy
This strategy is a composite strategy based on EMA difference and MACD indicator for short-term BTC trading. It combines the signals from EMA and MACD to generate buy and sell signals under certain conditions.
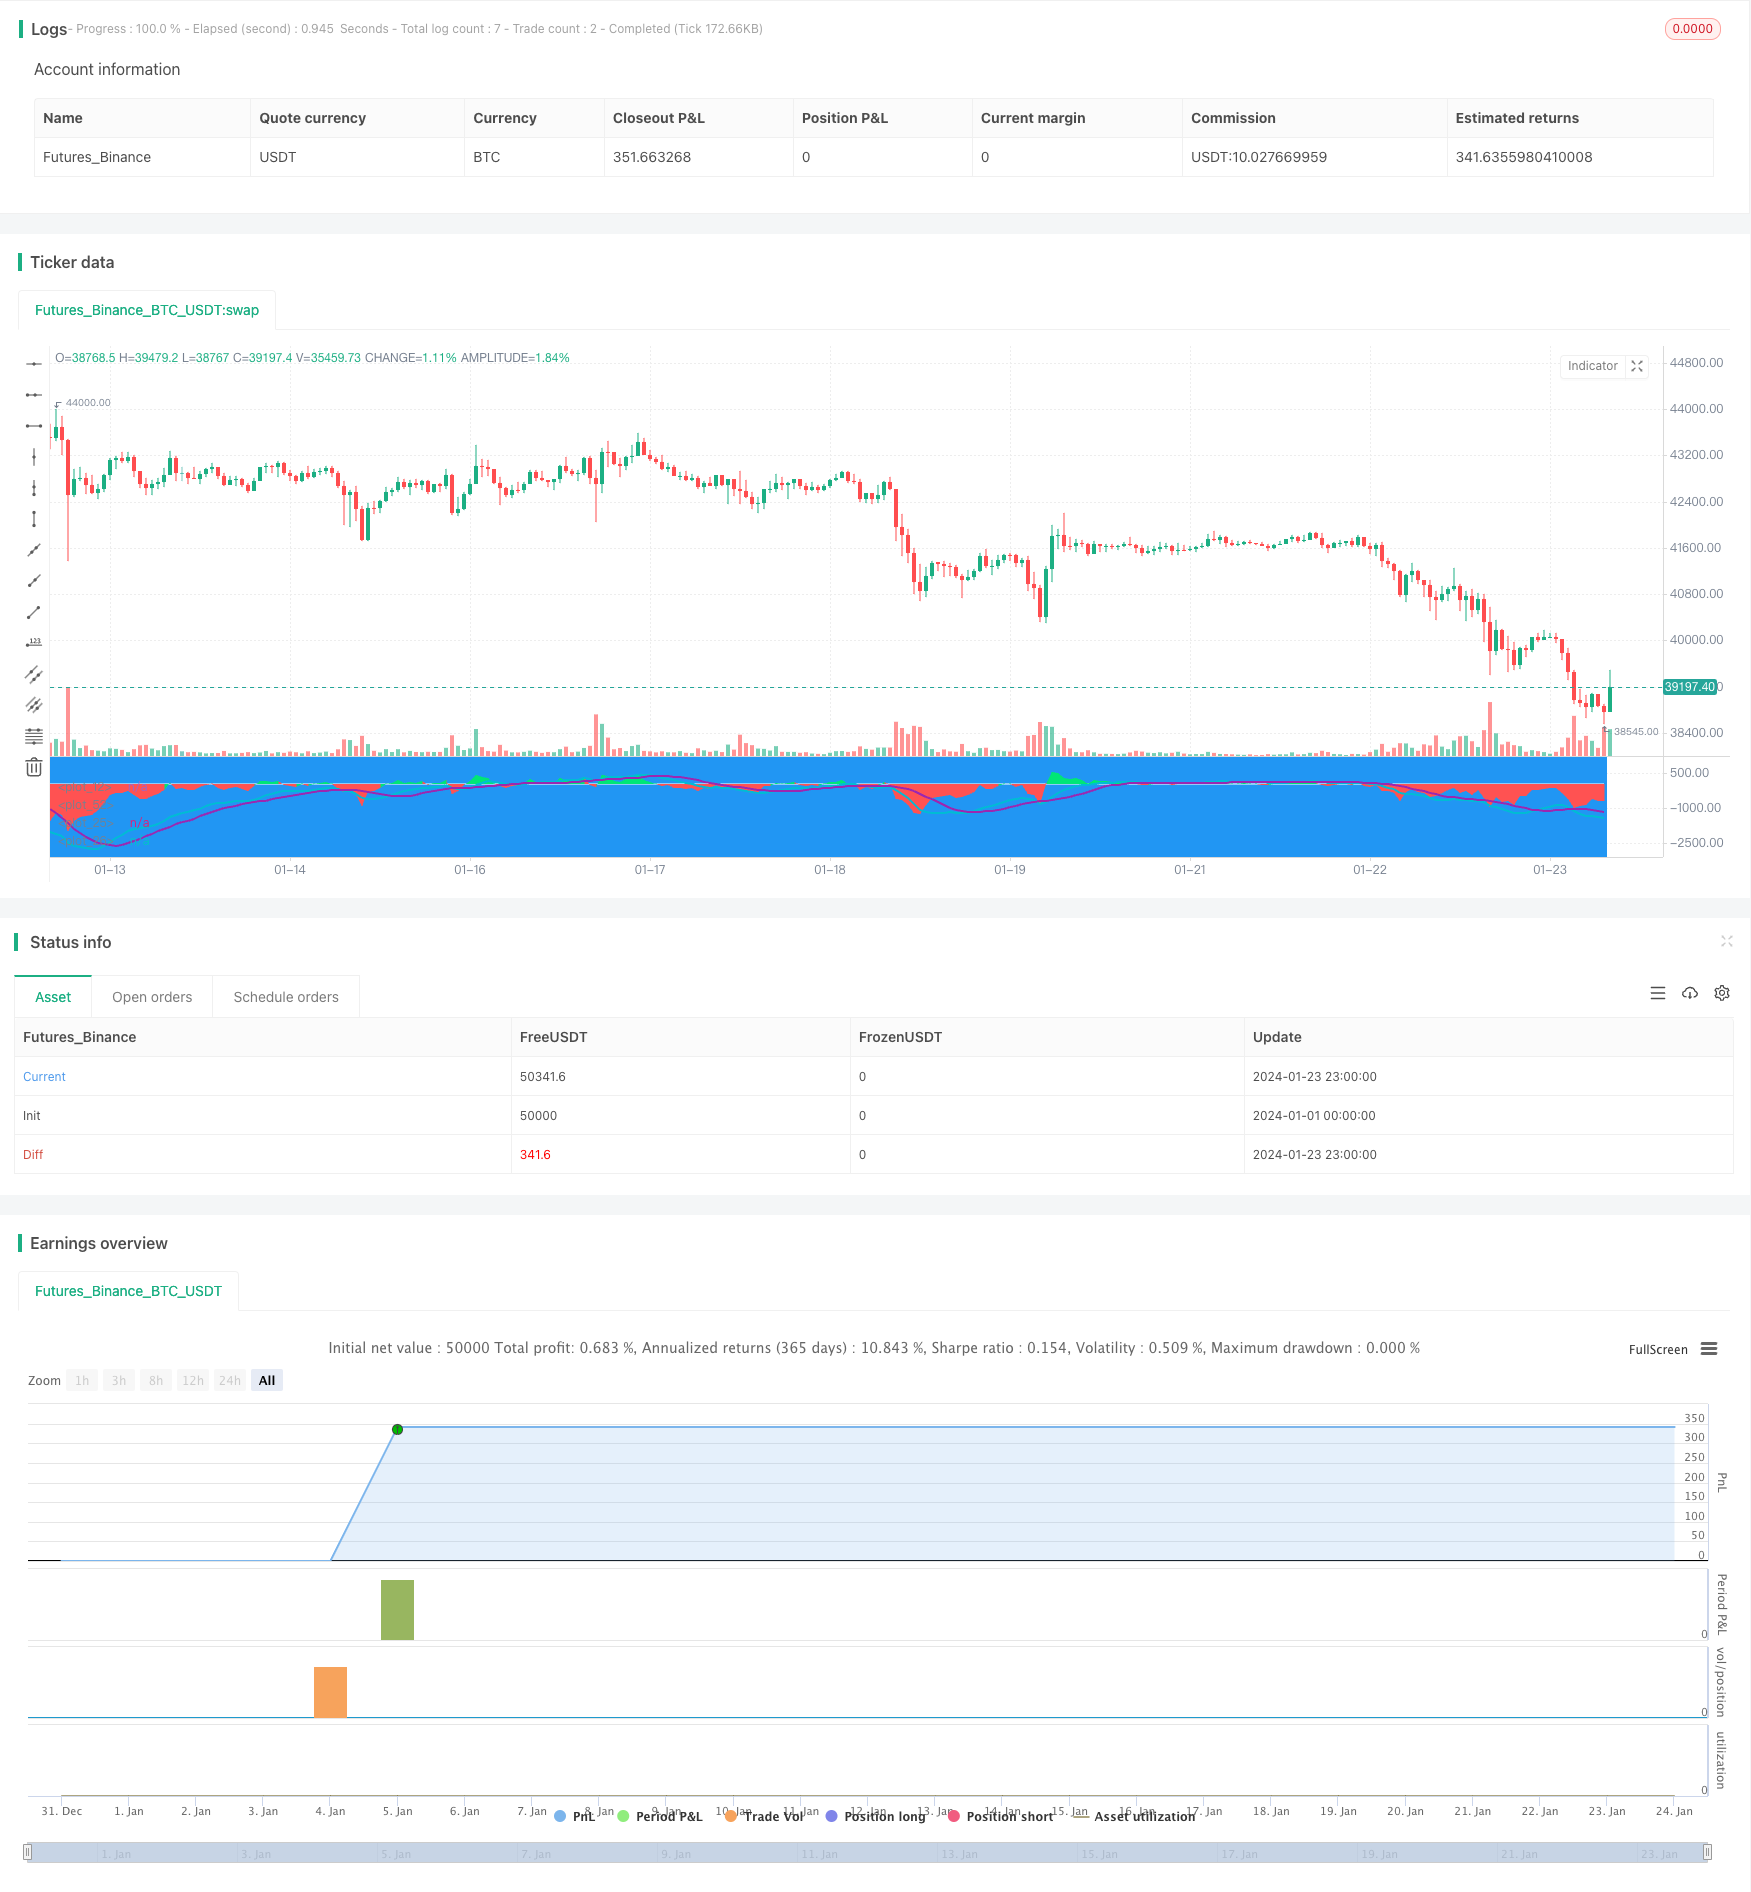
Overview
This strategy is a composite strategy based on EMA difference and MACD indicator for short-term BTC trading. It combines the signals from EMA and MACD to generate buy and sell signals under certain conditions.
Strategy Logic
It generates buy signals when the difference is negative and below a threshold and MACD has a bearish crossover. It generates sell signals when the difference is positive and above a threshold and MACD has a bullish crossover.
By combining the signals from both EMA difference and MACD, some fake signals can be filtered out and the reliability of signals is improved.
Advantage Analysis
- Uses composite indicators, more reliable signals
- Adopts short-term parameters, suitable for short-term trading
- Has stop loss and take profit settings to control risks
Risk Analysis
- Stop loss may be broken during huge market swings
- Parameters need to be optimized for different market environments
- Effects need to be tested on different coins and exchanges
Optimization Directions
- Optimize EMA and MACD parameters to fit BTC volatility
- Add position sizing and pyramiding strategies to improve capital efficiency
- Add stop loss methods like trailing stop loss to reduce risks
- Test effects on different exchanges and coins
Conclusion
This strategy integrates the strengths of both EMA and MACD indicators and uses composite signals to effectively filter out false signals. With optimized parameters and position strategies, stable returns can be achieved. But risks like stop loss being hit need attention and further testing and improvement is required.
Parameters
| Name | Default | What it controls |
|---|---|---|
| v_input_1 | 18 | EMA |
| v_input_2 | 12 | MACDfast |
| v_input_3 | 26 | MACDslow |
| v_input_4 | 8 | EMADiffThreshold |
| v_input_5 | 80 | MACDThreshold |
| v_input_6 | 65 | TargetValidityThreshold |
| v_input_7 | 120 | Target |
| v_input_8 | 650 | StopLoss |
Source Pine Script
/*backtest
start: 2024-01-01 00:00:00
end: 2024-01-24 00:00:00
period: 1h
basePeriod: 15m
exchanges: [{"eid":"Futures_Binance","currency":"BTC_USDT"}]
*/

//@version=3
strategy("EMA50Diff & MACD Strategy", overlay=false)
EMA = input(18, step=1)
MACDfast = input(12)
MACDslow = input(26)
EMADiffThreshold = input(8)
MACDThreshold = input(80)
TargetValidityThreshold = input(65, step=5)
Target = input(120, step=5)
StopLoss = input(650, step=5)
ema = ema(close, EMA)
hl = plot(0, color=white, linewidth=1)
diff = close - ema
clr = color(blue, transp=100)
if diff>0
    clr := lime
else
    if diff<0
        clr := red

fastMA = ema(close, MACDfast)
slowMA = ema(close, MACDslow)
macd = (fastMA - slowMA)*3
signal = sma(macd, 9)
plot(macd, color=aqua, linewidth=2)
plot(signal, color=purple, linewidth=2)

macdlong = macd<-MACDThreshold and signal<-MACDThreshold and crossover(macd, signal)
macdshort = macd>MACDThreshold and signal>MACDThreshold and crossunder(macd, signal)
position = 0.0
position := nz(strategy.position_size, 0.0)
long = (position < 0 and close < strategy.position_avg_price - TargetValidityThreshold and macdlong) or
     (position == 0.0 and diff < -EMADiffThreshold and diff > diff[1] and diff[1] < diff[2] and macdlong)

short = (position > 0 and close > strategy.position_avg_price + TargetValidityThreshold and macdshort) or
      (position == 0.0 and diff > EMADiffThreshold and diff < diff[1] and diff[1] > diff[2] and macdshort)
amount = (strategy.equity / close) //- ((strategy.equity / close / 10)%10)
bgclr = color(blue, transp=100) //#0c0c0c
if long
    strategy.entry("long", strategy.long, amount)
    bgclr := green
if short
    strategy.entry("short", strategy.short, amount)
    bgclr := maroon
bgcolor(bgclr, transp=20)
strategy.close("long", when=close>strategy.position_avg_price + Target)
strategy.close("short", when=close<strategy.position_avg_price - Target)
strategy.exit("STOPLOSS", "long", stop=strategy.position_avg_price - StopLoss)
strategy.exit("STOPLOSS", "short", stop=strategy.position_avg_price + StopLoss)
//plotshape(long, style=shape.labelup, location=location.bottom, color=green)
//plotshape(short, style=shape.labeldown, location=location.top, color=red)
pl = plot(diff, style=histogram, color=clr)
fill(hl, pl, color=clr)
Published by ChaoZhang on the FMZ strategy square · last modified 2024-01-25. Collected in the Quant Trading Vault. Unvalidated research: re-test with your own data and costs before trusting it.
Build this with AgenKit
A spec is not a trading system. Paste this into your coding agent and AgenKit runs a specialist team — architecture, test-first build, risk gates, review — with paper trading on by default.
/agenkit build a production-grade trading bot with a backtest engine, risk controls and paper trading by default from strategies/EMA-and-MACD-Based-BTC-Trading-Strategy.md- npx agenkit install engineering-kit in your project
- Paste the command into your agent and approve each phase
- Get tests, backtest, risk controls and a paper-trading switch
Understand it first
Before you run this, read the lesson behind the idea and how to backtest it honestly. Specs like this one are the survivors of an unknown number of trials; deflate their results accordingly.
Related specs
- Bollinger Bands and RSI Trend Following StrategyPine Script · Trend following · 1h
- Dual ATR Channel Trend Following StrategyPine Script · Trend following · 15m
- Dual MA Crossover Trend Tracking StrategyPine Script · Trend following · 1h
- Dynamic Dual EMA Crossover Strategy with Adaptive Profit Loss ControlPine Script · Trend following · 1d
- EMA SMA Multi Indicator Comprehensive Trend Following StrategyPine Script · Trend following · 1h
- EMA and RSI Trend Trading StrategyPine Script · Trend following · 1d