Strategy vault / Trend following
EMA MA Crossover Options Trading Strategy
This is a short-term option trading strategy based on exponential moving average (EMA) and moving average (MA) crossovers to generate trading signals. It produces buy signals when the fast EMA crosses over the slow…
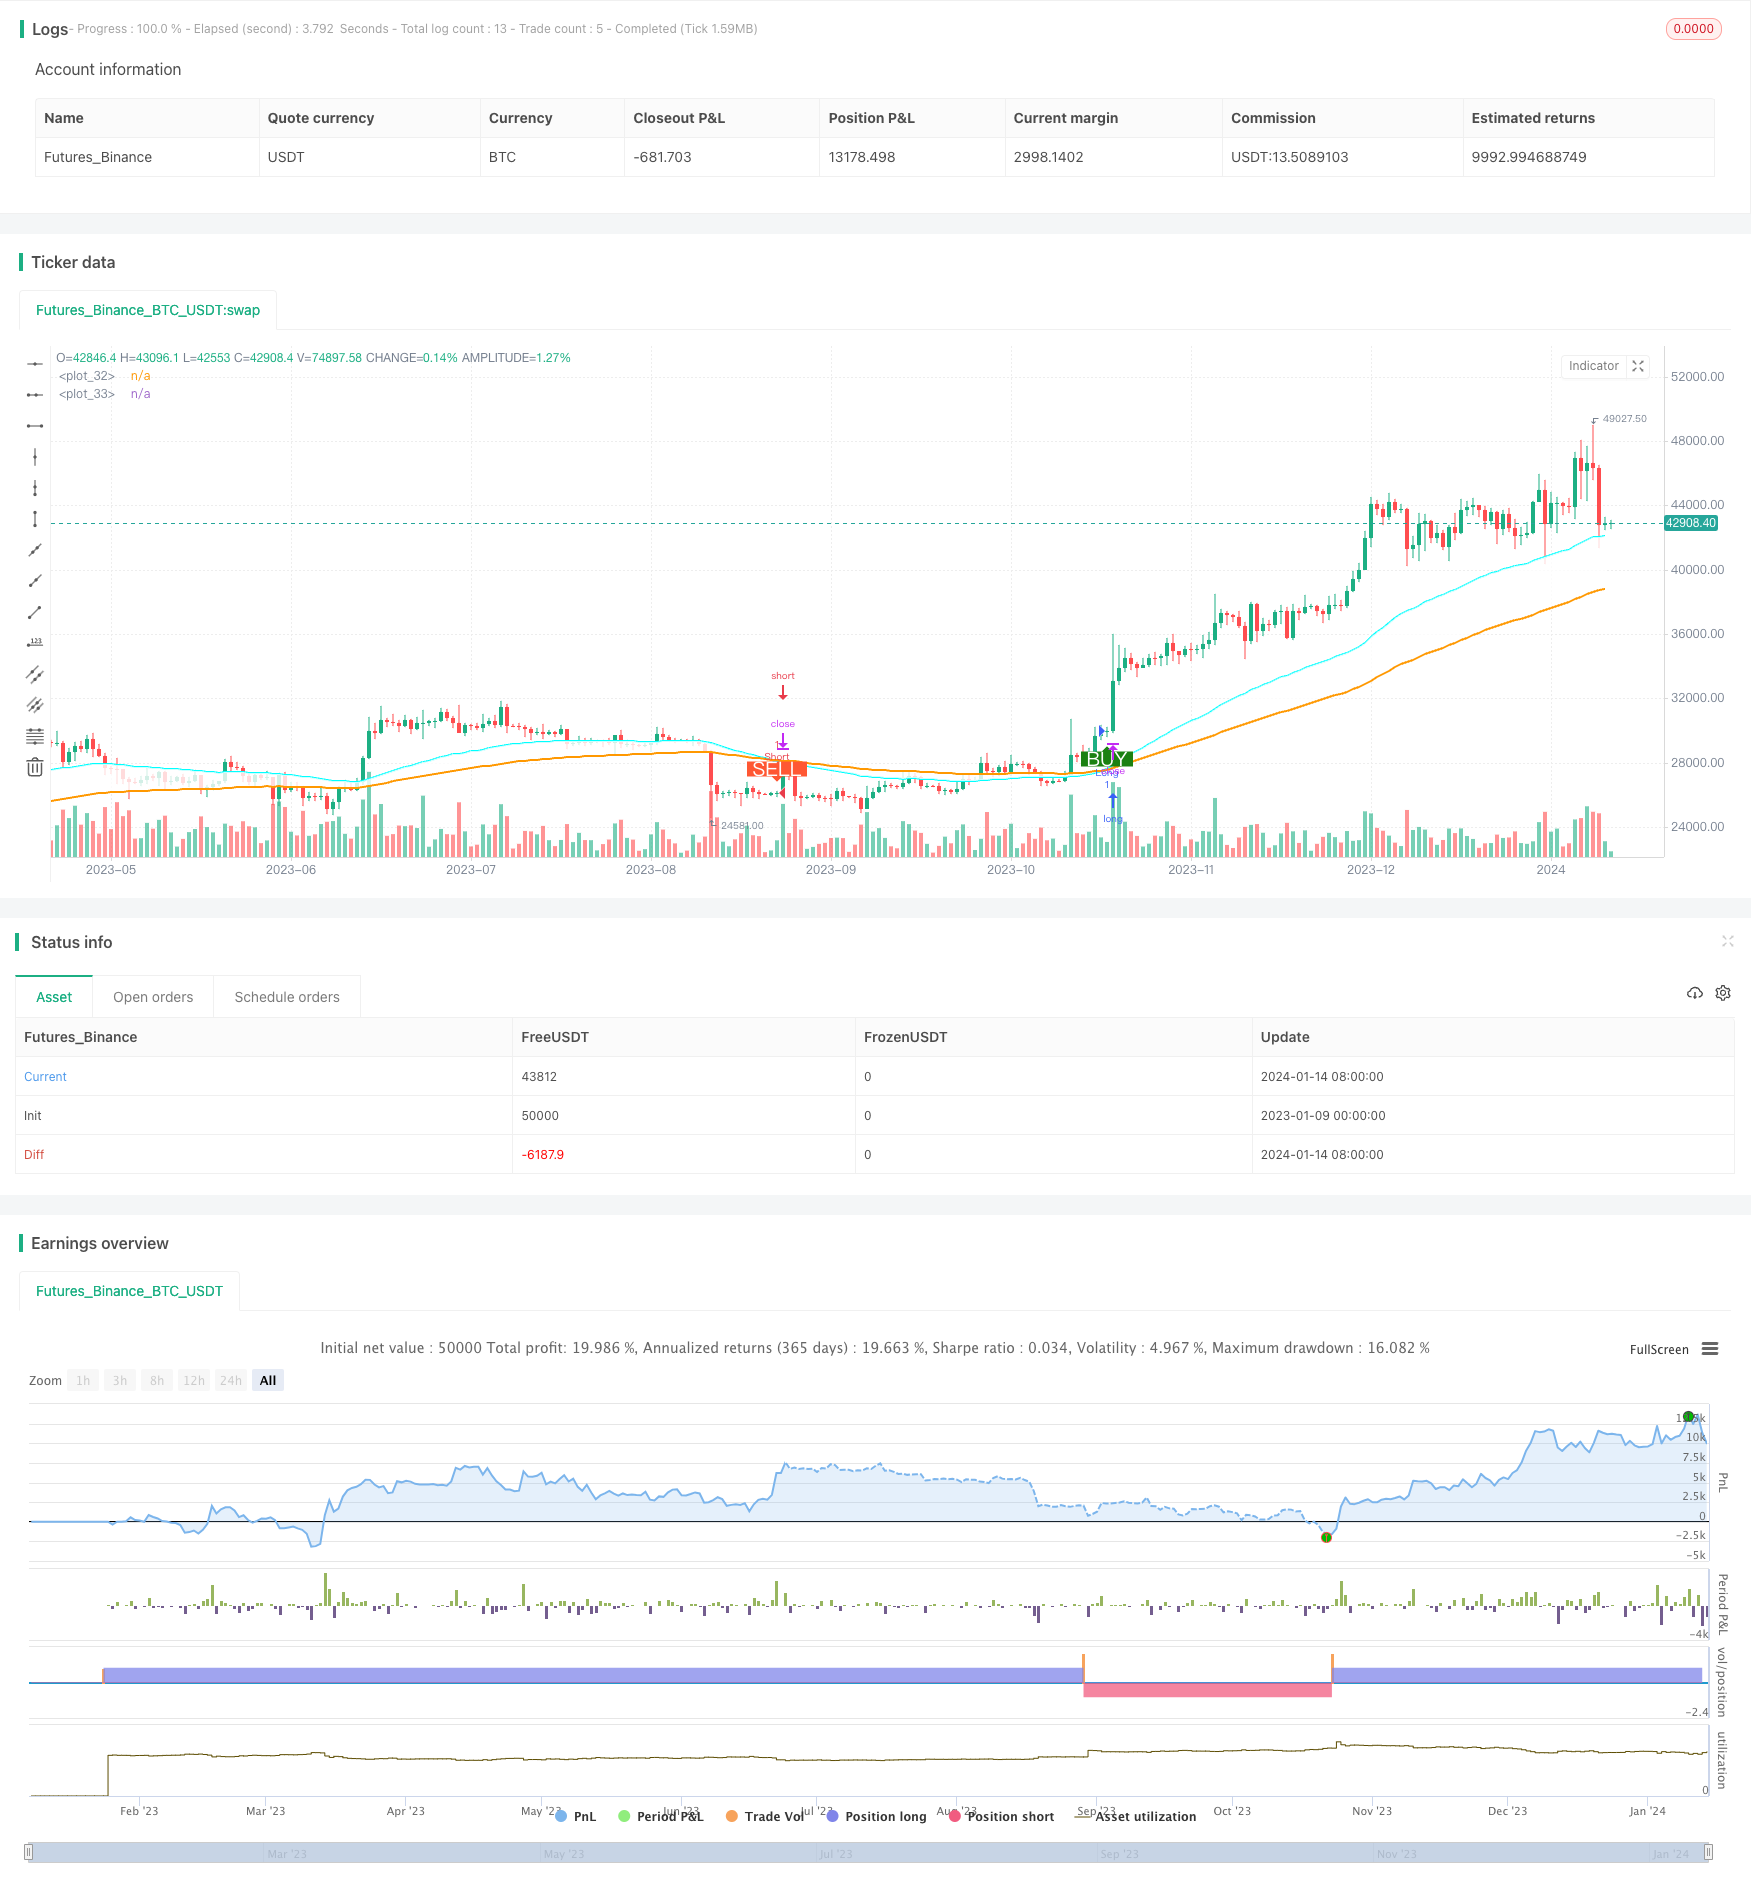
Overview
This is a short-term option trading strategy based on exponential moving average (EMA) and moving average (MA) crossovers to generate trading signals. It produces buy signals when the fast EMA crosses over the slow MA from below, and sell signals when the fast EMA crosses below the slow MA.
Strategy Logic
The strategy employs two EMAs/MAs with different parameters, one fast EMA and one slow MA. The fast EMA period is set to 50 and the slow MA period is set to 100. The EMA responds faster to price changes while the MA reacts more slowly.
When short-term price surge accelerates, the fast EMA will penetrate the slow MA from below, generating buy signals. This indicates increasing bullish sentiment, making it suitable to consider buying or buying call options.
When short-term price decline accelerates, the fast EMA will break below the slow MA, producing sell signals. This shows increasing bearish sentiment, indicating opportunities to sell or buy put options.
By capturing crossovers between fast and slow EMA/MA to determine short-term trend and market emotions, timely option trades can be executed to profit from relatively short-term price fluctuations.
Advantage Analysis
The main advantages of this strategy are:
Fast response to capture short-term swings. Crossovers between fast EMA and slow MA quickly detect short-term up and down price reversals.
Simple to implement. Only need to monitor crossover of the two moving averages without complex calculation.
Flexible application for trading options or stocks. Can go long/short based on signals, or trade options accordingly.
Controllable risk with clear stop loss. Preset stop loss points to limit loss per trade.
Risk Analysis
Some risks to note:
Potential whipsaw signals and ranging markets may cause excessive trading and increased costs. Can widen stop loss to avoid over-trading.
Vulnerable in sustained market downtrends with consecutive stop loss triggers. Consider pausing strategy during protracted bear phase for capital preservation.
Price spikes from significant news events may stop out positions prematurely or substantially magnify losses. Carefully assess appropriateness of employing strategy around major events.
Enhancement Opportunities
Some ways to enhance the strategy:
Dynamic stop loss based on volatility. Adjust stop loss in real-time according to price fluctuation levels to minimize forced exit probabilities.
Integrate multiple timeframe EMAs. Add daily and weekly EMAs to gauge overall trend to avoid counter-trend trades.
RSI filter. Utilize RSI to identify overbought and oversold levels to filter out some noise signals.
Machine learning volatility prediction. Employ LSTM models to predict price volatility and risk, dynamically adjusting position sizing and stop loss.
Conclusion
This short-term EMA/MA crossover strategy captures short-term trend changes and market emotions for timely trades by monitoring fast EMA and slow MA crossovers. Despite its ease of implementation, risks include excessive whipsaws and sustained drawdowns. Enhancements around stop loss optimization, multiple timeframes, signal filtering, and machine learning prediction can aid risk control and profitability improvements.
Parameters
| Name | Default | What it controls |
|---|---|---|
| v_input_1 | 100000 | Buy quantity |
| v_input_2 | 2019 | Backtest Start Year |
| v_input_3 | true | Backtest Start Month |
| v_input_4 | true | Backtest Start Day |
| v_input_5 | false | Backtest Start Hour |
| v_input_6 | false | Backtest Start Minute |
| v_input_7 | 2099 | Backtest Stop Year |
| v_input_8 | true | Backtest Stop Month |
| v_input_9 | 30 | Backtest Stop Day |
| v_input_10 | true | Color Background? |
| v_input_11 | 50 | Select EMA 1 |
| v_input_12 | 100 | Select EMA 2 |
Source Pine Script
/*backtest
start: 2023-01-09 00:00:00
end: 2024-01-15 00:00:00
period: 1d
basePeriod: 1h
exchanges: [{"eid":"Futures_Binance","currency":"BTC_USDT"}]
*/

//@version=4
strategy("Backtest single EMA cross", overlay=true)

qty = input(100000, "Buy quantity")

testStartYear = input(2019, "Backtest Start Year")
testStartMonth = input(1, "Backtest Start Month")
testStartDay = input(1, "Backtest Start Day")
testStartHour = input(0, "Backtest Start Hour")
testStartMin = input(0, "Backtest Start Minute")
testPeriodStart = timestamp(testStartYear, testStartMonth, testStartDay, testStartHour, testStartMin)
testStopYear = input(2099, "Backtest Stop Year")
testStopMonth = input(1, "Backtest Stop Month")
testStopDay = input(30, "Backtest Stop Day")
testPeriodStop = timestamp(testStopYear, testStopMonth, testStopDay, 0, 0)
testPeriodBackground = input(title="Color Background?", type=input.bool, defval=true)
testPeriodBackgroundColor = testPeriodBackground and time >= testPeriodStart and time <= testPeriodStop ?
   #00FF00 : na
testPeriod() => true


ema1 = input(50, title="Select EMA 1")
ema2 = input(100, title="Select EMA 2")

expo = ema(close, ema1)
ma = ema(close, ema2)

avg_1 = avg(expo, ma)
s2 = cross(expo, ma) ? avg_1 : na
//plot(s2, style=plot.style_line, linewidth=3, color=color.red, transp=0)

p1 = plot(expo, color=#00FFFF, linewidth=2, transp=0)
p2 = plot(ma, color=color.orange, linewidth=2, transp=0)
fill(p1, p2, color=color.white, transp=80)


longCondition = crossover(expo, ma)

shortCondition = crossunder(expo, ma)

exitlongCondition = crossunder(expo, ma)

exitshortCondition = crossover(expo, ma)


if testPeriod()
    strategy.entry("Long", strategy.long, when=longCondition)
    strategy.entry("Short", strategy.short, when=shortCondition)

plotshape(longCondition, title = "Buy Signal", text ="BUY", textcolor = #FFFFFF , style=shape.labelup, size = size.normal, location=location.belowbar, color = #1B8112, transp = 0)
plotshape(shortCondition, title = "Sell Signal", text ="SELL", textcolor = #FFFFFF, style=shape.labeldown, size = size.normal, location=location.abovebar, color = #FF5733, transp = 0)
Published by ChaoZhang on the FMZ strategy square · last modified 2024-01-16. Collected in the Quant Trading Vault. Unvalidated research: re-test with your own data and costs before trusting it.
Build this with AgenKit
A spec is not a trading system. Paste this into your coding agent and AgenKit runs a specialist team — architecture, test-first build, risk gates, review — with paper trading on by default.
/agenkit build a production-grade trading bot with a backtest engine, risk controls and paper trading by default from strategies/EMA-MA-Crossover-Options-Trading-Strategy.md- npx agenkit install engineering-kit in your project
- Paste the command into your agent and approve each phase
- Get tests, backtest, risk controls and a paper-trading switch
Understand it first
Before you run this, read the lesson behind the idea and how to backtest it honestly. Specs like this one are the survivors of an unknown number of trials; deflate their results accordingly.
Related specs
- Adaptive ATR and RSI Trend Following Strategy with Trailing Stop LossPine Script · Trend following · 1h
- Advanced Multi Indicator Multi Dimensional Trend Cross Quantitative StrategyPine Script · Trend following · 3h
- Bollinger Bands and RSI Trend Following StrategyPine Script · Trend following · 1h
- Dual ATR Channel Trend Following StrategyPine Script · Trend following · 15m
- Dual EMA Crossover with RSI Trend Confirmation StrategyPine Script · Trend following · 3h
- Dual Mode Adaptive Trend Trading Strategy EMA Crossover with ATR Volatility Based Risk Management SystemPine Script · Trend following · 1d