Fisher Yurik Trailing Stop Strategy
The Fisher Yurik trailing stop strategy is a quantitative trading strategy that integrates the Fisher Yurik indicator and trailing stop mechanisms. It uses the Fisher Yurik indicator to generate buy and sell signals…
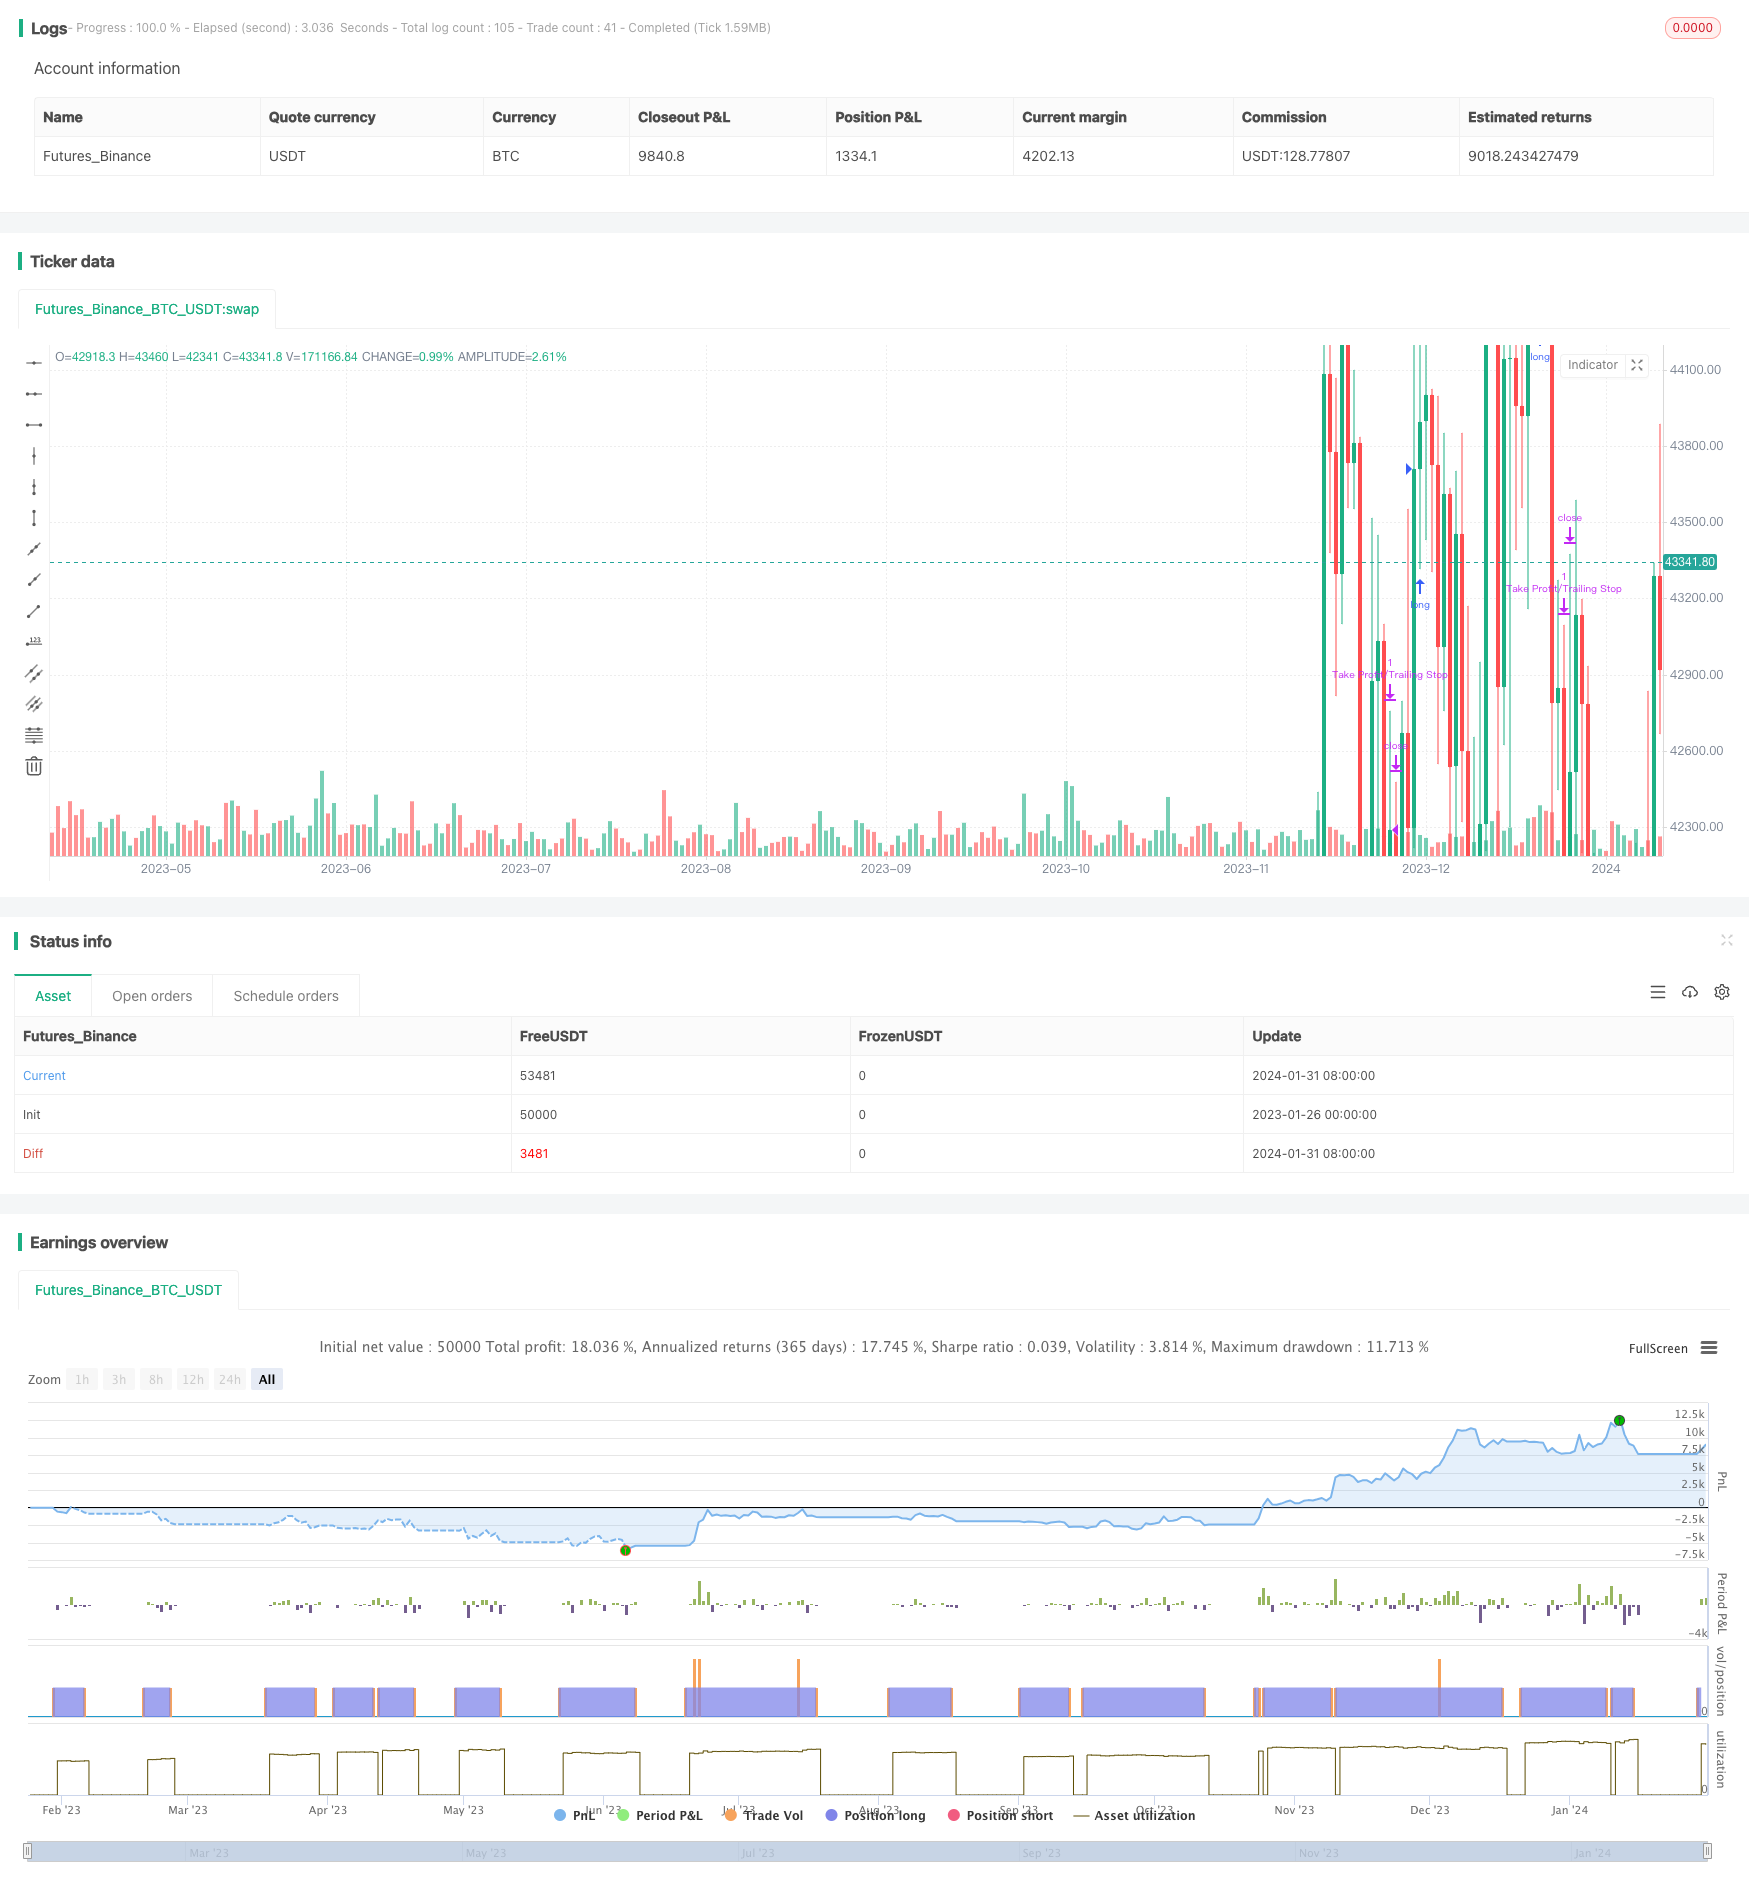
Overview
The Fisher Yurik trailing stop strategy is a quantitative trading strategy that integrates the Fisher Yurik indicator and trailing stop mechanisms. It uses the Fisher Yurik indicator to generate buy and sell signals while setting trailing stops to lock in profits, maximizing gains while protecting profits.
Strategy Logic
- Input date ranges to define backtest/live trading timeframe
- Input parameters for Fisher Yurik indicator, default to 2 periods
- Input profit taking and stop loss ratios, default to 5% profit and 2% loss
- Calculate main and signal lines of Fisher Yurik indicator
- Generate buy signal when main line crosses above signal line
- Set trailing stop, exit long position when price drops 2% after entry
- Take profit when price rises above 5%
Advantage Analysis
- Fisher Yurik indicator easily identifies trends, accurate buy signals
- Trailing stop locks in most profits while avoiding stops beyond threshold
- Customizable parameters suit different market environments
- Simple and easy to understand implementation
Risk Analysis
- Improper parameter tuning may cause over-aggressive trading, require cautious testing
- Stop loss too wide may lead to losses fromoutliers beyond expectations
- Take profit too tight may cut wins short, limiting profitability
- Appropriate parameters should be determined for different products
Risks can be addressed by adjusting stop/profit ratios, testing parameters, using signal filters, position sizing rules.
Enhancement Opportunities
- Optimize Fisher Yurik parameters for impact on strategy
- Add signal filters like MACD, KD to improve signal quality
- Add entry conditions like breakouts from Bollinger Bands
- Incorporate position sizing rules to control per trade risk
- Enhance trailing stop methods, e.g. smoothed, Chandelier Exits
Conclusion
The Fisher Yurik trailing stop strategy combines trend identification and risk management. With parameter tuning, indicator combinations, and stop loss enhancements, it can suit most instruments for good profits within acceptable risk tolerances.
Parameters
| Name | Default | What it controls |
|---|---|---|
| v_input_1 | true | From Month |
| v_input_2 | true | From Day |
| v_input_3 | 2021 | From Year |
| v_input_4 | true | To Month |
| v_input_5 | true | To Day |
| v_input_6 | 9999 | To Year |
| v_input_7 | 2 | Period |
| v_input_float_1 | 1.05 | profit level |
| v_input_float_2 | 1.02 | after the signal |
Source Pine Script
/*backtest
start: 2023-01-26 00:00:00
end: 2024-02-01 00:00:00
period: 1d
basePeriod: 1h
exchanges: [{"eid":"Futures_Binance","currency":"BTC_USDT"}]
*/

//@version=5
strategy("Fisher_Yurik Strategy with Trailing Stop", shorttitle="FY Strategy", overlay=true)

// Date Ranges
from_month = input(defval = 1, title = "From Month")
from_day   = input(defval = 1, title = "From Day")
from_year  = input(defval = 2021, title = "From Year")
to_month   = input(defval = 1, title = "To Month")
to_day     = input(defval = 1, title = "To Day")
to_year    = input(defval = 9999, title = "To Year")
start  = timestamp(from_year, from_month, from_day, 00, 00)  // backtest start window
finish = timestamp(to_year, to_month, to_day, 23, 59)        // backtest finish window
window = true
period = input(2, title='Period')
cost = input.float(1.05, title='profit level ', step=0.01)
dusus = input.float(1.02, title='after the signal', step=0.01)

var float Value = na
var float Fish = na
var float ExtBuffer1 = na
var float ExtBuffer2 = na

price = (high + low) / 2
MaxH = ta.highest(high, period)
MinL = ta.lowest(low, period)

Value := 0.33 * 2 * ((price - MinL) / (MaxH - MinL) - 0.5) + 0.67 * nz(Value[1])
Value := math.max(math.min(Value, 0.999), -0.999)
Fish := 0.5 * math.log((1 + Value) / (1 - Value)) + 0.5 * nz(Fish[1])

up = Fish >= 0

ExtBuffer1 := up ? Fish : na
ExtBuffer2 := up ? na : Fish

var float entryPrice = na
var float stopPrice = na

if (ExtBuffer1 > ExtBuffer1[1])
    entryPrice := close*dusus
    stopPrice := close * cost

if (ExtBuffer2 < ExtBuffer2[1])
    entryPrice := close
    stopPrice := close * cost

// Sadece seçilen test döneminde işlem yapma koşulu eklenmiştir
strategy.entry("Buy", strategy.long, when=ExtBuffer1 > ExtBuffer1[1] and window)
strategy.exit("Take Profit/Trailing Stop", from_entry="Buy", when=(close >= entryPrice * cost) or (close < stopPrice), trail_offset=0.08, trail_price=entryPrice * cost)
Published by ChaoZhang on the FMZ strategy square · last modified 2024-02-02. Collected in the Quant Trading Vault. Unvalidated research: re-test with your own data and costs before trusting it.
Build this with AgenKit
A spec is not a trading system. Paste this into your coding agent and AgenKit runs a specialist team — architecture, test-first build, risk gates, review — with paper trading on by default.
/agenkit build a production-grade trading bot with a backtest engine, risk controls and paper trading by default from strategies/Fisher-Yurik-Trailing-Stop-Strategy.md- npx agenkit install engineering-kit in your project
- Paste the command into your agent and approve each phase
- Get tests, backtest, risk controls and a paper-trading switch
Understand it first
Before you run this, read the lesson behind the idea and how to backtest it honestly. Specs like this one are the survivors of an unknown number of trials; deflate their results accordingly.
Related specs
- Bollinger Bands Dynamic Breakout StrategyPine Script · Breakout · 1h
- Cross boundary Dynamic Range Quantitative Trading Strategy Based on Bollinger BandsPine Script · Breakout · 3h
- Momentum Breakout Moving Average StrategyPine Script · Breakout · 1d
- Momentum Breakout Trading Strategy 440964Pine Script · Breakout · 5m
- Momentum Breakout Trading StrategyPine Script · Breakout · 4h
- Moving Average Crossover and Upper Rail Breakthrough Impulse StrategyPine Script · Breakout · 1m