Strategy vault / Trend following
Kaufmans Adaptive Moving Average Trend Tracking Strategy
This strategy uses Kaufman's Adaptive Moving Average (KAMA) to determine the trend direction for catching medium-to-long term trends. It goes long when the KAMA line moves up and goes short when the KAMA line moves…
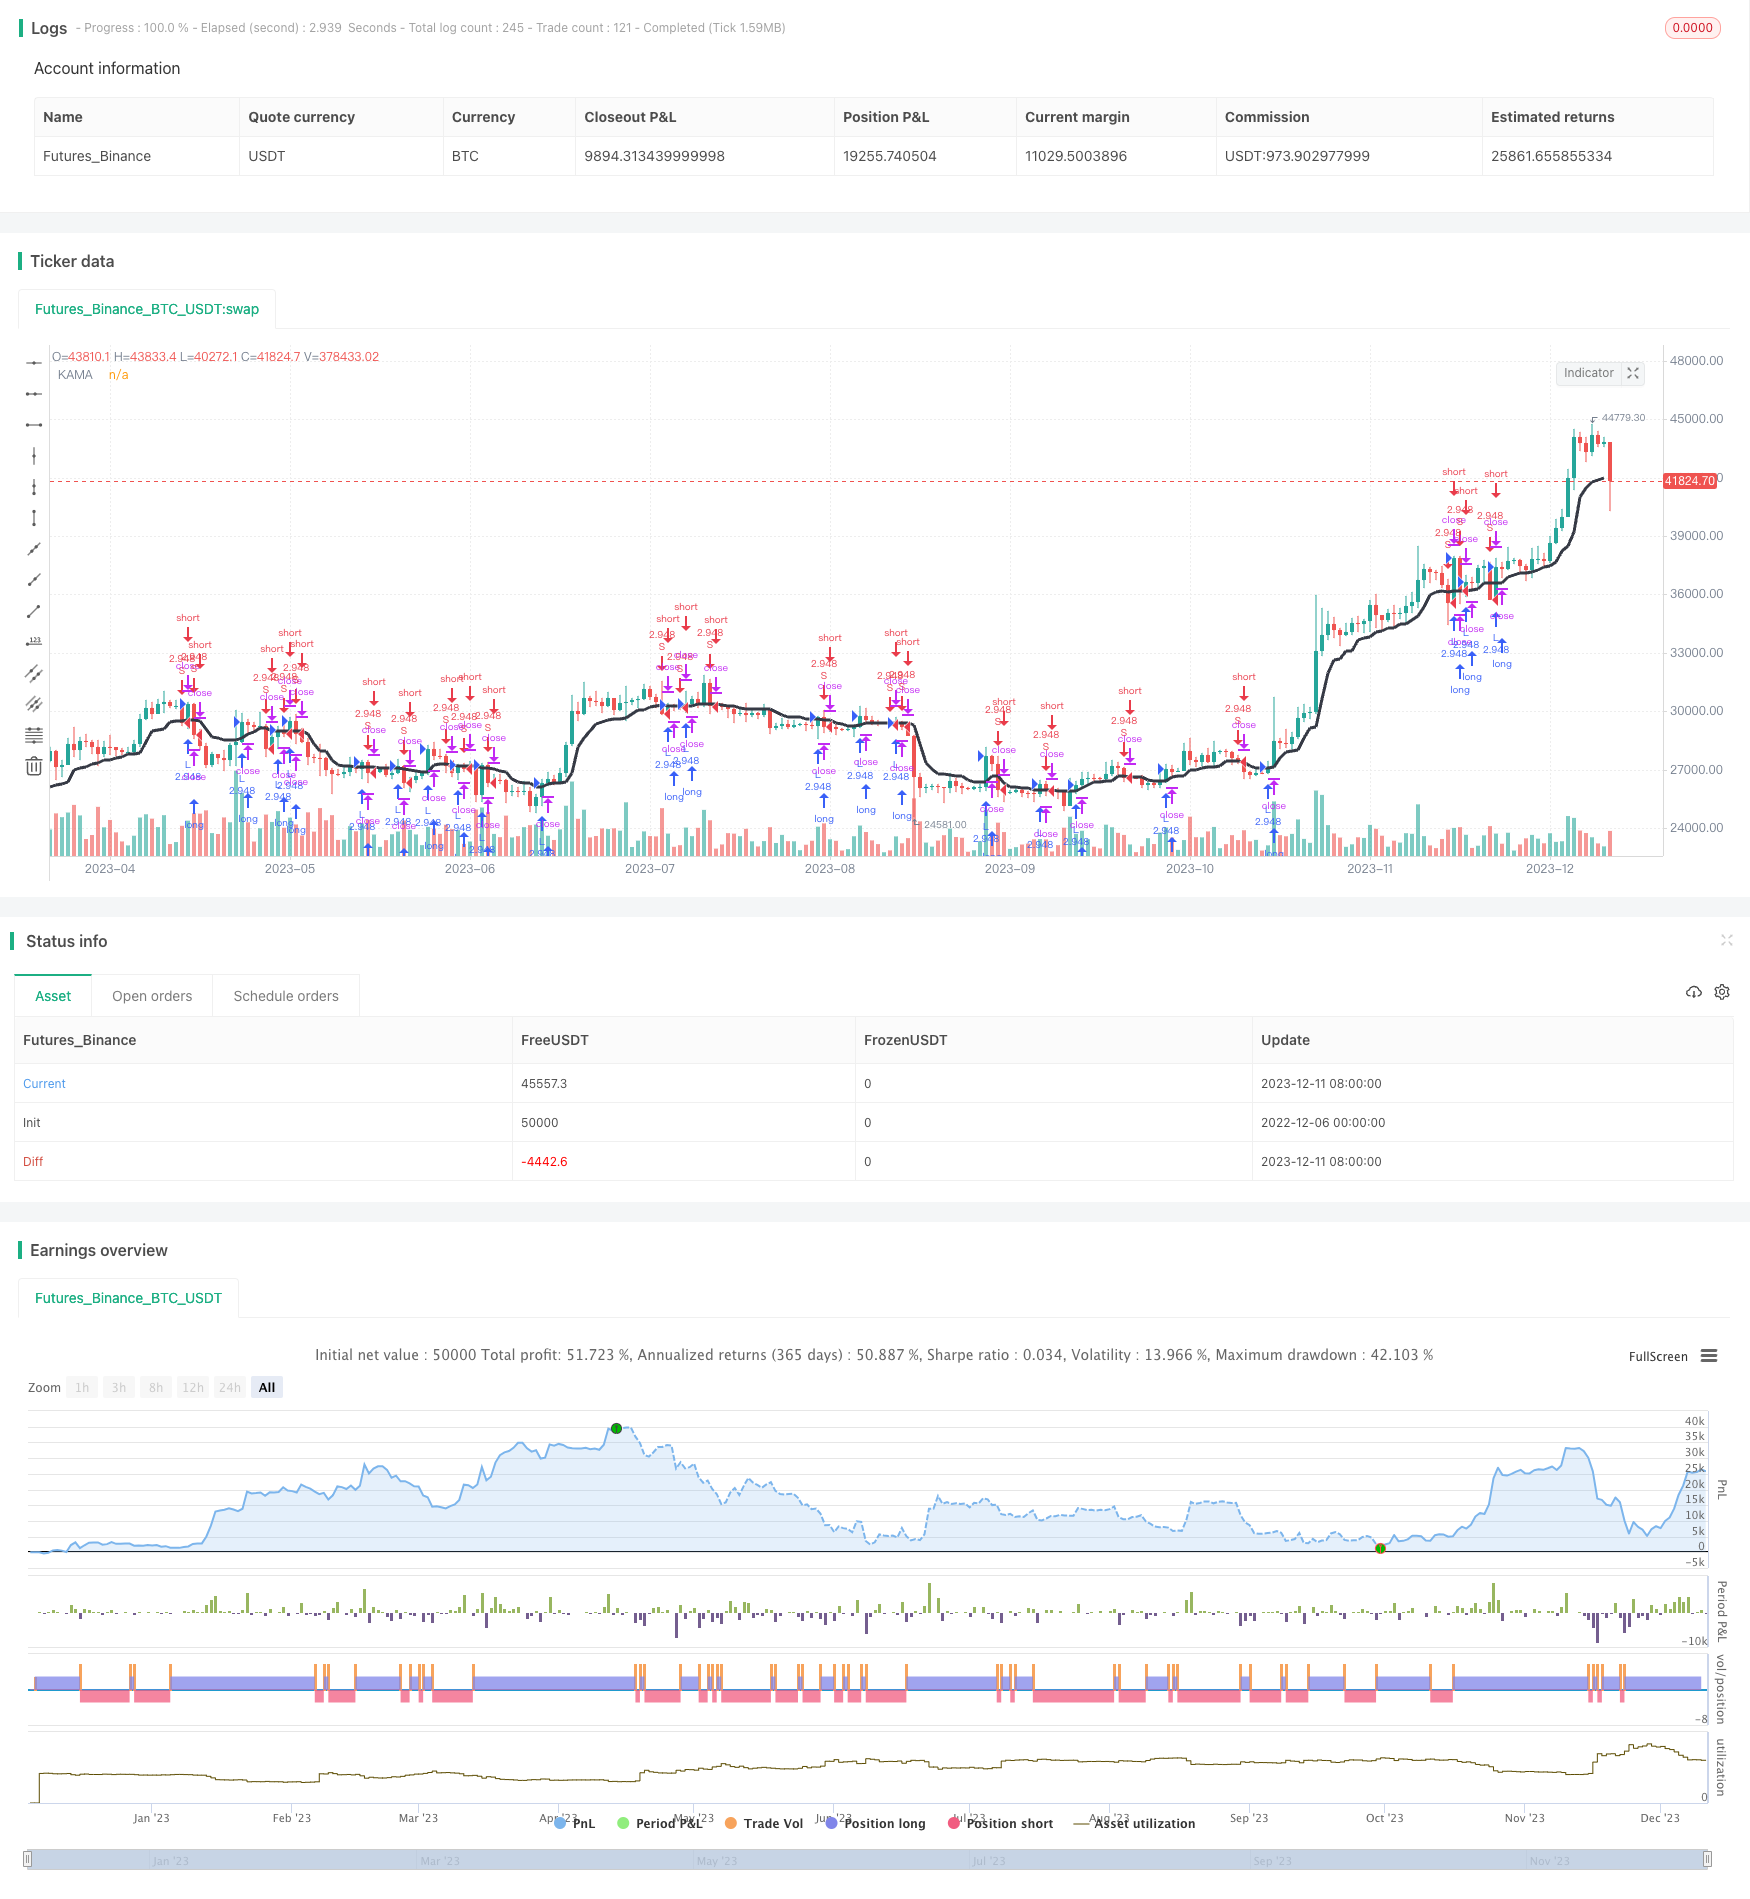
Overview
This strategy uses Kaufman's Adaptive Moving Average (KAMA) to determine the trend direction for catching medium-to-long term trends. It goes long when the KAMA line moves up and goes short when the KAMA line moves down. The strategy combines the trend tracking capability of moving averages and the dynamic adjustment feature of KAMA to improve the quality of trading signals.
Strategy Logic
The core indicator of this strategy is Kaufman's Adaptive Moving Average (KAMA). KAMA dynamically adjusts its weighting factor based on the magnitude of market volatility, thereby improving the sensitivity of the curve. Specifically, when market volatility increases, the KAMA curve becomes smoother; when market volatility decreases, the KAMA curve becomes more sensitive. This filters out some noise while still capturing new trend reversals in a timely manner.
The strategy first calculates the value of KAMA. Then it determines the long/short state of the KAMA line: a buy signal is generated when the close price crosses above the KAMA line, and a sell signal is generated when the close price crosses below the KAMA line. Positions are opened based on these trading signals.
Advantage Analysis
The biggest advantage of this strategy is the use of the KAMA indicator for trend determination. The KAMA indicator itself has very strong trend tracking capability. It can dynamically adjust parameters to adapt to market conditions, thereby producing more reliable trading signals compared to simple moving averages and exponential moving averages.
In addition, the strategy only uses the long/short state of KAMA to determine the trend direction. There are no additional filters, which simplifies the strategy logic and reduces the number of parameters, lowering the risk of overfitting and improving stability and adaptability across markets.
Risk Analysis
The main risk of this strategy is that KAMA is a lagging indicator, so the market trend may have already reversed by the time the trading signals are generated, leading to stop loss risks. In addition, there can be short-term oscillations in the KAMA curve, which may produce some frequent false signals.
To mitigate risks, other indicators may be combined to confirm trading signals, such as volatility indicators, volume indicators, etc. The parameters can also be adjusted to make the KAMA curve smoother.
Optimization Directions
There is still large room for optimizing this strategy, mainly in the following aspects:
Combine other indicators for signal filtering, such as MACD, oscillators etc, to improve signal quality.
Add stop loss strategies like moving stop loss or equity curve based stops to control single trade loss.
Optimize parameters to make KAMA more effective at catching trends.
Add multi-timeframe analysis to determine major trend direction using higher timeframes.
Use machine learning methods to auto optimize parameters for adapting across instruments.
Conclusion
The overall logic of this strategy is clear, using KAMA indicator to determine trend direction. It has advantages like strong trend tracking capability, simple logic and fewer parameters. But it also has the risk of lagging in identifying trend reversals. The strategy can be improved in many ways to make it more effective and adaptable.
Parameters
| Name | Default | What it controls |
|---|---|---|
| v_input_1 | true | Long |
| v_input_2 | true | Short |
| v_input_3 | 100 | Lot |
| v_input_4 | 3 | length |
| v_input_5 | 2 | fast |
| v_input_6 | 30 | slow |
| v_input_7_close | 0 | Source: close | high | low | open | hl2 | hlc3 | hlcc4 | ohlc4 |
| v_input_8 | 0 | Type: Trend | Crossing |
| v_input_9 | 1900 | From Year |
| v_input_10 | 2100 | To Year |
| v_input_11 | true | From Month |
| v_input_12 | 12 | To Month |
| v_input_13 | true | From day |
| v_input_14 | 31 | To day |
Source Pine Script
/*backtest
start: 2022-12-06 00:00:00
end: 2023-12-12 00:00:00
period: 1d
basePeriod: 1h
exchanges: [{"eid":"Futures_Binance","currency":"BTC_USDT"}]
*/

//Noro
//2019

//@version=3
strategy(title = "Noro's KAMA Strategy", shorttitle="KAMA str", overlay=true, default_qty_type = strategy.percent_of_equity, default_qty_value = 100, pyramiding = 0)

//Settings
needlong = input(true, defval = true, title = "Long")
needshort = input(true, defval = true, title = "Short")
capital = input(100, defval = 100, minval = 1, maxval = 10000, title = "Lot")
length = input(3, minval = 1)
fast = input(2, minval = 1)
slow = input(30, minval = 1)
src = input(title = "Source",  defval = close)
type = input(defval = "Trend", options = ["Trend", "Crossing"], title = "Type")
fromyear = input(1900, defval = 1900, minval = 1900, maxval = 2100, title = "From Year")
toyear = input(2100, defval = 2100, minval = 1900, maxval = 2100, title = "To Year")
frommonth = input(01, defval = 01, minval = 01, maxval = 12, title = "From Month")
tomonth = input(12, defval = 12, minval = 01, maxval = 12, title = "To Month")
fromday = input(01, defval = 01, minval = 01, maxval = 31, title = "From day")
today = input(31, defval = 31, minval = 01, maxval = 31, title = "To day")

//KAMA
volatility = sum(abs(src-src[1]), length)
change = abs(src[1]-src[length])
er = iff(volatility != 0, change/volatility, 0)
fastSC = 2/(fast+1)
slowSC = 2/(slow+1)
sc = pow((er*(fastSC-slowSC))+slowSC, 2)
bid = hl2
kama = 0.0
kama := nz(kama[1])+(sc*(bid-nz(kama[1])))
plot(kama, color = black, title = "KAMA", trackprice = false, style = line, linewidth = 3)

//Signals
up = false
dn = false
up := (type == "Crossing" and kama > kama[1]) or (type == "Trend" and close > kama)
dn := (type == "Crossing" and kama < kama[1]) or (type == "Trend" and close < kama)

//Trading
size = strategy.position_size
lot = 0.0
lot := size == 0 ? strategy.equity / close * capital / 100 : lot[1]
if up
    strategy.entry("L", strategy.long, needlong ? lot : 0, when = (time > timestamp(fromyear, frommonth, fromday, 00, 00) and time < timestamp(toyear, tomonth, today, 23, 59)))

if dn
    strategy.entry("S", strategy.short, needshort ? lot : 0, when = (time > timestamp(fromyear, frommonth, fromday, 00, 00) and time < timestamp(toyear, tomonth, today, 23, 59)))
Published by ChaoZhang on the FMZ strategy square · last modified 2023-12-13. Collected in the Quant Trading Vault. Unvalidated research: re-test with your own data and costs before trusting it.
Build this with AgenKit
A spec is not a trading system. Paste this into your coding agent and AgenKit runs a specialist team — architecture, test-first build, risk gates, review — with paper trading on by default.
/agenkit build a production-grade trading bot with a backtest engine, risk controls and paper trading by default from strategies/Kaufmans-Adaptive-Moving-Average-Trend-Tracking-Strategy.md- npx agenkit install engineering-kit in your project
- Paste the command into your agent and approve each phase
- Get tests, backtest, risk controls and a paper-trading switch
Understand it first
Before you run this, read the lesson behind the idea and how to backtest it honestly. Specs like this one are the survivors of an unknown number of trials; deflate their results accordingly.
Related specs
- Bollinger Bands and RSI Trend Following StrategyPine Script · Trend following · 1h
- Dual ATR Channel Trend Following StrategyPine Script · Trend following · 15m
- Dual MA Crossover Trend Tracking StrategyPine Script · Trend following · 1h
- Dynamic Dual EMA Crossover Strategy with Adaptive Profit Loss ControlPine Script · Trend following · 1d
- EMA SMA Multi Indicator Comprehensive Trend Following StrategyPine Script · Trend following · 1h
- EMA and RSI Trend Trading StrategyPine Script · Trend following · 1d