Strategy vault / Trend following
Larry Williams Moving Average Crossover Strategy
This is a simple and classic moving average crossover strategy created by famous trader Larry Williams. The strategy uses 9-day simple moving average as the fast line and 21-day exponential moving average as the slow…
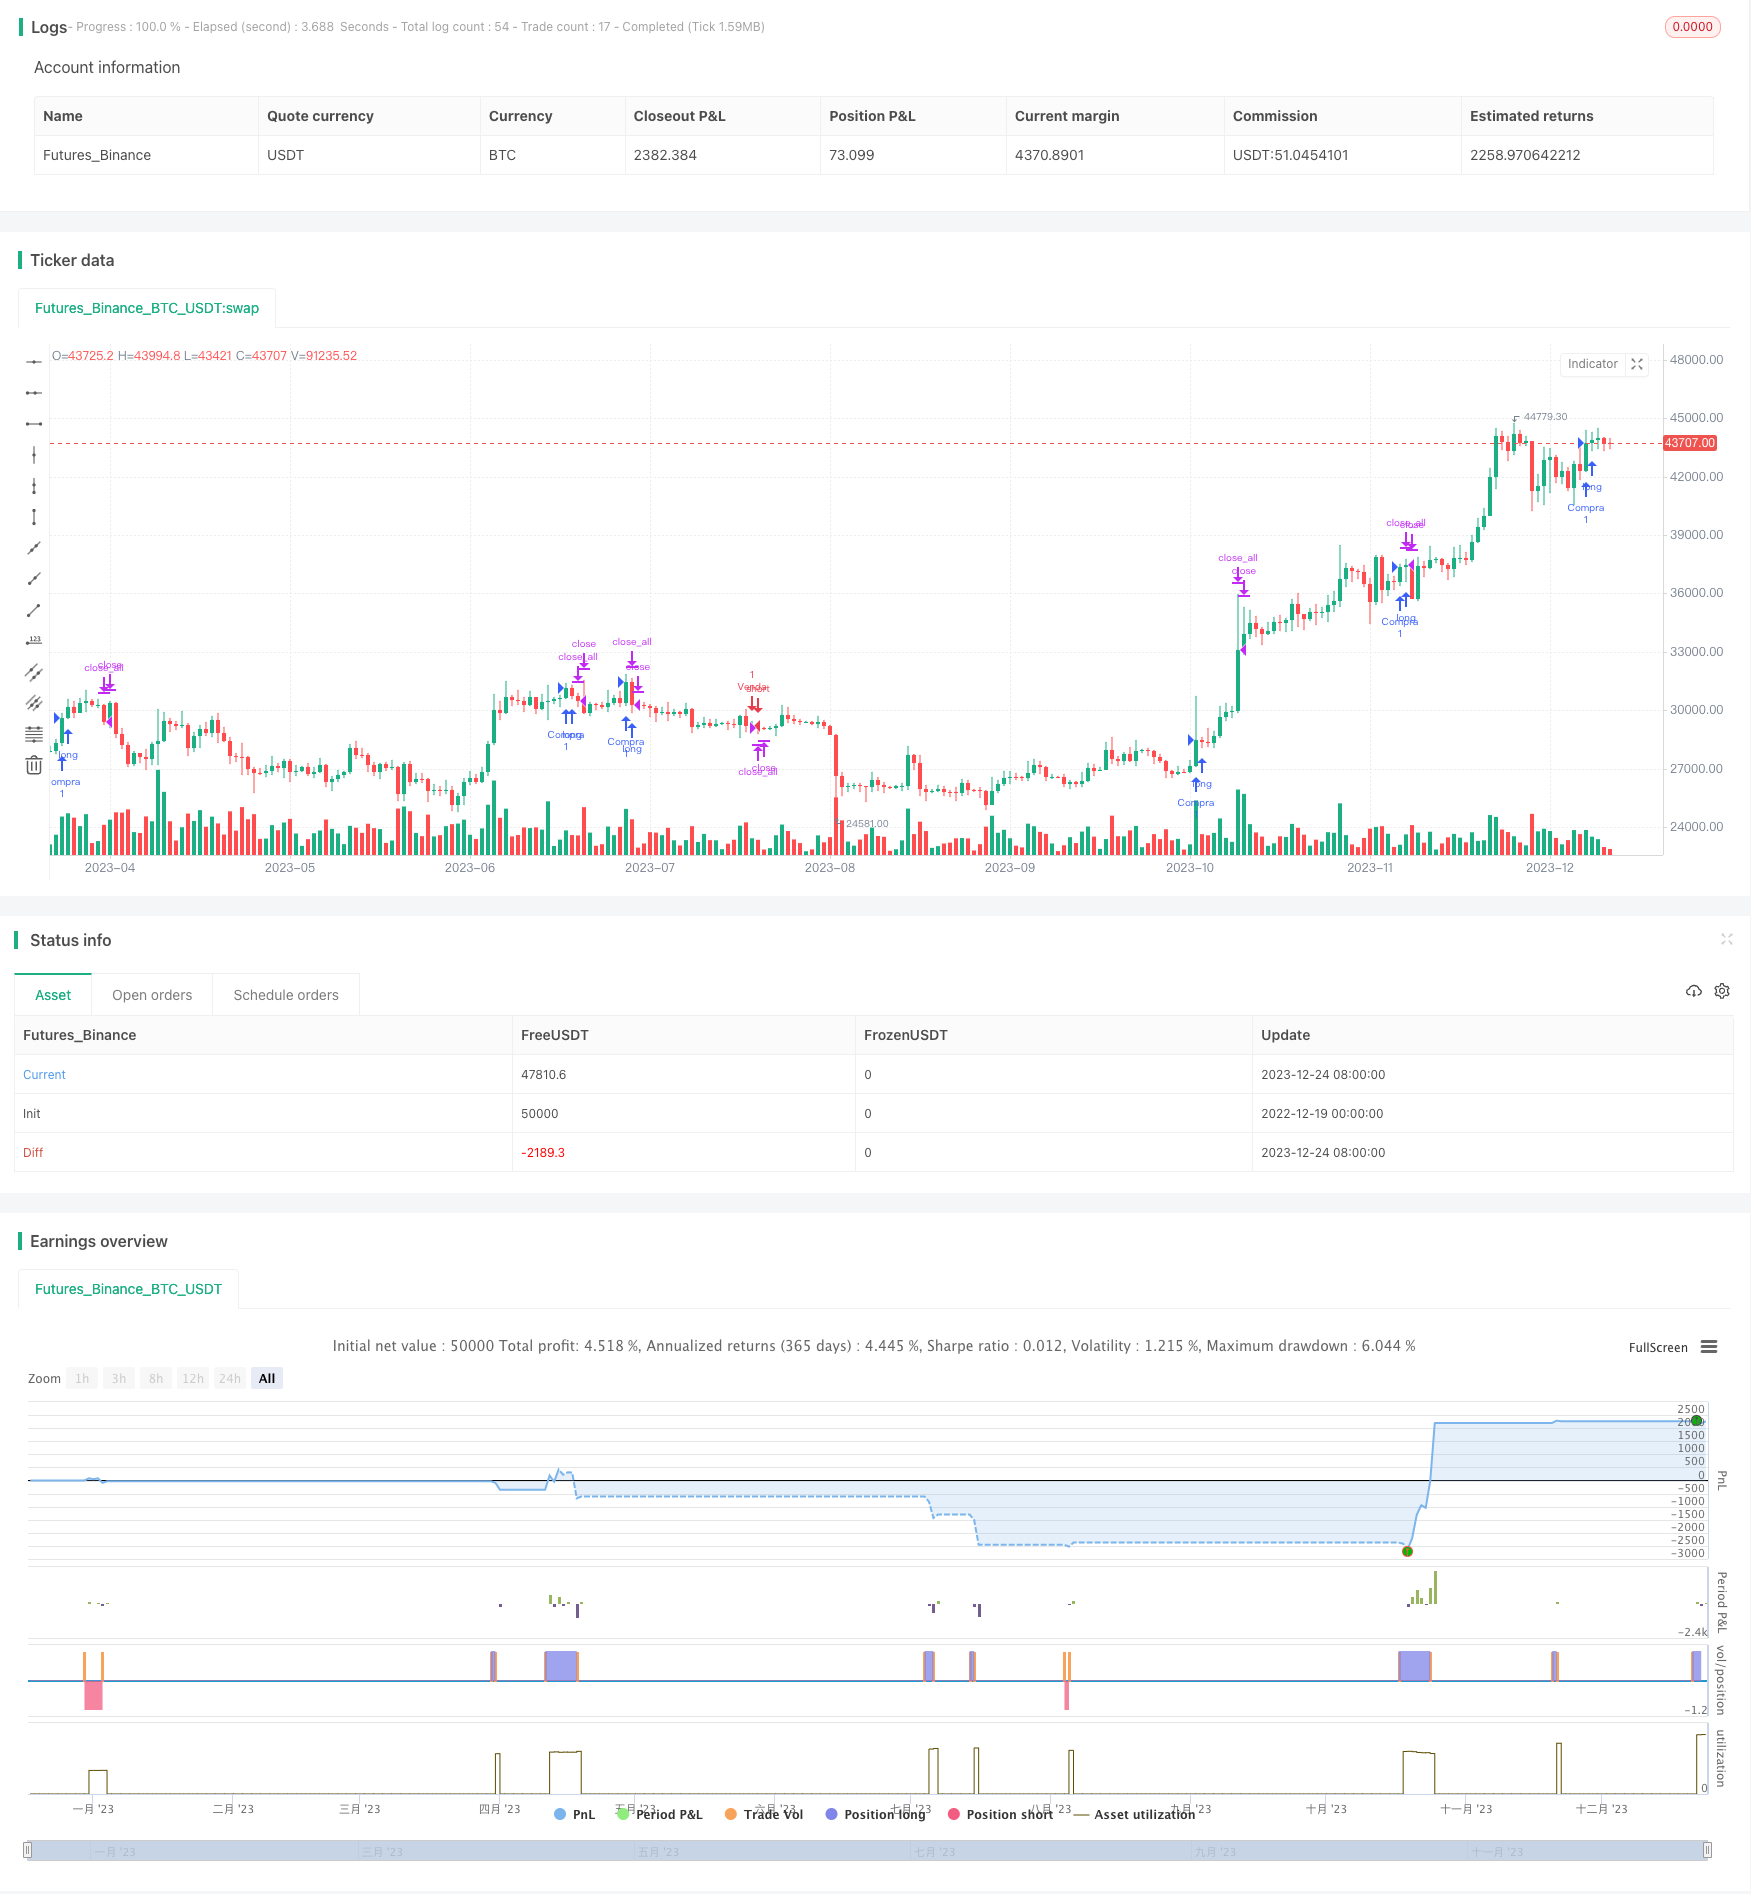
Overview
This is a simple and classic moving average crossover strategy created by famous trader Larry Williams. The strategy uses 9-day simple moving average as the fast line and 21-day exponential moving average as the slow line. It goes long when the price breaks above the 9-day line, and goes short when the price breaks below the 9-day line. To filter false breakouts, the 21-day line is also used to confirm the trend.
Strategy Logic
The strategy is based on golden crossover and death crossover of moving averages to determine long and short opportunities. When the fast line breaks above the slow line from below, it is a golden crossover, indicating a change to a bullish trend. Such breakout is used for going long. When the fast line breaks below the slow line from above, it is a death crossover, indicating a change to a bearish trend. Such breakout is used for going short.
To avoid false breakouts leading to virtual losses, the 21-day line is also used to determine the major trend. Only when the fast line breaks out and the price also breaks the 21-day line, will trade actions be taken. This can effectively filter out many false breakouts.
Specifically, the long signal is triggered when: the fast line breaks above yesterday's high and breaks above the 21-day line. The short signal is triggered when: the fast line breaks below yesterday's low and breaks below the 21-day line.
Advantage Analysis
The main advantages of this strategy are:
- The strategy idea is simple and easy to understand and implement.
- The moving average technique is mature and widely used.
- Introduction of the 21-day line effectively filters false breakouts.
- Using yesterday's extreme points to enter positions can prevent being trapped.
- The strategy parameters are relatively robust without overfitting easily.
Risk Analysis
The main risks of this strategy are:
- In volatile markets, the moving averages lag and may miss the best entry points.
- In range-bound markets with sideways price action, frequent small losses may occur.
- It cannot respond effectively to sudden events and significant trend changes.
To address these risks, optimizations can be made in the following aspects:
- Introduce MACD indicator for more real-time signals.
- Increase the MA period parameters to lower trading frequency.
- Add stop loss strategies to control single trade loss amount.
Optimization Directions
The main optimization directions for this strategy include:
Parameter optimization. More systematic methods can be used to test different MA period combinations to find better parameters.
Add stop loss. Set proper moving stop loss, percentage stop loss etc to effectively control single trade loss.
Combine other indicators. Introduce signals from MACD, ATR, KD etc to obtain more confirmation dimensions and improve strategy stability.
Optimize exit mechanisms. Research different types of exit methods like reversal signal exits, moving profit-taking exits etc.
Conclusion
In summary, this moving average crossover strategy is a very typical and practical trend following strategy. It has the advantage of being easy to understand and implement, and also has room for improvement. Through methods like parameter optimization, stop loss optimization, multi-indicator combination etc, continuous improvements can be made to turn it into a more stable and practical trading system.
Parameters
| Name | Default | What it controls |
|---|---|---|
| v_input_int_1 | 9 | Media Curta |
| v_input_int_2 | 21 | Media Curta |
| v_input_int_3 | 15 | Percentual Ganho |
| v_input_int_4 | 5 | Percental Perda |
Source Pine Script
// @_benac
//@version=5
strategy('Larry', overlay=true , initial_capital=1000 )


////////////////////////////////////////////////////////
//                                                    //
//                                                    //
//                 Codigo Operacional                 //
//                                                    //
//                                                    //
////////////////////////////////////////////////////////

// Usage for Stocks , or Criptos with value bigger then 1, cuz of 0.01 ´pip.
// Daily timeframe
//Observation Point
start     = timestamp(2020, 00, 00, 00, 00)         // backtest start window
finish    = timestamp(2022, 01, 07, 23, 59)        // backtest finish window
window()  => true // create function "within window of time"

if time < start
    strategy.close_all("Closing All")

// Take infos from inputs.
inp_mmshort = input.int(defval = 9, title = "Media Curta"  )
inp_mminter = input.int(defval = 21, title = "Media Curta"  )

// Risk Manager, here define max and min
inp_max = input.int(defval = 15, title = "Percentual Ganho"  )
inp_min = input.int(defval = 5, title = "Percental  Perda"  )

// Converting the input to %
pmax = (inp_max / 100 )
pmin =  (inp_min / 100)

// Infos From Moving Average
mm_short = ta.sma(close , inp_mmshort)
mm_inter = ta.ema(close , inp_mminter)


// Trend Logic
//Long Condition

//Setup do Larry Willians Bem Simples , media virou para cima e rompeu a maxima de referencia, compra.
tendencia_alta = mm_short[2] > mm_short[1] and mm_short > mm_short[1] and close > high[1] and close > mm_short and mm_short > mm_inter
tendencia_baixa = mm_short[2] < mm_short[1] and mm_short < mm_short[1] and close > low[1] and close < mm_short and mm_short < mm_inter

// Creating the entry
if tendencia_alta
    strategy.entry("Compra" , strategy.long , stop = low - 0.01  )
    stop_inst = low - 0.01
if tendencia_baixa
    strategy.entry("Venda" , strategy.short , stop= high + 0.01  )
    stop_inst = high + 0.01


// TrailingStop Creation

// Sell Position
if strategy.position_size < 0
    gain_p = strategy.opentrades.entry_price(0) - (strategy.opentrades.entry_price(0) * pmax)
    stop_p = strategy.opentrades.entry_price(0) + (strategy.opentrades.entry_price(0) * pmin)
    // Managing the position
    if close < gain_p
        strategy.close_all(comment = " 1 - Ganho : " + str.tostring( gain_p) + " Perda : " + str.tostring( stop_p)  )
    if close > stop_p
        strategy.close_all(comment = " 2 - Ganho : " + str.tostring( gain_p) + " Perda : " + str.tostring( stop_p)  )

    if  high > mm_short[1]
        strategy.close_all(comment = " 3 - Ganho : " + str.tostring( gain_p) + " Perda : " + str.tostring( stop_p)  )


// Buy Position
if strategy.position_size > 0
    gain_p = strategy.opentrades.entry_price(0) + (strategy.opentrades.entry_price(0) * pmax)
    stop_p = strategy.opentrades.entry_price(0) - (strategy.opentrades.entry_price(0) * pmin)
    // Managing the position
    if close > gain_p
        strategy.close_all(comment = " 1- Ganho : " + str.tostring( gain_p) + " Perda : " + str.tostring( stop_p)  )
    if close < stop_p
        strategy.close_all(comment = " 2 -Ganho : " + str.tostring( gain_p) + " Perda : " + str.tostring( stop_p)  )
    if low < mm_short[1]
        strategy.close_all(comment = " 3 -Ganho : " + str.tostring( gain_p) + " Perda : " + str.tostring( stop_p)  )
Published by ChaoZhang on the FMZ strategy square · last modified 2023-12-26. Collected in the Quant Trading Vault. Unvalidated research: re-test with your own data and costs before trusting it.
Build this with AgenKit
A spec is not a trading system. Paste this into your coding agent and AgenKit runs a specialist team — architecture, test-first build, risk gates, review — with paper trading on by default.
/agenkit build a production-grade trading bot with a backtest engine, risk controls and paper trading by default from strategies/Larry-Williams-Moving-Average-Crossover-Strategy.md- npx agenkit install engineering-kit in your project
- Paste the command into your agent and approve each phase
- Get tests, backtest, risk controls and a paper-trading switch
Understand it first
Before you run this, read the lesson behind the idea and how to backtest it honestly. Specs like this one are the survivors of an unknown number of trials; deflate their results accordingly.
Related specs
- Bollinger Bands and RSI Trend Following StrategyPine Script · Trend following · 1h
- Dual ATR Channel Trend Following StrategyPine Script · Trend following · 15m
- Dual MA Crossover Trend Tracking StrategyPine Script · Trend following · 1h
- Dynamic Dual EMA Crossover Strategy with Adaptive Profit Loss ControlPine Script · Trend following · 1d
- EMA SMA Multi Indicator Comprehensive Trend Following StrategyPine Script · Trend following · 1h
- EMA and RSI Trend Trading StrategyPine Script · Trend following · 1d