Strategy vault / Trend following
Liquidity Driven Trend Strategy A Quant Trading Strategy Based on Flow Trend Indication
The strategy is named "Liquidity Driven Trend Strategy". It aims to identify the price trend direction across different time frames and make corresponding long or short decisions. The strategy employs a dual moving…
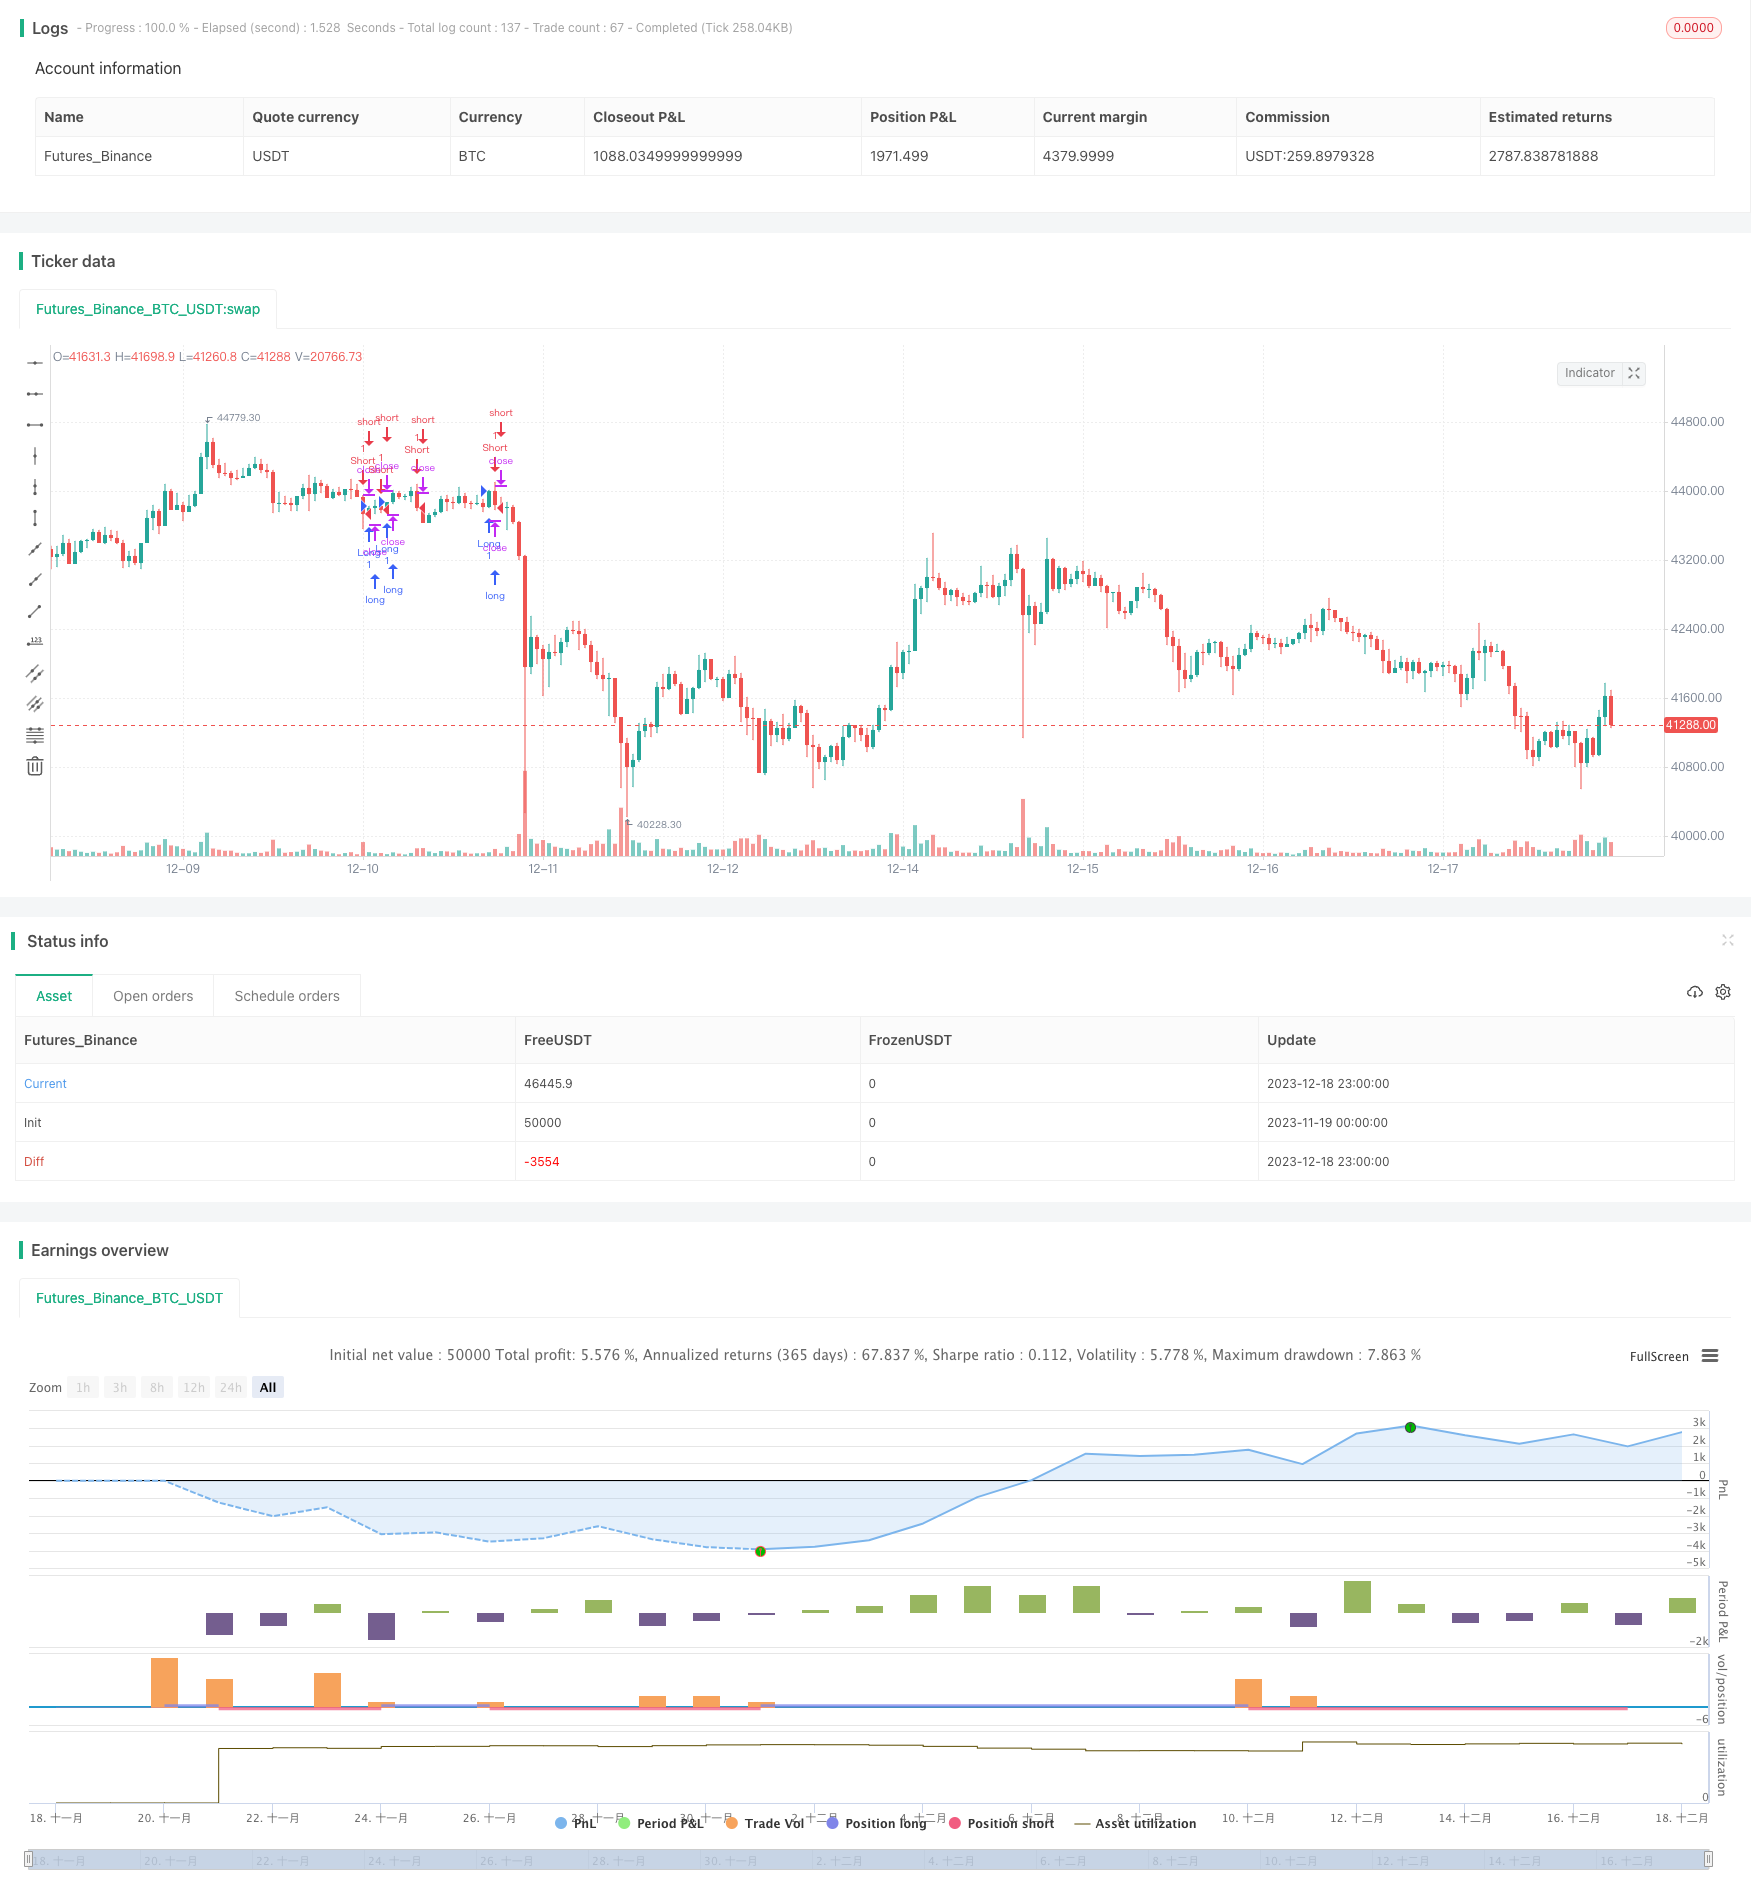
Overview
The strategy is named "Liquidity Driven Trend Strategy". It aims to identify the price trend direction across different time frames and make corresponding long or short decisions. The strategy employs a dual moving average system to determine the trend and uses the difference between Relative Strength Index (RSI) values across multiple time frames to respond timely to trend changes.
Strategy Logic
The core logic of this strategy is based on the CHOP indicator, where the moving average system judges the overall trend direction. Specifically, the strategy calculates the RSI values of a fast line (Length = 20) and a slow line (Length = 50) on higher time frames, and computes the difference between the two RSI lines. When the fast line RSI crosses above the slow line RSI, it signals an upward trend and triggers long signals. On the contrary, if the fast line RSI crosses below the slow line RSI, it indicates a downward trend and generates short signals. The varying RSI difference driven by price rises and falls can sensitively identify trend changing points.
The strategy also introduces a multi-timeframe mechanism: it computes the RSI difference on higher time frames (e.g. daily) to determine the overall trend direction, and then executes actual buy and sell orders on lower time frames (e.g. 5 mins) based on the higher timeframe trend judgment. Such combination of multiple time frames takes into account both high-timeframe trend decisions and the flexibility of low-timeframe execution.
Advantages of the Strategy
- Sensitively capture potential trend reversals ahead of time using RSI divergence
- Apply multi-timeframe concept to determine trend on higher TF and execute orders on lower TF
- RSI reflects price and volume changes, indicating market liquidity and participation
- Simple parameter settings, easy to understand, explain and tune
Risks & Solutions
- False breakout may happen with dual MA system
- Failed breakout can cause unnecessary losses
Solutions:
- Adjust MA parameters to reduce false breakout probability
- Add filters to avoid unnecessary entry
Optimization Directions
- Optimize RSI parameters using Kalman Filter algorithms
- Add MACD and other indicators to assist judgement
- Set dynamic exit positions based on trading volume changes
Conclusion
This strategy leverages RSI divergence to sensitively capture potential turning points of the trend. The multi-timeframe application ensures judging the overall trend while keeping specific trade execution flexible. Compared to other trend following strategies, this strategy is more straightforward, intuitive in parameter adjustments and easy to optimize. In conclusion, the strategy forms an efficient and practical trend trading system worth further exploration and application.
Source Pine Script
/*backtest
start: 2023-11-19 00:00:00
end: 2023-12-19 00:00:00
period: 1h
basePeriod: 15m
exchanges: [{"eid":"Futures_Binance","currency":"BTC_USDT"}]
*/

//@version=3
strategy("Flow Trend Indicator Strategy", "FlowTI", overlay=true, calc_on_every_tick=true)

isTimeFrame(timeFrame) =>
    timeFrame == timeframe.period ? true : false

Htf() =>
    isTimeFrame("12") ? "60" : isTimeFrame("60") ? "300" : isTimeFrame("300") ? "D" : isTimeFrame("D") ? "W" : isTimeFrame("W") ? "M" : isTimeFrame("M") ? "5M" : "D"

TrendIndication() =>
    trendFastLength = 20
    trendSlowLength = 50
    upFastHtf = request.security(syminfo.tickerid, Htf(), rma(max(change(close), 0), trendFastLength), barmerge.gaps_off, barmerge.lookahead_on)
    downFastHtf = request.security(syminfo.tickerid, Htf(), rma(-min(change(close), 0), trendFastLength), barmerge.gaps_off, barmerge.lookahead_on)
    rsiFastHtf = downFastHtf == 0 ? 100 : upFastHtf == 0 ? 0 : 100 - (100 / (1 + upFastHtf / downFastHtf))
    upSlowHtf = request.security(syminfo.tickerid, Htf(), rma(max(change(close), 0), trendSlowLength), barmerge.gaps_off, barmerge.lookahead_on)
    downSlowHtf = request.security(syminfo.tickerid, Htf(), rma(-min(change(close), 0), trendSlowLength), barmerge.gaps_off, barmerge.lookahead_on)
    rsiSlowHtf = downSlowHtf == 0 ? 100 : upSlowHtf == 0 ? 0 : 100 - (100 / (1 + upSlowHtf / downSlowHtf))
    rsiDiff = rsiFastHtf - rsiSlowHtf
    crossover(rsiDiff, 0) ? true : crossunder(rsiDiff, 0) ? false : na

if (TrendIndication() == true)
    strategy.entry("Long", strategy.long)

if (TrendIndication() == false)
    strategy.entry("Short", strategy.short)
Published by ChaoZhang on the FMZ strategy square · last modified 2023-12-21. Collected in the Quant Trading Vault. Unvalidated research: re-test with your own data and costs before trusting it.
Build this with AgenKit
A spec is not a trading system. Paste this into your coding agent and AgenKit runs a specialist team — architecture, test-first build, risk gates, review — with paper trading on by default.
/agenkit build a production-grade trading bot with a backtest engine, risk controls and paper trading by default from strategies/Liquidity-Driven-Trend-Strategy-A-Quant-Trading-Strategy-Based-on-Flow-Trend-Indication.md- npx agenkit install engineering-kit in your project
- Paste the command into your agent and approve each phase
- Get tests, backtest, risk controls and a paper-trading switch
Understand it first
Before you run this, read the lesson behind the idea and how to backtest it honestly. Specs like this one are the survivors of an unknown number of trials; deflate their results accordingly.
Related specs
- Adaptive ATR and RSI Trend Following Strategy with Trailing Stop LossPine Script · Trend following · 1h
- Adaptive Price Crossing Moving Average Trading StrategyPine Script · Trend following · 1d
- Advanced Multi Indicator Multi Dimensional Trend Cross Quantitative StrategyPine Script · Trend following · 3h
- Advanced Supertrend Indicator Trading Mechanism Optimization StrategyPine Script · Trend following · 1d
- Bollinger Bands and RSI Trend Following StrategyPine Script · Trend following · 1h
- Dual ATR Channel Trend Following StrategyPine Script · Trend following · 15m