Strategy vault / Trend following
MACD 200 Day Moving Average Crossover Trading Strategy
This trading strategy is a quantitative strategy based on the MACD indicator's 200-day moving average crossover operation. It combines the dual functions of the MACD indicator to judge market buy and sell signals and…
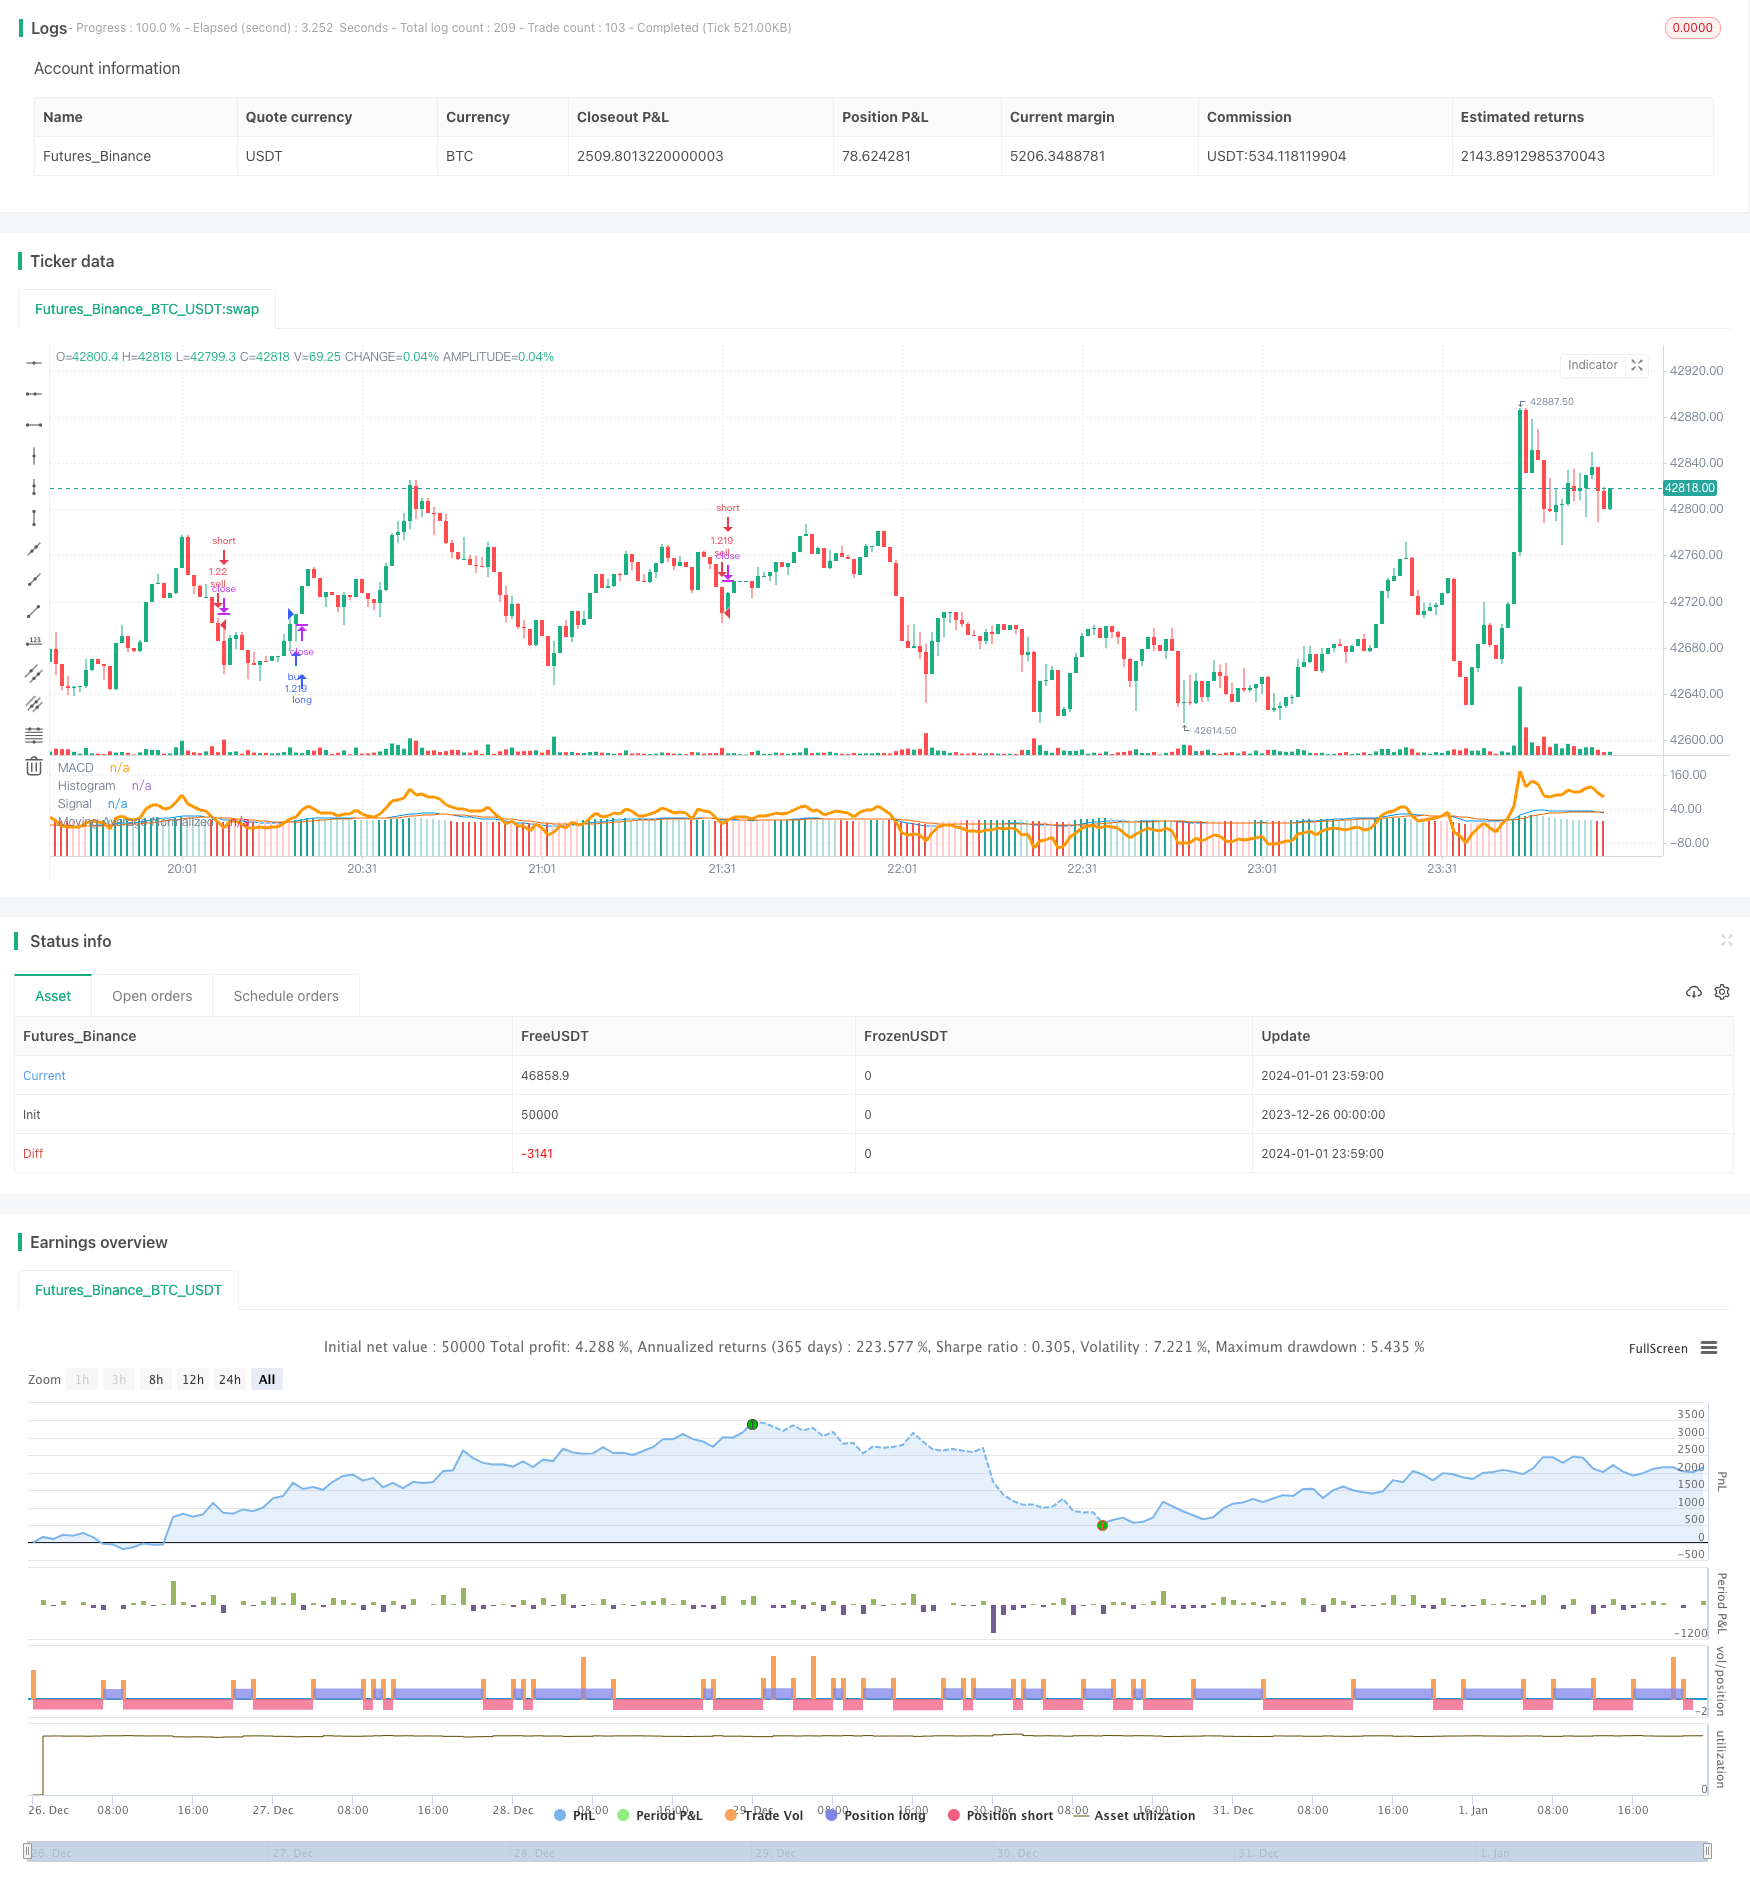
Overview
This trading strategy is a quantitative strategy based on the MACD indicator's 200-day moving average crossover operation. It combines the dual functions of the MACD indicator to judge market buy and sell signals and the 200-day moving average to judge market trends, aiming to discover more precise entry and exit timing.
Strategy Principle
There are two key points to this strategy:
MACD indicator's fast and slow line crossovers generate buy and sell signals. When the fast line breaks through the slow line upward, a buy signal is generated. When the fast line breaks through the slow line downward, a sell signal is generated.
The 200-day moving average judges the overall market trend. Prices above the 200-day moving average indicate a bull market, and below indicate a bear market. Buy signals are only acted upon in a bull market, and sell signals only in a bear market.
According to these two points, the specific trading rules of this strategy are:
When the MACD fast line breaks through the MACD slow line upward, the histogram is negative, and the price is above the 200-day moving average, a buy operation is made. When the MACD fast line breaks downward through the slow line, the histogram is positive, and the price is below the 200-day moving average, a sell operation is made.
Advantage Analysis
The dual confirmation improves the stability and success rate of the strategy. MACD judges the buy and sell signals, and the 200-day moving average judges the market trend. The dual confirmation can filter out some trading signals with greater uncertainty.
In a strongly trending market, this strategy can bring relatively high profits. Especially in a bull market, it can quickly capture price upside opportunities.
The MACD indicator is also relatively sensitive to getting out of consolidation phases. When the price ends a long period of consolidation and enters a trending phase, this strategy can quickly capture the new trend direction.
Risk Analysis
This strategy is quite sensitive to parameter settings. Improper MACD indicator parameter settings may cause false signals.
Near trend turning points, MACD signals tend to produce more errors. At this time, there may be a larger drawdown in the strategy's profitability.
When prices are in a long period of consolidation, this strategy cannot determine a clear trend direction, which leads to increased fluctuation in profit/loss and longer drawdown times.
Optimization
Different parameter combinations can be tested to find MACD parameters that produce more accurate signals.
Consider adding confirmation from other technical indicators like RSI and KD to form a consensus of multiple indicators, thereby increasing the reliability of the strategy.
Set stop loss points to control maximum drawdown. Immediately stop loss when prices make a significant reversal, which can effectively avoid enlarging losses.
Conclusion
The MACD 200-day moving average crossover strategy combines the dual functions of trend judgment and trading signal judgment, which can effectively improve profitability probability. It is a relatively robust and reliable quantitative trading strategy. But this strategy also relies somewhat on parameters and market conditions. Continued optimization and testing can further enhance the stable profit-generating ability of the strategy.
Parameters
| Name | Default | What it controls |
|---|---|---|
| v_input_1 | 12 | Fast Length |
| v_input_2 | 26 | Slow Length |
| v_input_3_close | 0 | Source: close | high | low | open | hl2 | hlc3 | hlcc4 | ohlc4 |
| v_input_4 | 9 | Signal Smoothing |
| v_input_5 | false | Simple MA(Oscillator) |
| v_input_6 | false | Simple MA(Signal Line) |
| v_input_7 | 200 | Moving Average Length |
Source Pine Script
/*backtest
start: 2023-12-26 00:00:00
end: 2024-01-02 00:00:00
period: 1m
basePeriod: 1m
exchanges: [{"eid":"Futures_Binance","currency":"BTC_USDT"}]
*/

// This source code is subject to the terms of the Mozilla Public License 2.0 at https://mozilla.org/MPL/2.0/
// © x11joe

//@version=4
//This strategy is based on a youtube strategy that suggested I do this...so I did!

strategy(title="MacD 200 Day Moving Average Signal Crossover Strategy", overlay=false, precision=2,commission_value=0.26, initial_capital=10000, currency=currency.USD, default_qty_type=strategy.percent_of_equity, default_qty_value=100)

// Getting inputs
fast_length = input(title="Fast Length", type=input.integer, defval=12)
slow_length = input(title="Slow Length", type=input.integer, defval=26)
src = input(title="Source", type=input.source, defval=close)
signal_length = input(title="Signal Smoothing", type=input.integer, minval = 1, maxval = 50, defval = 9)
sma_source = input(title="Simple MA(Oscillator)", type=input.bool, defval=false)
sma_signal = input(title="Simple MA(Signal Line)", type=input.bool, defval=false)

// Plot colors
col_grow_above = #26A69A
col_grow_below = #FFCDD2
col_fall_above = #B2DFDB
col_fall_below = #EF5350
col_macd = #0094ff
col_signal = #ff6a00

// Calculating
fast_ma = sma_source ? sma(src, fast_length) : ema(src, fast_length)
slow_ma = sma_source ? sma(src, slow_length) : ema(src, slow_length)
macd = fast_ma - slow_ma
signal = sma_signal ? sma(macd, signal_length) : ema(macd, signal_length)
hist = macd - signal

moving_avg_length = input(title="Moving Average Length", type=input.integer, defval=200)
moving_avg = sma(close,moving_avg_length)

moving_avg_normalized = close - moving_avg
plot(moving_avg_normalized, title="Moving Average Normalized", style=plot.style_line, color=color.orange,linewidth=3)

plot(hist, title="Histogram", style=plot.style_columns, color=(hist>=0 ? (hist[1] < hist ? col_grow_above : col_fall_above) : (hist[1] < hist ? col_grow_below : col_fall_below) ), transp=0 )
plot(macd, title="MACD", color=col_macd, transp=0)
plot(signal, title="Signal", color=col_signal, transp=0)

if(macd>signal and macd<0 and close>moving_avg)
    strategy.entry("buy",strategy.long)

if(close<moving_avg and macd<signal and macd>0)
    strategy.entry("sell",strategy.short)
Published by ChaoZhang on the FMZ strategy square · last modified 2024-01-03. Collected in the Quant Trading Vault. Unvalidated research: re-test with your own data and costs before trusting it.
Build this with AgenKit
A spec is not a trading system. Paste this into your coding agent and AgenKit runs a specialist team — architecture, test-first build, risk gates, review — with paper trading on by default.
/agenkit build a production-grade trading bot with a backtest engine, risk controls and paper trading by default from strategies/MACD-200-Day-Moving-Average-Crossover-Trading-Strategy.md- npx agenkit install engineering-kit in your project
- Paste the command into your agent and approve each phase
- Get tests, backtest, risk controls and a paper-trading switch
Understand it first
Before you run this, read the lesson behind the idea and how to backtest it honestly. Specs like this one are the survivors of an unknown number of trials; deflate their results accordingly.
Related specs
- Bollinger Bands and RSI Trend Following StrategyPine Script · Trend following · 1h
- Dual ATR Channel Trend Following StrategyPine Script · Trend following · 15m
- Dual MA Crossover Trend Tracking StrategyPine Script · Trend following · 1h
- Dynamic Dual EMA Crossover Strategy with Adaptive Profit Loss ControlPine Script · Trend following · 1d
- EMA SMA Multi Indicator Comprehensive Trend Following StrategyPine Script · Trend following · 1h
- EMA and RSI Trend Trading StrategyPine Script · Trend following · 1d