Strategy vault / Trend following
MACD Crossover with Signal Strategy
The MACD Crossover with Signal strategy generates trading signals when the MACD crosses above or below the signal line. The strategy combines the idea of double moving averages to capture the turning points of…
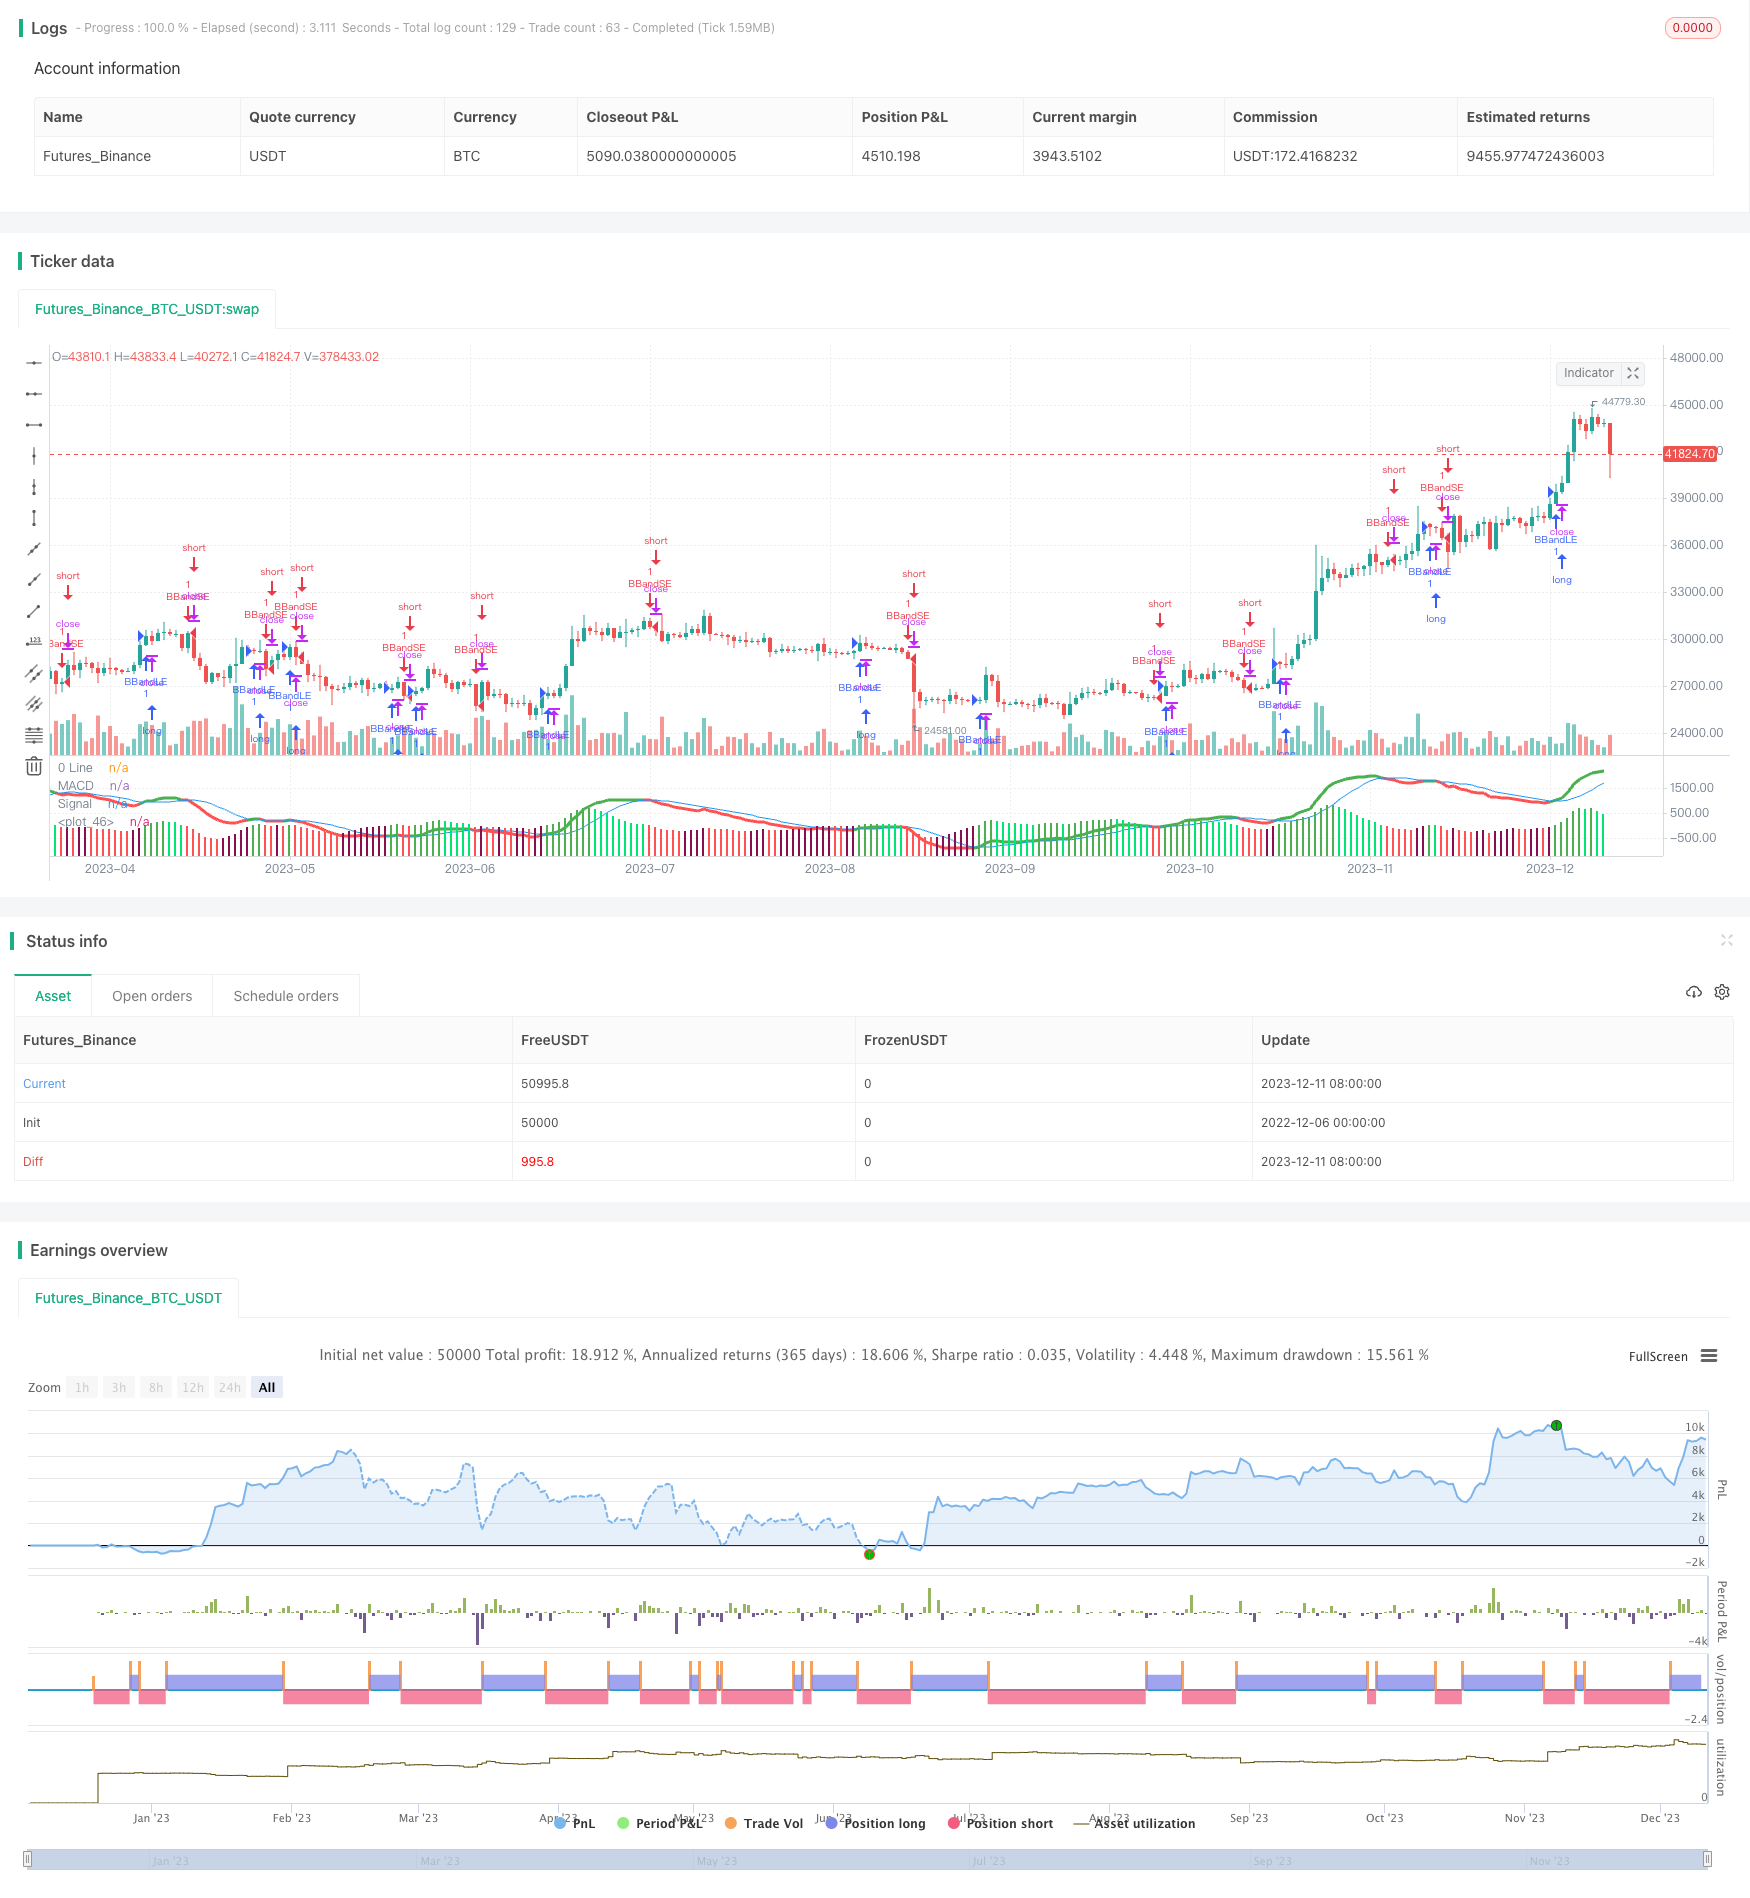
Overview
The MACD Crossover with Signal strategy generates trading signals when the MACD crosses above or below the signal line. The strategy combines the idea of double moving averages to capture the turning points of medium-term trends in stock prices, belonging to a typical trailing stop loss strategy.
Strategy Principle
The strategy first calculates the fast moving average line fastMA and the slow moving average line slowMA. The fast moving average parameter is 12 days, and the slow moving average parameter is 26 days. Then calculate the difference between the two moving average lines to form the MACD. Then calculate the 9-day moving average of the MACD to get the signal line. Trading signals are generated when the MACD crosses above or below the signal line.
The advantage of the strategy is to capture the turning point of the medium-term trend of stock prices. The combination of fast and slow moving averages filters out short-term price fluctuations and noise, and can capture medium-term price trends. When the stock price undergoes a medium-term reversal, the MACD will break through the signal line and generate relatively clear trading signals.
Advantage Analysis
The MACD Crossover with Signal strategy combines the idea of double moving averages to filter out short-term noise and only capture the turning points of long and medium-term trends. Compared with a single price indicator, it can generate fewer false signals.
MACD itself is more sensitive and can respond sensitively to price trend changes. The addition of the signal line can filter out more short-term false signals. Only when the medium-term trend changes significantly, the MACD breaks through the signal line up and down, will a signal be generated.
In a sustainable uptrend, the MACD maintains above the signal line most of the time, which can capture multiple opportunities along the way. Similarly, in a sustained downtrend, the MACD can also maintain a long/short pattern and give short signals in a timely manner.
Risk Analysis
Since the strategy buy and sell signals rely entirely on the crossover of the moving averages, if the market fluctuates greatly, more false signals will be generated, resulting in frequent stop loss. The actual profit and loss of the strategy may not meet expectations.
Breaking through the signal line does not necessarily ensure that the medium-term trend has changed. Relying solely on a single technical indicator as a buy signal has a certain blindness, and the timing may not be accurate enough.
In the ever-changing market, using the crossover of double moving averages alone as the threshold may miss more trading opportunities. In more complex strong trends, this strategy will also lag significantly.
Optimization Directions
Add liquidity and volatility filtering indicators to reduce opening frequency and avoid ineffective trading. Such as adding trading volume, dynamically adjusting moving average parameters, etc.
Combine multiple other technical indicators to form an indicator portfolio to improve signal quality. The combination of short-term and medium and long-term indicators can more comprehensively judge the market structure.
Add machine learning algorithms to train parameters and attention thresholds that are more suitable for the current market environment, reducing human intervention.
Combine VIX and other fear indices to predict market trends and volatility, and dynamically adjust parameters to better take advantage of MACD opportunities.
Conclusion
The MACD Crossover with Signal strategy uses the principle of double moving average crossover to generate trading signals. Drawing the price graph by the difference between fast and slow moving averages, medium-term price trend changes will have obvious characteristics. The addition of the signal line also effectively filters out some noisy signals. The strategy has some advantages in capturing relatively clear medium-term trend reversals. However, the crossover of MACD and signal line cannot fully determine the fundamental change in market structure, and trading signals need to be treated with caution. It is recommended to use in combination with other technical indicators, and machine learning optimization can also be considered.
Parameters
| Name | Default | What it controls |
|---|---|---|
| v_input_1 | true | Use Current Chart Resolution? |
| v_input_2 | 60 | Use Different Timeframe? Uncheck Box Above |
| v_input_3 | true | Show MacD & Signal Line? Also Turn Off Dots Below |
| v_input_4 | true | Show Dots When MacD Crosses Signal Line? |
| v_input_5 | true | Show Histogram? |
| v_input_6 | true | Change MacD Line Color-Signal Line Cross? |
| v_input_7 | true | MacD Histogram 4 Colors? |
| v_input_8 | 12 | fastLength |
| v_input_9 | 26 | slowLength |
| v_input_10 | 9 | signalLength |
Source Pine Script
/*backtest
start: 2022-12-06 00:00:00
end: 2023-12-12 00:00:00
period: 1d
basePeriod: 1h
exchanges: [{"eid":"Futures_Binance","currency":"BTC_USDT"}]
*/

//@author : SudeepBisht
//@version=2
strategy(title="MACD with Signal", shorttitle="MACD_with_Signal")
source = close
useCurrentRes = input(true, title="Use Current Chart Resolution?")
resCustom = input(title="Use Different Timeframe? Uncheck Box Above", defval="60")
smd = input(true, title="Show MacD & Signal Line? Also Turn Off Dots Below")
sd = input(true, title="Show Dots When MacD Crosses Signal Line?")
sh = input(true, title="Show Histogram?")
macd_colorChange = input(true,title="Change MacD Line Color-Signal Line Cross?")
hist_colorChange = input(true,title="MacD Histogram 4 Colors?")

res = useCurrentRes ? timeframe.period : resCustom

fastLength = input(12, minval=1), slowLength=input(26,minval=1)
signalLength=input(9,minval=1)

fastMA = ema(source, fastLength)
slowMA = ema(source, slowLength)

macd = fastMA - slowMA
signal = sma(macd, signalLength)
hist = macd - signal

outMacD = request.security(syminfo.tickerid, res, macd)
outSignal = request.security(syminfo.tickerid, res, signal)
outHist = request.security(syminfo.tickerid, res, hist)

histA_IsUp = outHist > outHist[1] and outHist > 0
histA_IsDown = outHist < outHist[1] and outHist > 0
histB_IsDown = outHist < outHist[1] and outHist <= 0
histB_IsUp = outHist > outHist[1] and outHist <= 0

//MacD Color Definitions
macd_IsAbove = outMacD >= outSignal
macd_IsBelow = outMacD < outSignal

plot_color = hist_colorChange ? histA_IsUp ? green : histA_IsDown ? lime : histB_IsDown ? red : histB_IsUp ? maroon :yellow :gray
macd_color = macd_colorChange ? macd_IsAbove ? green : red : red
signal_color = macd_colorChange ? macd_IsAbove ? yellow : yellow : lime

circleYPosition = outSignal

plot(smd and outMacD ? outMacD : na, title="MACD", color=macd_color, linewidth=3)
plot(smd and outSignal ? outSignal : na, title="Signal", color=blue, style=line ,linewidth=1)
plot(sh and outHist ? outHist : na, title="", color=plot_color, style=columns, linewidth=4)
//plot(sd and cross(outMacD, outSignal) ? circleYPosition : na, title="Cross", style=circles, linewidth=4, color=macd_color)
hline(0, '0 Line',  linewidth=2, color=white)

macd_chk=smd and outMacD ? outMacD : na
checker=smd and outSignal ? outSignal : na
if (crossover(macd_chk,checker))
    strategy.entry("BBandLE", strategy.long)

if (crossunder(macd_chk, checker))
    strategy.entry("BBandSE", strategy.short)
Published by ChaoZhang on the FMZ strategy square · last modified 2023-12-13. Collected in the Quant Trading Vault. Unvalidated research: re-test with your own data and costs before trusting it.
Build this with AgenKit
A spec is not a trading system. Paste this into your coding agent and AgenKit runs a specialist team — architecture, test-first build, risk gates, review — with paper trading on by default.
/agenkit build a production-grade trading bot with a backtest engine, risk controls and paper trading by default from strategies/MACD-Crossover-with-Signal-Strategy.md- npx agenkit install engineering-kit in your project
- Paste the command into your agent and approve each phase
- Get tests, backtest, risk controls and a paper-trading switch
Understand it first
Before you run this, read the lesson behind the idea and how to backtest it honestly. Specs like this one are the survivors of an unknown number of trials; deflate their results accordingly.
Related specs
- Bollinger Bands and RSI Trend Following StrategyPine Script · Trend following · 1h
- Dual ATR Channel Trend Following StrategyPine Script · Trend following · 15m
- Dual MA Crossover Trend Tracking StrategyPine Script · Trend following · 1h
- Dynamic Dual EMA Crossover Strategy with Adaptive Profit Loss ControlPine Script · Trend following · 1d
- EMA SMA Multi Indicator Comprehensive Trend Following StrategyPine Script · Trend following · 1h
- EMA and RSI Trend Trading StrategyPine Script · Trend following · 1d