Strategy vault / Trend following
MACD EMA Crossover Trend Tracking Strategy
This strategy determines the trend direction by calculating the crossover between the MACD indicator and its signal line moving average, and judges the strength of the current trend with the EMA indicator to track…
Overview
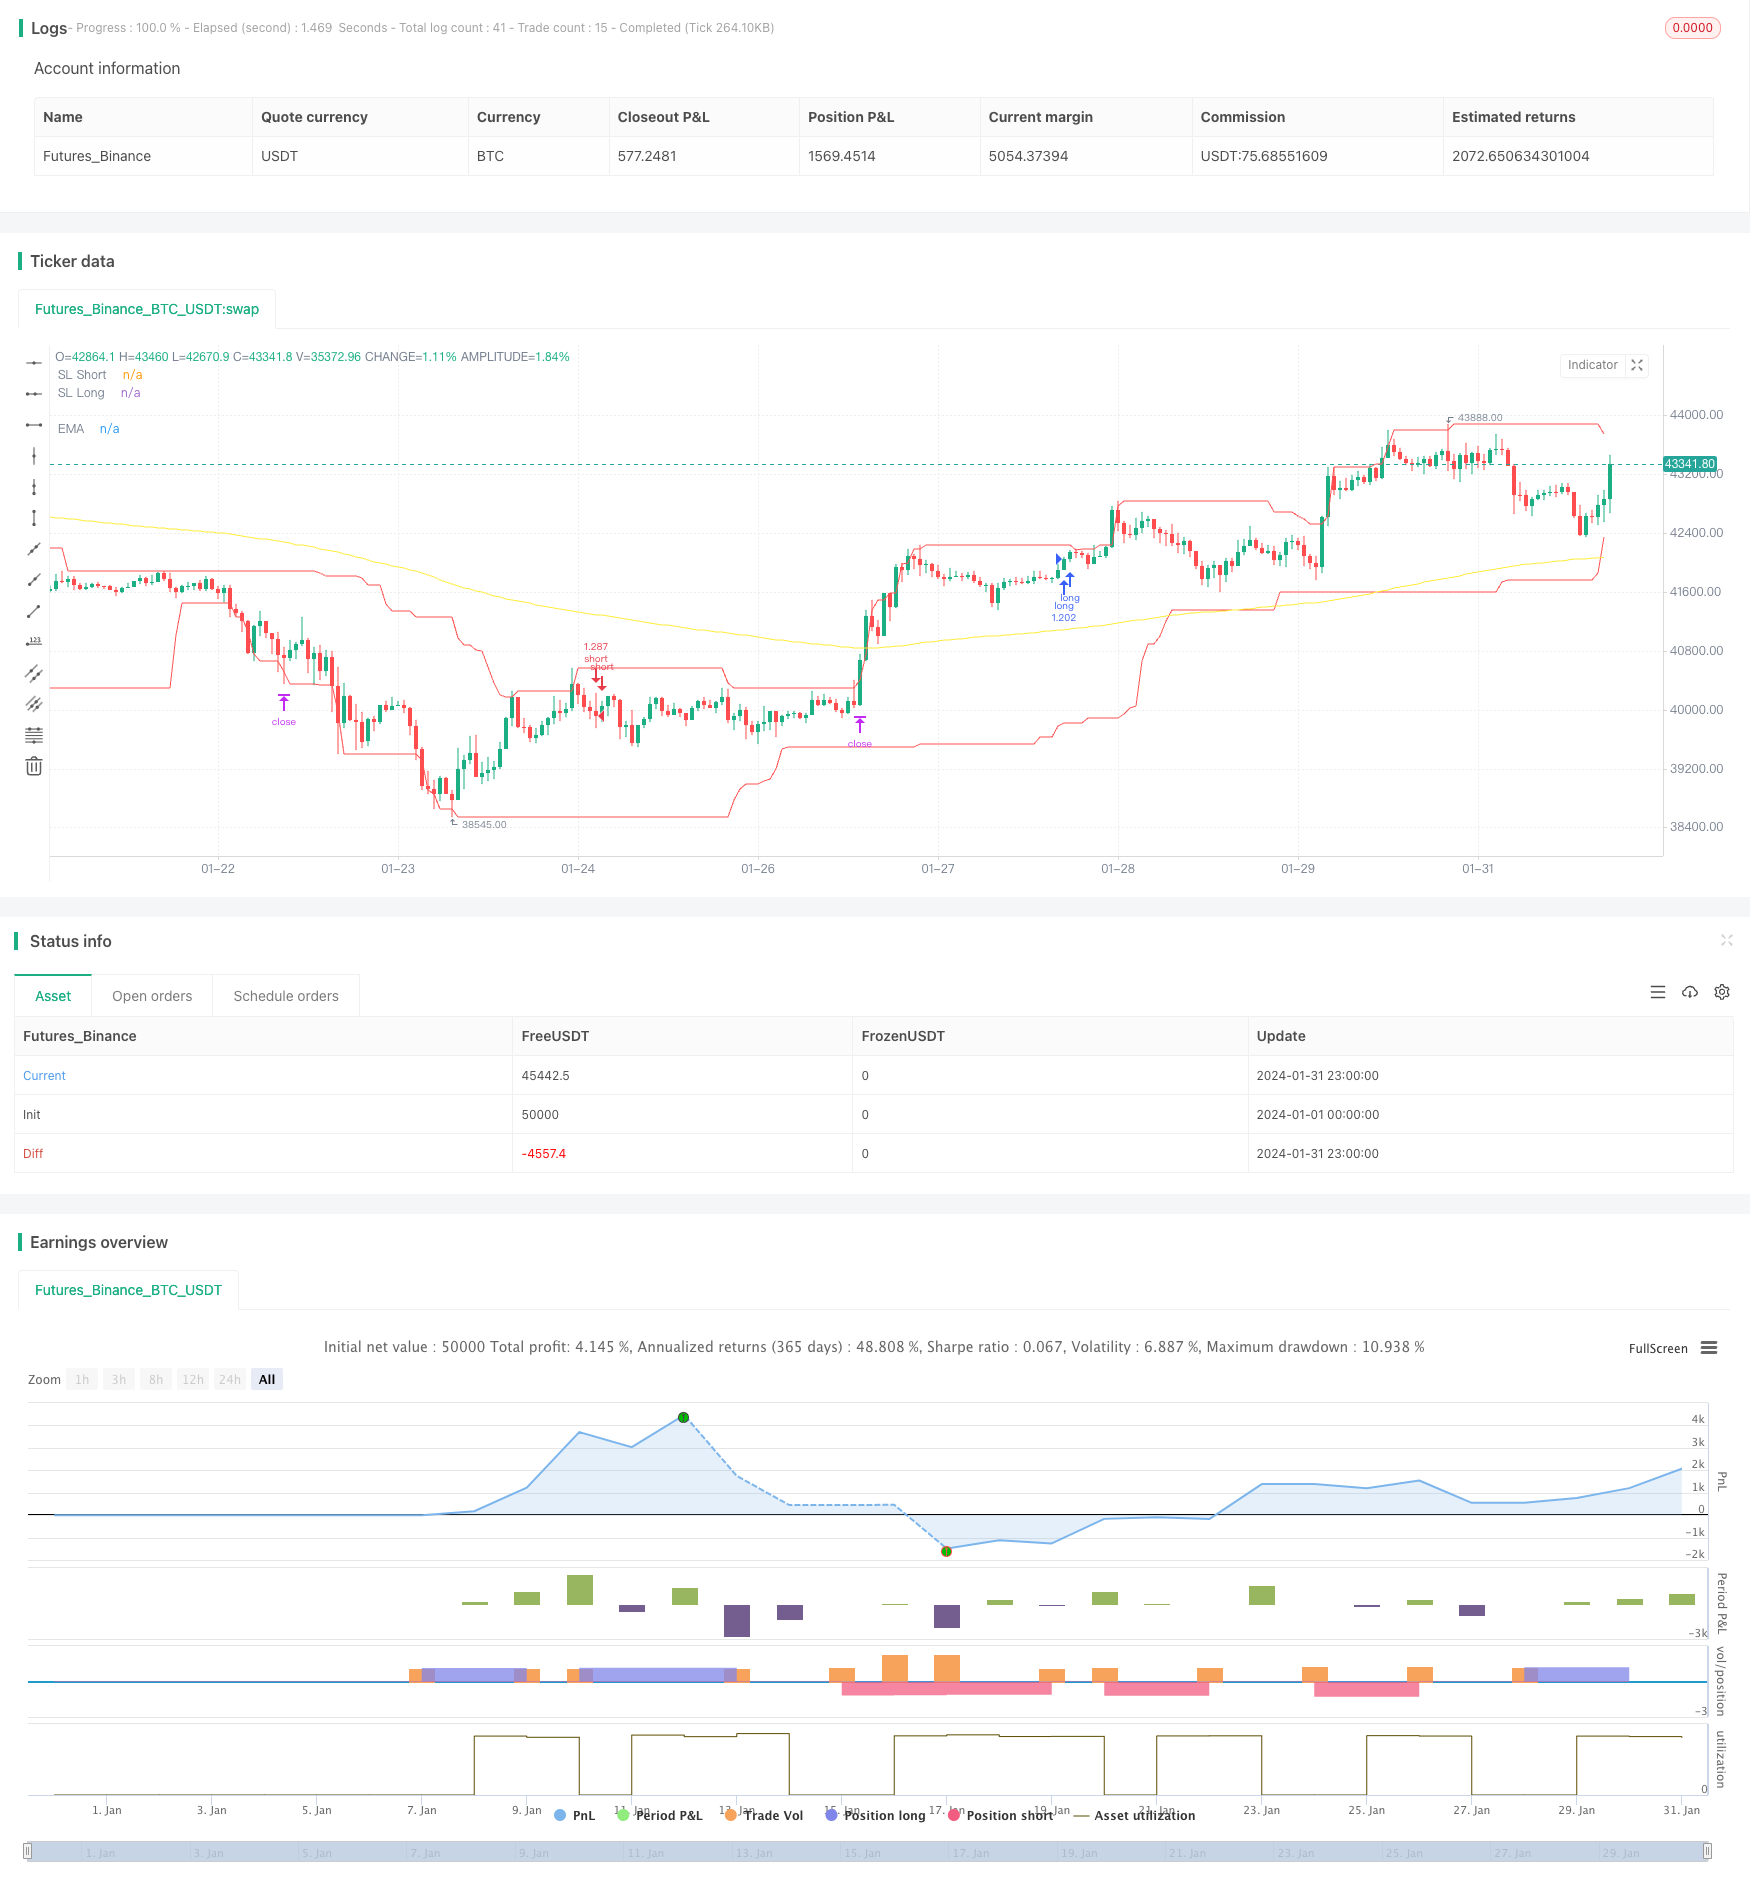
This strategy determines the trend direction by calculating the crossover between the MACD indicator and its signal line moving average, and judges the strength of the current trend with the EMA indicator to track the trend. It goes long when the MACD line breaks through the signal line upward and goes short when breaking through downward. The EMA line can also judge the strength of the trend to filter out false breakouts.
Strategy Logic
The core of this strategy is to determine the trend direction and entry timing based on the MACD indicator. The crossover between the MACD line and the signal line indicates a reversal in the price trend. Therefore, long and short positions are determined according to the breakout direction. Specifically, when the closing price is above the EMA line and the MACD line breaks through the signal line from below, go long; when the closing price is below the EMA line and the MACD line breaks through the signal line from above, go short.
The EMA line serves to assist in judging the trend. If the price is above the EMA line, it indicates an upward trend. At this time, a breakthrough from the MACD below is likely to form a golden cross signal. If the price is below the EMA line, it indicates a downward trend. At this time, a breakthrough from above the MACD is likely to form a death cross signal. The EMA length also determines the mid-to-long term degree of the trend judgment.
In this way, we can enter the market in a timely manner when the price begins to reverse to form a new trend, achieving a trend tracking effect.
Advantage Analysis
This strategy combines dual judgment conditions, taking into account both the trend direction of prices and using indicators to determine specific entry timing, avoiding the risk of false breakouts, and enhances the reliability of the strategy. Compared with using the MACD indicator alone, this strategy can more accurately determine the start of a new trend.
The application of the EMA line also enables the strategy to filter out the effects of short-term fluctuations and lock in medium and long term trends to some extent. This is very helpful for developing the effectiveness of the MACD indicator in judging reversal.
In addition, the strategy sets conditions for both long and short, which can be applied to bull and bear kite markets, thus enhancing the adaptability of the strategy.
Risk Analysis
The main risk of this strategy is that the MACD indicator itself has a high probability of misjudging Fakeout signals. At this point, the auxiliary function of the EMA line is needed, but failures can still happen in special market conditions.
In addition, the strategy adopts a profit factor to set stop loss and take profit conditions, which involves some subjectivity. Improper settings may also affect strategy performance.
Finally, the strategy simply sets the position size to 100% of the account's equity without considering the issue of fund management, which also poses some risks in live trading.
Optimization Directions
The main optimization directions for this strategy include:
Increase other indicators for judgment to form multiple indicator combinations to further avoid the probability of MACD generating wrong signals. For example, KDJ and BOLL can be considered.
The EMA line length can be multi-parameter optimized to find the optimal parameters for judging trend direction.
The MACD parameters can also be further optimized to find the most accurate values for determining reversal timing.
Add a capital management module. For example, the profit factor can be used as a dynamic input, and slippage stops can also be set.
Test the effects on different types of contracts, such as cryptocurrencies, index futures, etc. to find the most suitable trading variety.
Conclusion
Overall, this MACD EMA Crossover Trend Tracking strategy is relatively simple and practical. It ensures signal reliability through dual indicator conditions and locks in profits through reasonable stop loss and take profit methods. The main optimization space lies in parameter selection, indicator combinations, capital management, etc. With further optimization and testing, it is believed that this strategy can become one of the most efficient trend tracking strategies.
Parameters
| Name | Default | What it controls |
|---|---|---|
| v_input_1 | true | FromMonth |
| v_input_2 | true | FromDay |
| v_input_3 | 2020 | FromYear |
| v_input_4 | true | ToMonth |
| v_input_5 | true | ToDay |
| v_input_6 | 9999 | ToYear |
| v_input_7 | 15 | EMA Timeframe |
| v_input_8 | 206 | EMA Length |
| v_input_9 | 15 | Fast Length |
| v_input_10 | 24 | Slow Length |
| v_input_11_close | 0 | Source: close | high | low | open | hl2 | hlc3 | hlcc4 | ohlc4 |
| v_input_12 | 9 | Signal Smoothing |
| v_input_13 | true | Simple MA (Oscillator) |
| v_input_14 | true | Simple MA (Signal Line) |
| v_input_15 | true | Enable long? |
| v_input_16 | true | Enable short? |
| v_input_17 | 1.9 | ProfitfactorLong |
| v_input_18 | 46 | Lowest Low Lookback |
| v_input_19 | 2.1 | ProfitfactorShort |
| v_input_20 | 25 | highest high lookback |
Source Pine Script
/*backtest
start: 2024-01-01 00:00:00
end: 2024-01-31 23:59:59
period: 1h
basePeriod: 15m
exchanges: [{"eid":"Futures_Binance","currency":"BTC_USDT"}]
*/

//@version=4

strategy(title="MACD EMA Strategy", shorttitle="MACD EMA STRAT", overlay = true, pyramiding = 0, max_bars_back=3000, calc_on_order_fills = false, commission_type =  strategy.commission.percent, commission_value = 0, default_qty_type = strategy.percent_of_equity, default_qty_value = 100, initial_capital=5000, currency=currency.USD)

// Time Range
FromMonth=input(defval=1,title="FromMonth",minval=1,maxval=12)
FromDay=input(defval=1,title="FromDay",minval=1,maxval=31)
FromYear=input(defval=2020,title="FromYear",minval=2016)
ToMonth=input(defval=1,title="ToMonth",minval=1,maxval=12)
ToDay=input(defval=1,title="ToDay",minval=1,maxval=31)
ToYear=input(defval=9999,title="ToYear",minval=2017)
start=timestamp(FromYear,FromMonth,FromDay,00,00)
finish=timestamp(ToYear,ToMonth,ToDay,23,59)
window()=>true

// STEP 2:
// See if this bar's time happened on/after start date
afterStartDate = true

//EMA
emasrc = close
res = input(title="EMA Timeframe", type=input.resolution, defval="15")
len1 = input(title="EMA Length", type=input.integer, defval=206)
col1 = color.yellow
// Calculate EMA
ema1 = ema(emasrc, len1)
emaSmooth = security(syminfo.tickerid, res, ema1, barmerge.gaps_on, barmerge.lookahead_off)
// Draw EMA
plot(emaSmooth, title="EMA", linewidth=1, color=col1)

//MACD
fast_length = input(title="Fast Length", type=input.integer, defval=15)
slow_length = input(title="Slow Length", type=input.integer, defval=24)
src = input(title="Source", type=input.source, defval=close)
signal_length = input(title="Signal Smoothing", type=input.integer, minval = 1, maxval = 50, defval = 9)
sma_source = input(title="Simple MA (Oscillator)", type=input.bool, defval=true)
sma_signal = input(title="Simple MA (Signal Line)", type=input.bool, defval=true)
zeroline = 0

// Plot colors
col_grow_above = #26A69A
col_grow_below = #FFCDD2
col_fall_above = #B2DFDB
col_fall_below = #EF5350
col_macd = #0094ff
col_signal = #ff6a00

// Calculating
fast_ma = sma_source ? sma(src, fast_length) : ema(src, fast_length)
slow_ma = sma_source ? sma(src, slow_length) : ema(src, slow_length)
macd = fast_ma - slow_ma
signal = sma_signal ? sma(macd, signal_length) : ema(macd, signal_length)
hist = macd - signal
//plot(hist, title="Histogram", style=plot.style_columns, color=(hist>=0 ? (hist[1] < hist ? col_grow_above : col_fall_above) : (hist[1] < hist ? col_grow_below : col_fall_below) ), transp=0 )
//plot(macd, title="MACD", color=col_macd, transp=0)
//plot(signal, title="Signal", color=col_signal, transp=0)
//plot(zeroline, title="Zero Line", color=color.black, transp=0)

///////////////////////////LONG////////////////////////////////////////////////////////////////////

enablelong = input(true, title="Enable long?")

//Long Signal
upcondition = close > emaSmooth and close[1] > emaSmooth[1]
macdunderhis = macd < zeroline
macdcrossup = crossover(macd, signal)

longcondition = upcondition and macdunderhis and macdcrossup

//strategy buy long
if (longcondition) and (afterStartDate) and strategy.opentrades < 1 and (enablelong == true)
    strategy.entry("long", strategy.long)

//////////////////////////////////////SHORT//////////////////////////////////////////////////////////////////////////////////

enableshort = input(true, title="Enable short?")

//Short Signal
downcondition = close < emaSmooth and close[1] < emaSmooth[1]
macdoverhis = macd > zeroline
macdcrosunder = crossunder(macd, signal)

shortcondition = downcondition and macdoverhis and macdcrosunder

//strategy buy short
if (shortcondition) and (afterStartDate) and strategy.opentrades < 1 and (enableshort == true)
    strategy.entry("short", strategy.short)


//////////////////////////////////////EXIT CONDITION//////////////////////////////////////////////////////////////////////////////////
bought = strategy.position_size[1] < strategy.position_size
sold = strategy.position_size[1] > strategy.position_size
barsbought = barssince(bought)
barssold = barssince(sold)
//////LOWEST LOW//////
//Lowest Low LONG
profitfactorlong = input(title="ProfitfactorLong", type=input.float, step=0.1, defval=1.9)
loLen = input(title="Lowest Low Lookback", type=input.integer,
  defval=46, minval=2)
stop_level_long = lowest(low, loLen)[1]

if strategy.position_size>0
    profit_level_long = strategy.position_avg_price + ((strategy.position_avg_price - stop_level_long[barsbought])*profitfactorlong)
    strategy.exit(id="TP/ SL", stop=stop_level_long[barsbought], limit=profit_level_long)

//Lowest Low SHORT
profitfactorshort = input(title="ProfitfactorShort", type=input.float, step=0.1, defval=2.1)
highLen = input(title="highest high lookback", type=input.integer,
  defval=25, minval=2)
stop_level_short = highest(high, highLen)[1]

if strategy.position_size<0
    profit_level_short = strategy.position_avg_price - ((stop_level_short[barssold] - strategy.position_avg_price)*profitfactorshort)
    strategy.exit(id="TP/ SL", stop=stop_level_short[barssold], limit=profit_level_short)

//PLOTT TP SL
plot(stop_level_long, title="SL Long", linewidth=1, color=color.red)
plot(stop_level_short, title="SL Short", linewidth=1, color=color.red)Published by ChaoZhang on the FMZ strategy square · last modified 2024-02-18. Collected in the Quant Trading Vault. Unvalidated research: re-test with your own data and costs before trusting it.
Build this with AgenKit
A spec is not a trading system. Paste this into your coding agent and AgenKit runs a specialist team — architecture, test-first build, risk gates, review — with paper trading on by default.
/agenkit build a production-grade trading bot with a backtest engine, risk controls and paper trading by default from strategies/MACD-EMA-Crossover-Trend-Tracking-Strategy.md- npx agenkit install engineering-kit in your project
- Paste the command into your agent and approve each phase
- Get tests, backtest, risk controls and a paper-trading switch
Understand it first
Before you run this, read the lesson behind the idea and how to backtest it honestly. Specs like this one are the survivors of an unknown number of trials; deflate their results accordingly.
Related specs
- Bollinger Bands and RSI Trend Following StrategyPine Script · Trend following · 1h
- Dual ATR Channel Trend Following StrategyPine Script · Trend following · 15m
- Dual MA Crossover Trend Tracking StrategyPine Script · Trend following · 1h
- Dynamic Dual EMA Crossover Strategy with Adaptive Profit Loss ControlPine Script · Trend following · 1d
- EMA SMA Multi Indicator Comprehensive Trend Following StrategyPine Script · Trend following · 1h
- EMA and RSI Trend Trading StrategyPine Script · Trend following · 1d