Strategy vault / Trend following
MACD Trend Following Intraday Strategy
The MACD Trend Following Intraday Strategy is an intraday trading strategy that combines moving averages, the MACD indicator and the Williams Indicator. It utilizes different combinations of the three indicators to…
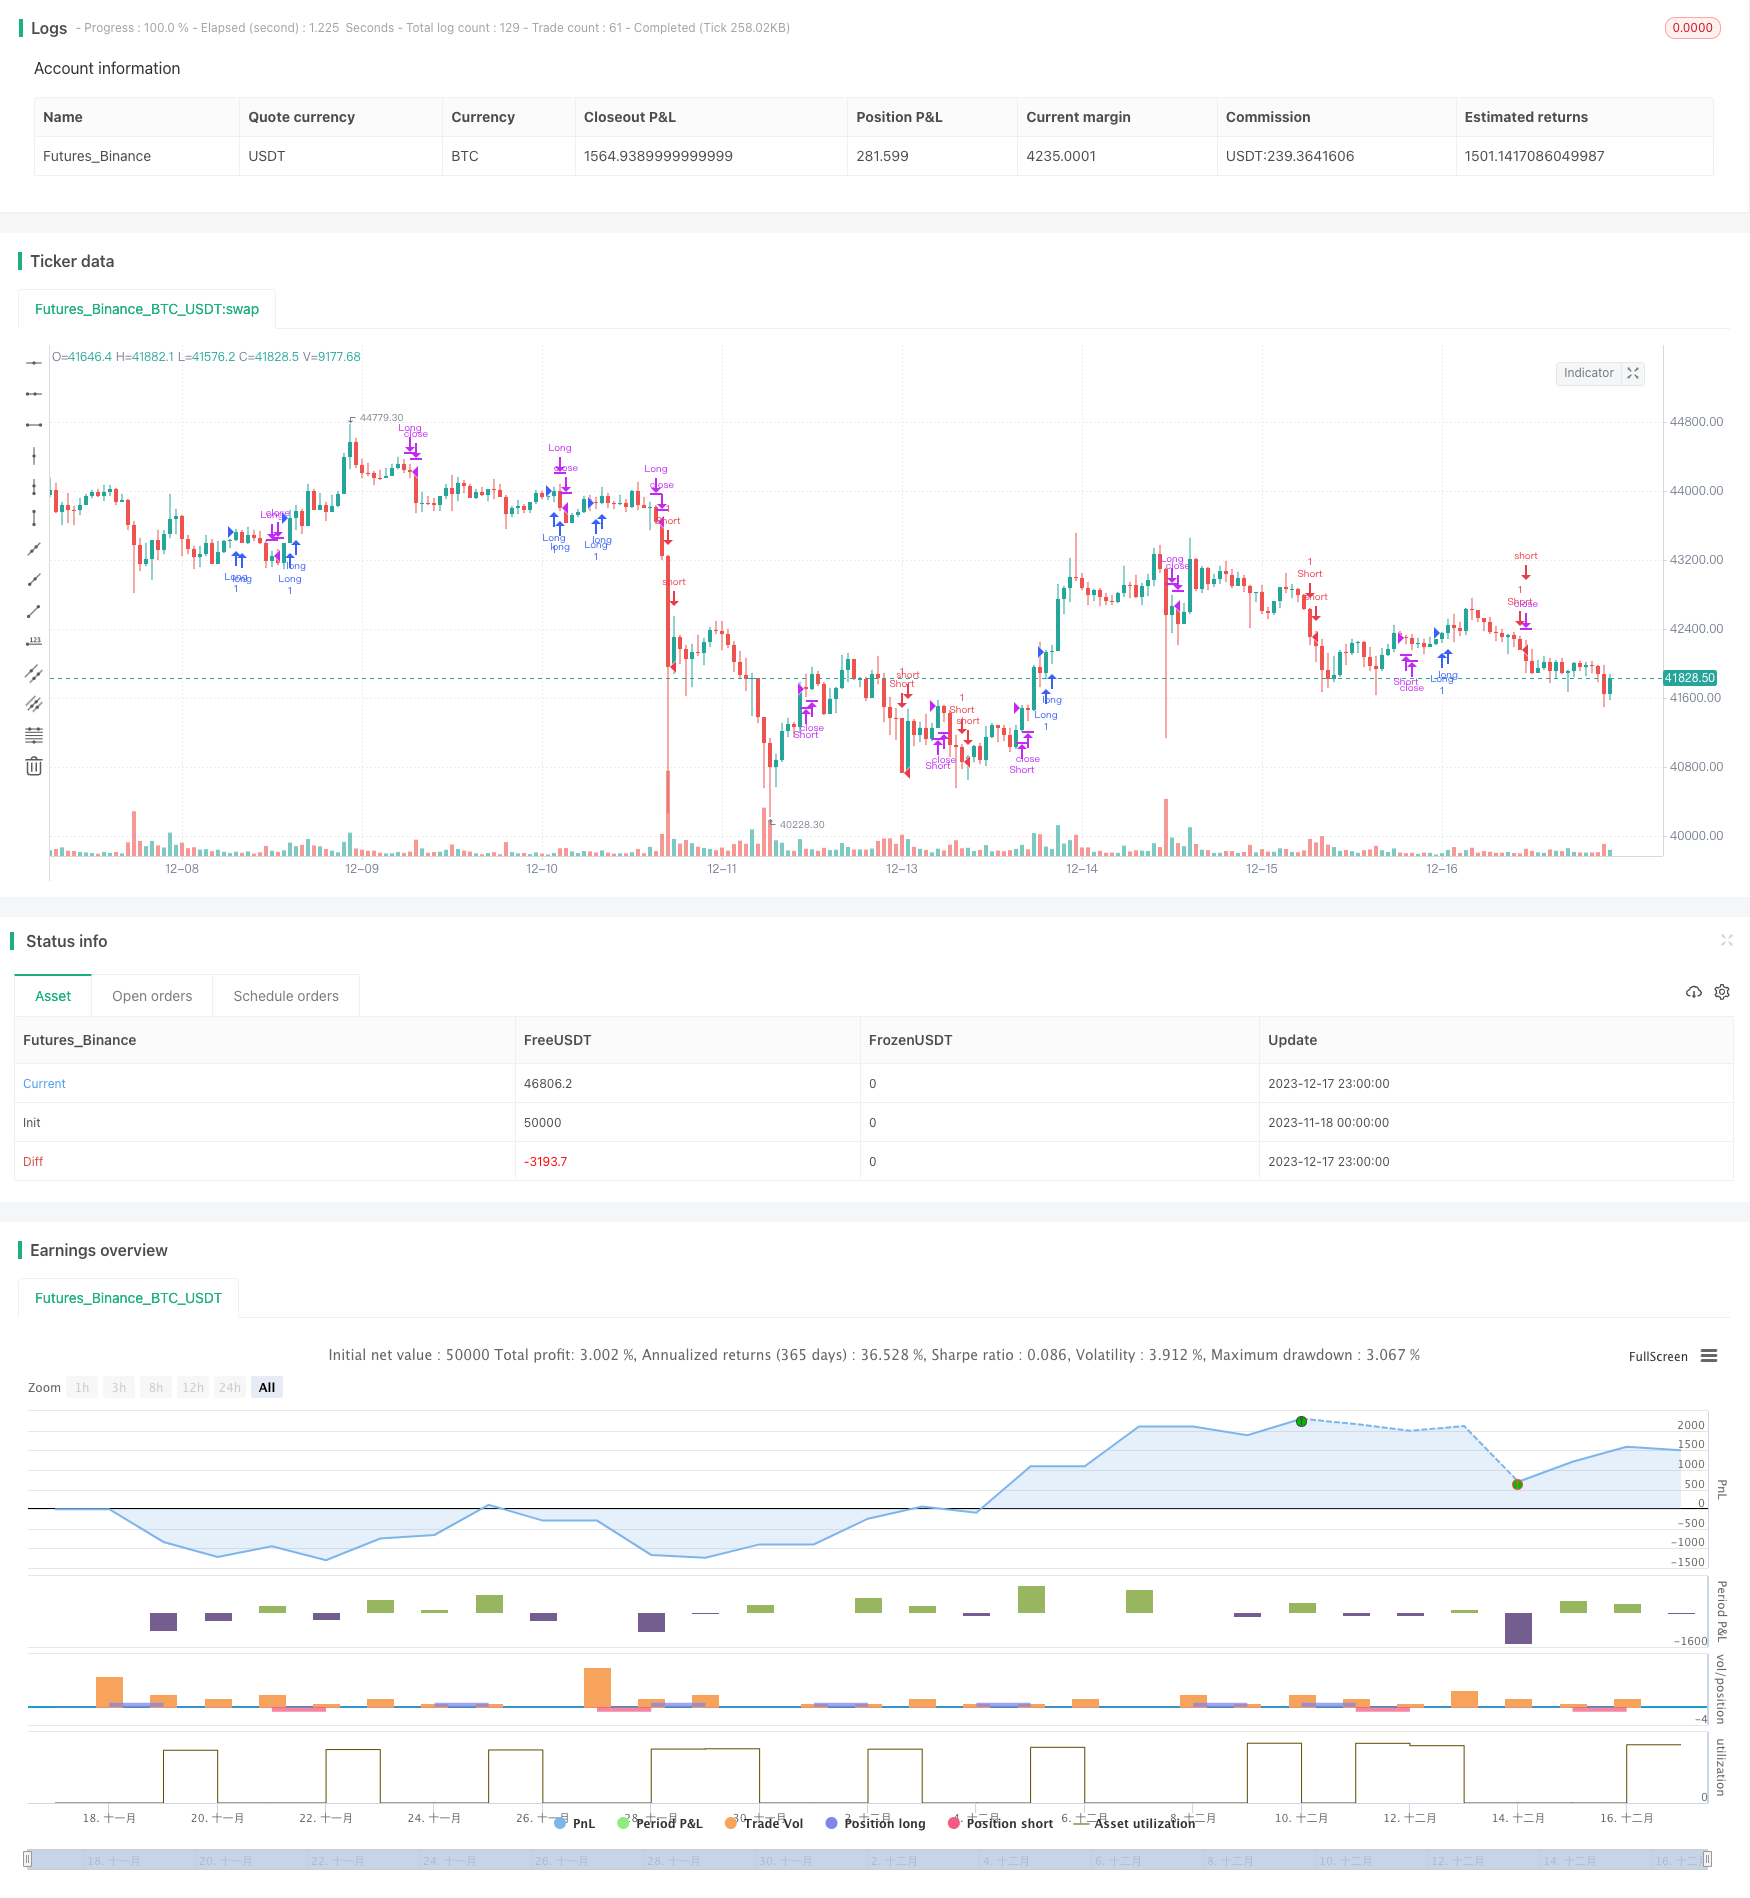
Overview
The MACD Trend Following Intraday Strategy is an intraday trading strategy that combines moving averages, the MACD indicator and the Williams Indicator. It utilizes different combinations of the three indicators to form entry and exit criteria for long and short positions, aiming to capture the trending characteristics of short-term price movements.
Strategy Logic
The key trading logic of this strategy is based on several aspects:
Go long when price breaks above the Exponential Moving Average (EMA) line, and go short when it breaks below;
Go long when the MACD fast line is above the slow line, and go short when below;
Go long when William Indicator's fast MA line is above the slow MA line, and vice versa;
Use the combinations of these 3 scenarios as entry conditions;
Exit on reversal signals.
By combining EMA for overall trend direction and MACD for short-term momentum, this strategy can capture price trend moves at decent entry points for profits. Williams Indicator further helps avoid false breakouts by gauging overbought/oversold levels.
Advantages
This multi-indicator combo structure makes a typical short-term trend following strategy, with main edges like:
Triple cross verification to reduce false signals;
EMA for main trend, MACD for short-term momentum;
Williams Indicator avoids chasing tops or bottom fishing during volatile moves;
Reversal combo ensures risk control aligns with exits.
Risks
There are also major risks to note for this strategy:
The complex structure makes parameter tuning challenging;
Frequent short-term trades may lead to higher transaction costs;
Failure to detect true trend reversal points may result in losses.
The main mitigations are parameter optimization and stop loss to maximize profit combos and control max single trade loss.
Enhancement Opportunities
Main aspects to enhance the strategy:
Test more parameter combinations for optimum set;
Add more data feeds like volume for entry validation;
Employ dynamic or trailing stop loss to strengthen risk control;
Incorporate machine learning for detecting true reversals.
Conclusion
This MACD trend following intraday strategy effectively combines indicators for identifying short-term trends and managing risks. Further improvements on tuning parameters, setting stop loss levels and incorporating more data feeds can lift strategy win rate and profitability. The concepts are worth researching for strategy advancement.
Parameters
| Name | Default | What it controls |
|---|---|---|
| v_input_3_close | 0 | Source: close | high | low | open | hl2 | hlc3 | hlcc4 | ohlc4 |
| v_input_4 | 50 | Volume MA Period |
| v_input_5 | 12 | Fast Length |
| v_input_6 | 26 | Slow Length |
| v_input_int_7 | 9 | Signal Smoothing |
| v_input_string_1 | 0 | Oscillator MA Type: EMA | SMA |
| v_input_string_2 | 0 | Signal Line MA Type: EMA | SMA |
| v_input_int_8 | 34 | w_length |
| v_input_13 | 5 | Smoothed %R Length |
| v_input_14 | 13 | Slow EMA Length |
| v_input_1 | 2011 | (?Trading window)Start Year |
| v_input_int_1 | true | Start Month |
| v_input_int_2 | true | Start Day |
| v_input_2 | 2050 | Finish Year |
| v_input_int_3 | 12 | Finish Month |
| v_input_int_4 | 31 | Finish Day |
| v_input_float_1 | true | (?Trading Options)Leverage (if applicable) |
| v_input_bool_1 | false | Reinvest profit |
| v_input_float_2 | 20 | Reinvest percentage |
| v_input_int_5 | 14 | (?Daily ATR)ATR period |
| v_input_float_3 | 5 | % ATR to use for SL / PT |
| v_input_float_4 | 20 | (?VIX Volatility Index)VIX Threshold for entry |
| v_input_int_6 | 200 | (?Moving Averages)EMA |
| v_input_7 | #2962FF | (?Color Settings)MACD Line |
| v_input_8 | #FF6D00 | Signal Line |
| v_input_9 | #26A69A | (?Histogram)Above Grow |
| v_input_10 | #B2DFDB | Fall |
| v_input_11 | #FFCDD2 | Below Grow |
| v_input_12 | #FF5252 | Fall |
Source Pine Script
/*backtest
start: 2023-11-18 00:00:00
end: 2023-12-18 00:00:00
period: 1h
basePeriod: 15m
exchanges: [{"eid":"Futures_Binance","currency":"BTC_USDT"}]
*/

// This source code is subject to the terms of the Mozilla Public License 2.0 at https://mozilla.org/MPL/2.0/
// © platsn

//@version=5
strategy("MACD Willy Strategy", overlay=true, pyramiding=1, initial_capital=10000)

// ******************** Trade Period **************************************
startY = input(title='Start Year', defval=2011, group = "Trading window")
startM = input.int(title='Start Month', defval=1, minval=1, maxval=12, group = "Trading window")
startD = input.int(title='Start Day', defval=1, minval=1, maxval=31, group = "Trading window")
finishY = input(title='Finish Year', defval=2050, group = "Trading window")
finishM = input.int(title='Finish Month', defval=12, minval=1, maxval=12, group = "Trading window")
finishD = input.int(title='Finish Day', defval=31, minval=1, maxval=31, group = "Trading window")
timestart = timestamp(startY, startM, startD, 00, 00)
timefinish = timestamp(finishY, finishM, finishD, 23, 59)
// t1 = time(timeframe.period, "0945-1545:23456")
// window = time >= timestart and time <= timefinish and t1 ? true : false
// t2 = time(timeframe.period, "0930-1555:23456")
// window2 = time >= timestart and time <= timefinish and t2 ? true : false

leverage = input.float(1, title="Leverage (if applicable)", step=0.1, group = "Trading Options")
reinvest = input.bool(defval=false,title="Reinvest profit", group = "Trading Options")
reinvest_percent = input.float(defval=20, title = "Reinvest percentage", group="Trading Options")
// entry_lookback = input.int(defval=10, title="Lookback period for entry condition", group = "Trading Options")

// -------------------------------------------- Data Source --------------------------------------------

src = input(title="Source", defval=close)

// ***************************************************************************************************** Daily ATR *****************************************************
atrlen = input.int(14, minval=1, title="ATR period", group = "Daily ATR")
iPercent = input.float(5, minval=1, maxval=100, step=0.1, title="% ATR to use for SL / PT", group = "Daily ATR")

percentage = iPercent * 0.01
datr = request.security(syminfo.tickerid, "1D", ta.rma(ta.tr, atrlen))
datrp = datr * percentage

// plot(datr,"Daily ATR")
// plot(datrp, "Daily % ATR")

//*********************************************************** VIX volatility index ****************************************

VIX = request.security("BTC_USDT:swap", timeframe.period, close)
vix_thres = input.float(20.0, "VIX Threshold for entry", step=0.5, group="VIX Volatility Index")

// ************************************************ Volume ******************************************************

vol_len = input(50, 'Volume MA Period')
avg_vol = ta.sma(volume, vol_len)

//-------------------------------------------------------- Moving Average ------------------------------------

emalen1 = input.int(200, minval=1, title='EMA', group= "Moving Averages")
ema1 = ta.ema(src, emalen1)

// ------------------------------------------ MACD ------------------------------------------
// Getting inputs
fast_length = input(title="Fast Length", defval=12)
slow_length = input(title="Slow Length", defval=26)
signal_length = input.int(title="Signal Smoothing",  minval = 1, maxval = 50, defval = 9)
sma_source = input.string(title="Oscillator MA Type",  defval="EMA", options=["SMA", "EMA"])
sma_signal = input.string(title="Signal Line MA Type", defval="EMA", options=["SMA", "EMA"])
// Plot colors
col_macd = input(#2962FF, "MACD Line  ", group="Color Settings", inline="MACD")
col_signal = input(#FF6D00, "Signal Line  ", group="Color Settings", inline="Signal")
col_grow_above = input(#26A69A, "Above   Grow", group="Histogram", inline="Above")
col_fall_above = input(#B2DFDB, "Fall", group="Histogram", inline="Above")
col_grow_below = input(#FFCDD2, "Below Grow", group="Histogram", inline="Below")
col_fall_below = input(#FF5252, "Fall", group="Histogram", inline="Below")
// Calculating
fast_ma = sma_source == "SMA" ? ta.sma(src, fast_length) : ta.ema(src, fast_length)
slow_ma = sma_source == "SMA" ? ta.sma(src, slow_length) : ta.ema(src, slow_length)
macd = fast_ma - slow_ma
signal = sma_signal == "SMA" ? ta.sma(macd, signal_length) : ta.ema(macd, signal_length)
hist = macd - signal

// ---------------------------------------- William %R --------------------------------------
w_length = input.int(defval=34, minval=1)
w_upper = ta.highest(w_length)
w_lower = ta.lowest(w_length)

w_output = 100 * (close - w_upper) / (w_upper - w_lower)

fast_period = input(defval=5, title='Smoothed %R Length')
slow_period = input(defval=13, title='Slow EMA Length')

w_fast_ma = ta.wma(w_output,fast_period)
w_slow_ma = ta.ema(w_output,slow_period)


// ------------------------------------------------ Entry Conditions ----------------------------------------

L_entry1 = close > ema1 and hist > 0 and w_fast_ma > w_slow_ma
S_entry1 = close < ema1 and hist < 0 and w_fast_ma < w_slow_ma

// -------------------------------------------------- Entry -----------------------------------------------
strategy.initial_capital = 50000
profit = strategy.netprofit
trade_amount = math.floor(strategy.initial_capital*leverage / close)

if strategy.netprofit > 0 and reinvest
    trade_amount := math.floor((strategy.initial_capital+(profit*reinvest_percent*0.01))*leverage / close)
else
    trade_amount := math.floor(strategy.initial_capital*leverage/ close)


if L_entry1 //and window
    strategy.entry("Long", strategy.long, trade_amount)

if S_entry1 //and window
    strategy.entry("Short", strategy.short, trade_amount)

// --------------------------------------------------- Exit Conditions -------------------------------------

L_exit1 = hist < 0 and w_fast_ma < w_slow_ma and w_fast_ma < -20
S_exit1 = hist > 0 and w_fast_ma > w_slow_ma and w_fast_ma > -80

// ----------------------------------------------------- Exit ---------------------------------------------

if L_exit1 //and window2
    strategy.close("Long")

if S_exit1 //and window2
    strategy.close("Short")

// if time(timeframe.period, "1530-1600:23456")
// strategy.close_all()Published by ChaoZhang on the FMZ strategy square · last modified 2023-12-19. Collected in the Quant Trading Vault. Unvalidated research: re-test with your own data and costs before trusting it.
Build this with AgenKit
A spec is not a trading system. Paste this into your coding agent and AgenKit runs a specialist team — architecture, test-first build, risk gates, review — with paper trading on by default.
/agenkit build a production-grade trading bot with a backtest engine, risk controls and paper trading by default from strategies/MACD-Trend-Following-Intraday-Strategy.md- npx agenkit install engineering-kit in your project
- Paste the command into your agent and approve each phase
- Get tests, backtest, risk controls and a paper-trading switch
Understand it first
Before you run this, read the lesson behind the idea and how to backtest it honestly. Specs like this one are the survivors of an unknown number of trials; deflate their results accordingly.
Related specs
- Bollinger Bands and RSI Trend Following StrategyPine Script · Trend following · 1h
- Dual ATR Channel Trend Following StrategyPine Script · Trend following · 15m
- Dual MA Crossover Trend Tracking StrategyPine Script · Trend following · 1h
- Dynamic Dual EMA Crossover Strategy with Adaptive Profit Loss ControlPine Script · Trend following · 1d
- EMA and RSI Trend Trading StrategyPine Script · Trend following · 1d
- Fixed Range Volume Profile And Anchored VWAP Trend Identification Strategy With Dynamic Stop LossPine Script · Trend following · 1h