Strategy vault / Trend following
Modified Relative Strength Index Trend Following Strategy
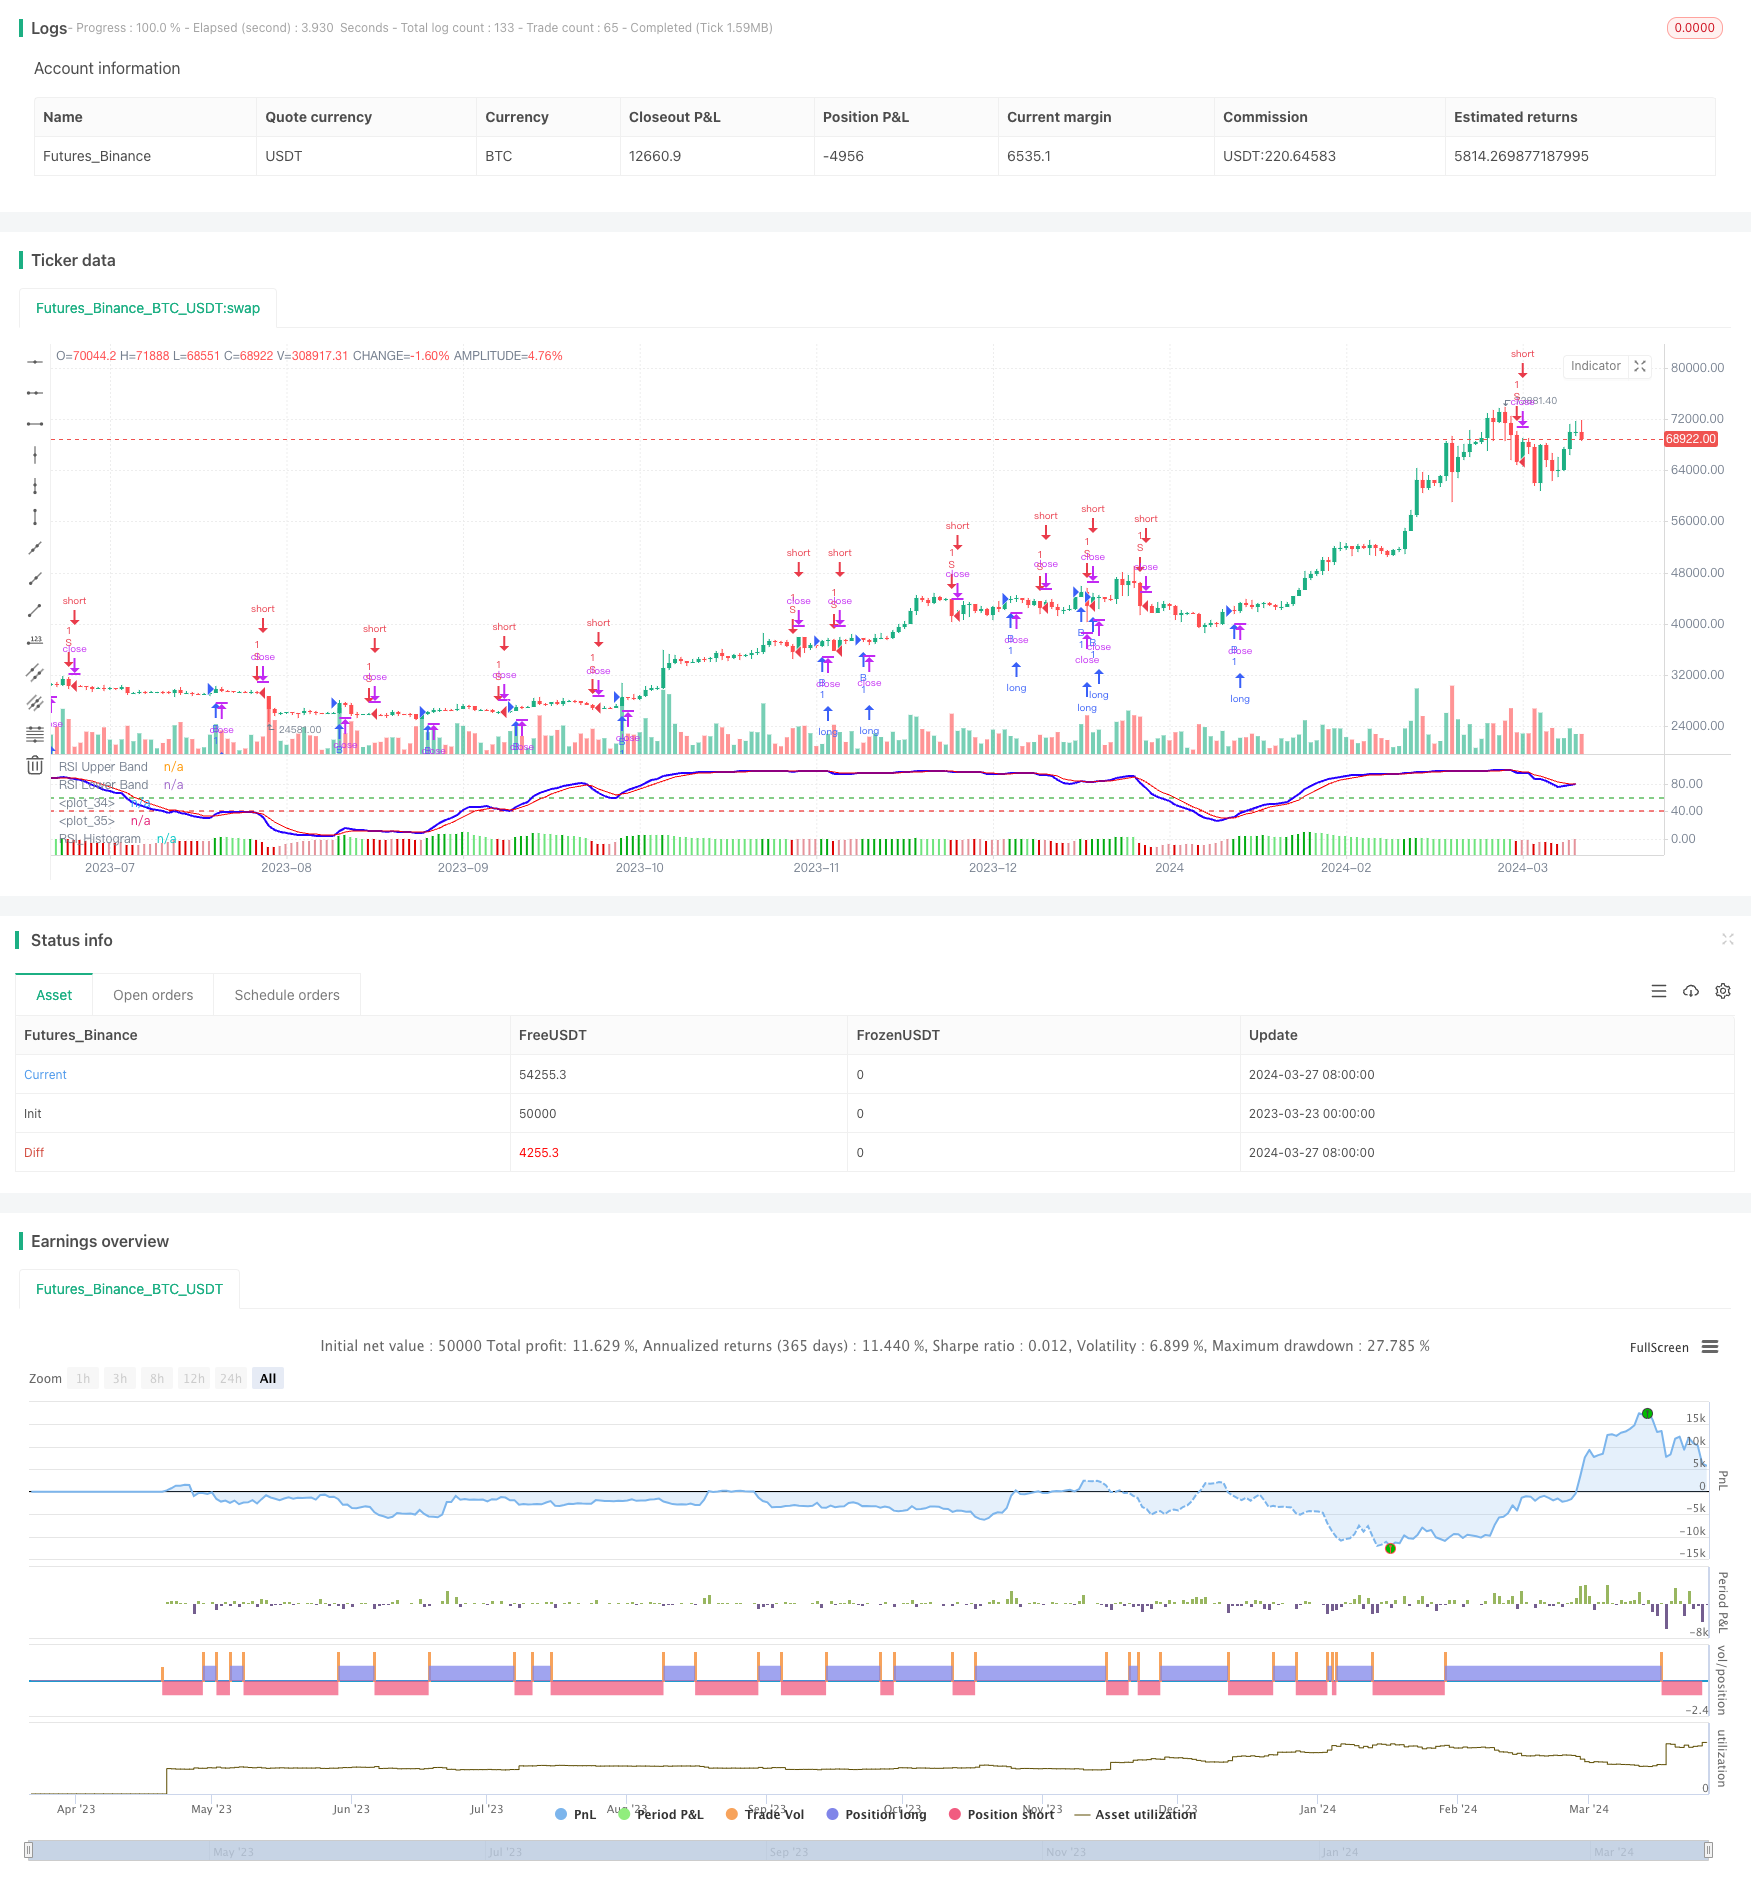
This strategy captures market trends based on the Modified Relative Strength Index (Modified RSI). The main idea of the strategy is to use the crossover signals and histogram signals of the Modified RSI indicator to…
Overview
This strategy captures market trends based on the Modified Relative Strength Index (Modified RSI). The main idea of the strategy is to use the crossover signals and histogram signals of the Modified RSI indicator to determine the market trend and make trades according to the trend direction.
Strategy Principle
- Calculate the EMA of price as the input for Modified RSI
- Calculate the Modified RSI indicator
- Calculate the EMA of Modified RSI as the signal line
- Calculate the difference between Modified RSI and signal line as the histogram
- When Modified RSI crosses above the signal line and the histogram is greater than 0, generate a buy signal
- When Modified RSI crosses below the signal line and the histogram is less than 0, generate a sell signal
Strategy Advantages
- The Modified RSI indicator can better capture trends compared to the traditional RSI indicator
- Combining the crossover signals and histogram signals of Modified RSI can effectively filter out false signals
- Parameters are adjustable and applicable to different markets and timeframes
- The program is concise and computationally efficient
Strategy Risks
- The Modified RSI indicator is prone to generating false signals in range-bound markets
- The capture of trend turning points may have a lag
- A single indicator is easily affected by price noise
Strategy Optimization Directions
- It can be combined with other trend indicators such as moving averages to improve signal reliability
- A stop-loss and take-profit module can be added to control single transaction risk
- Parameters can be optimized based on different market characteristics
- A position management module can be added to dynamically adjust positions
Summary
This strategy utilizes the characteristics of the Modified RSI indicator to build a trading system from the perspective of trend following. The Modified RSI indicator overcomes some of the defects of the traditional RSI indicator and has relatively strong trend capture ability. However, strategies based on a single indicator often have limitations and need to be improved in combination with other technical means. By optimizing strategy parameters, enriching signal sources, adding risk control modules, and other methods, the stability and profitability of this strategy can be further improved.
Parameters
| Name | Default | What it controls |
|---|---|---|
| v_input_int_1 | 13 | Price_EMA |
| v_input_int_2 | 14 | RSI_Period |
| v_input_int_3 | 5 | RSI_Avg_EMA |
| v_input_int_4 | 20 | Fast_EMA |
| v_input_int_5 | 50 | Slow_EMA |
| v_input_source_1_close | 0 | Source: close | high | low | open | hl2 | hlc3 | hlcc4 | ohlc4 |
| v_input_1 | #02ac11 | (?Histogram)Above Grow |
| v_input_2 | #6ee47d | Fall |
| v_input_3 | #e5939b | Below Grow |
| v_input_4 | #dd0000 | Fall |
Source Pine Script
/*backtest
start: 2023-03-23 00:00:00
end: 2024-03-28 00:00:00
period: 1d
basePeriod: 1h
exchanges: [{"eid":"Futures_Binance","currency":"BTC_USDT"}]
*/

// This source code is subject to the terms of the Mozilla Public License 2.0 at https://mozilla.org/MPL/2.0/
// © YogirajDange

//@version=5


// Verical lines


// // Define the times
// t1 = timestamp(year, month, dayofmonth, 09, 15) // 9:15
// t2 = timestamp(year, month, dayofmonth, 11, 15) // 11:15
// t3 = timestamp(year, month, dayofmonth, 13, 15) // 1:15
// t4 = timestamp(year, month, dayofmonth, 15, 25) // 3:25

// // Check if the current bar is on the current day
// is_today = (year(time) == year(timenow)) and (month(time) == month(timenow)) and (dayofmonth(time) == dayofmonth(timenow))

// // Draw a vertical line at each time
// if is_today and (time == t1 or time == t2 or time == t3 or time == t4)
//     line.new(x1 = bar_index, y1 = low, x2 = bar_index, y2 = high, extend = extend.both, color=color.red, width = 1)

strategy('Modified RSI')
col_grow_above = input(#02ac11, "Above   Grow", group="Histogram", inline="Above")
col_fall_above = input(#6ee47d, "Fall", group="Histogram", inline="Above")
col_grow_below = input(#e5939b, "Below Grow", group="Histogram", inline="Below")
col_fall_below = input(#dd0000, "Fall", group="Histogram", inline="Below")
EMA_length = input.int(13, 'Price_EMA', minval=1)
RSI_length = input.int(14, 'RSI_Period', minval=1)
Avg_length = input.int(5, 'RSI_Avg_EMA', minval=1)
fastMA = ta.ema(close, EMA_length)
modrsi = ta.rsi(fastMA, RSI_length)
RSIAVG = ta.ema(modrsi, Avg_length)
plot(modrsi, color=color.rgb(38, 0, 255), linewidth=2)
plot(RSIAVG, color=color.rgb(247, 0, 0))
rsiUpperBand = hline(60, 'RSI Upper Band', color=#099b0e)
//hline(50, "RSI Middle Band", color=color.new(#787B86, 50))
rsiLowerBand = hline(40, 'RSI Lower Band', color=#e90101)

RSI_hist = modrsi - RSIAVG

//plot(RSI_hist,"RSI_Histogram", color = #c201e9, style = plot.style_columns,linewidth= 5)

plot(RSI_hist, title="RSI_Histogram", style=plot.style_columns, color=(RSI_hist>=0 ? (RSI_hist[1] < RSI_hist ? col_grow_above : col_fall_above) : (RSI_hist[1] < RSI_hist ? col_grow_below : col_fall_below)))


/////// Moving Averages 20 50 EMA

fast_ma = input.int(20, minval=2, title="Fast_EMA")
slow_ma = input.int(50, minval=2, title="Slow_EMA")

src = input.source(close, title="Source")

out = ta.ema(src, fast_ma)
out1 = ta.ema(src, slow_ma)

//plot(out, title="20 EMA", color=color.rgb(117, 71, 247), linewidth = 2)
//plot(out1, title="50 EMA", color=color.rgb(0, 0, 0), linewidth = 2)


longCondition = ((ta.crossover(modrsi, RSIAVG)) and (RSI_hist > 0))
if longCondition
    strategy.entry('B', strategy.long)

shortCondition = ((ta.crossunder(modrsi, RSIAVG)) and (RSI_hist < 0))
if shortCondition
    strategy.entry('S', strategy.short)
Published by ChaoZhang on the FMZ strategy square · last modified 2024-03-29. Collected in the Quant Trading Vault. Unvalidated research: re-test with your own data and costs before trusting it.
Build this with AgenKit
A spec is not a trading system. Paste this into your coding agent and AgenKit runs a specialist team — architecture, test-first build, risk gates, review — with paper trading on by default.
/agenkit build a production-grade trading bot with a backtest engine, risk controls and paper trading by default from strategies/Modified-Relative-Strength-Index-Trend-Following-Strategy.md- npx agenkit install engineering-kit in your project
- Paste the command into your agent and approve each phase
- Get tests, backtest, risk controls and a paper-trading switch
Understand it first
Before you run this, read the lesson behind the idea and how to backtest it honestly. Specs like this one are the survivors of an unknown number of trials; deflate their results accordingly.
Related specs
- Adaptive ATR and RSI Trend Following Strategy with Trailing Stop LossPine Script · Trend following · 1h
- Advanced Multi Indicator Multi Dimensional Trend Cross Quantitative StrategyPine Script · Trend following · 3h
- Bollinger Bands and RSI Trend Following StrategyPine Script · Trend following · 1h
- Dual ATR Channel Trend Following StrategyPine Script · Trend following · 15m
- Dual EMA Crossover with RSI Trend Confirmation StrategyPine Script · Trend following · 3h
- Dual Mode Adaptive Trend Trading Strategy EMA Crossover with ATR Volatility Based Risk Management SystemPine Script · Trend following · 1d