Strategy vault / Trend following
Monthly Close Price and Moving Average Crossover Strategy
This strategy generates trading signals based on the crossover between the monthly close price and moving average lines. It goes long when the monthly close price crosses above the moving average, and flats when the…
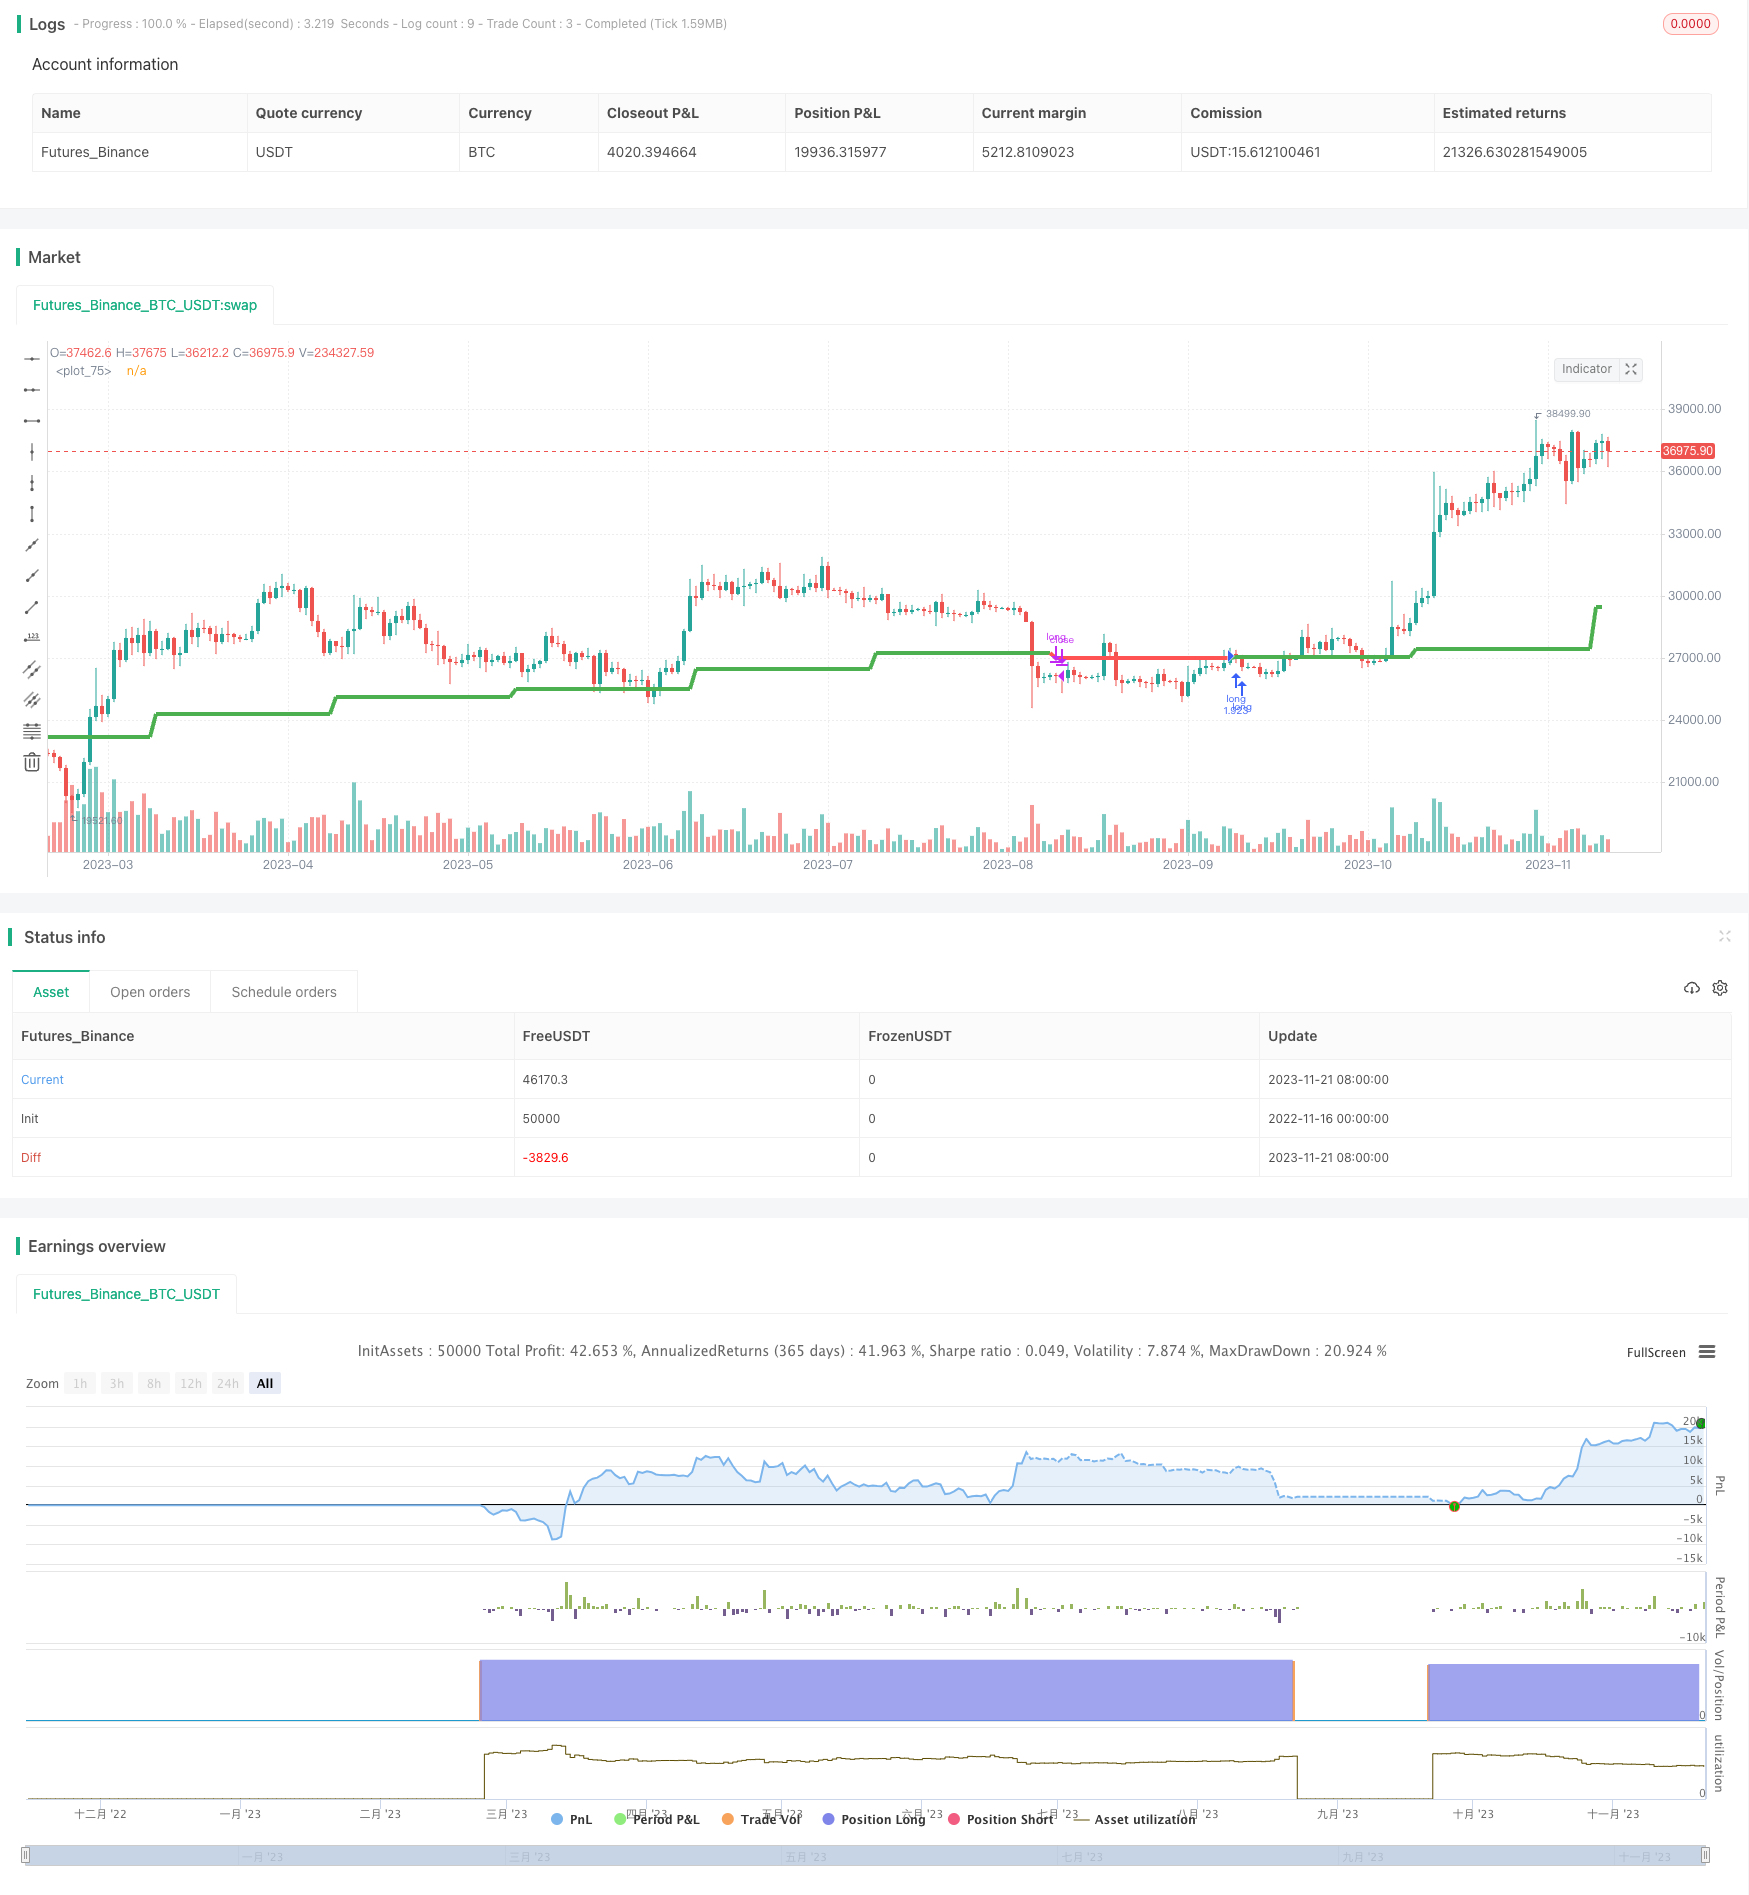
Overview
This strategy generates trading signals based on the crossover between the monthly close price and moving average lines. It goes long when the monthly close price crosses above the moving average, and flats when the monthly close price crosses below the moving average.
Strategy Logic
The core logic of this strategy is:
- Take the moving average period parameter as input. Choose between SMA and EMA.
- Option to display the moving average line.
- Option to use another ticker's close price as signal source.
- Determine trading signals based on relationship between monthly close price and moving average:
- Close price crossing above MA - Long
- Close price crossing below MA - Close long position
This strategy utilizes the smoothing capability of moving averages to filter out price noises and capture mid-term trend reversals. Crossing above the MA suggests an emerging bull trend while crossing below indicates the trend is turning bearish.
Advantages
The main advantages of this strategy are:
- Uses monthly data to effectively filter out intraday noises and capture mid-long term trends
- Customizable MA period for optimization across different tickers
- Option to use another ticker as signal source improves stability
- Implements advanced anti-repainting techniques
- Flexible backtesting time frame for ease of testing
In summary, this is a simple yet practical strategy framework that can be adapted to most stocks through parameter tuning, especially suitable for mid-long term investors.
Risks
There are also a few risks to note:
- Monthly data updates slowly, unable to reflect price changes in real-time
- Lags behind and could miss short-term opportunities
- MAs have inherent lags, signal timing unpredictable
- Suboptimal parameter selection leads to over-conservatism or missed opportunities
Suggested ways to mitigate risks:
- Incorporate faster timeframe technical indicators for auxiliary judgement
- Optimize MA period to find best parameters
- Use more stable benchmark as signal source
- Adjust position sizing to limit losses
Enhancement Opportunities
This strategy has great potential for enhancement:
- Incorporate stop loss to lock in profits and control risks
- Add complementing indicators like KD, MACD to improve signal accuracy
- Employ machine learning techniques to dynamically optimize MA parameters
- Introduce position sizing that aligns with trends
- Build in long/short switching capabilities based on market conditions
- Merge with faster timeframe prices for quicker reactions
Conclusion
The monthly close and MA crossover strategy has simple, straightforward logic and can be adapted to various tickers through parameter tuning. It is especially suitable for mid-long term investors. With the continuing enhancement of stop loss, parameter optimization and other modules, this strategy shows great promise.
Parameters
| Name | Default | What it controls |
|---|---|---|
| v_input_1 | true | Show MA |
| v_input_2 | true | Exponential MA |
| v_input_3 | false | Other ticker MA |
| v_input_4 | BTC_USDT:swap | Ticker MA |
| v_input_5 | M | Time MA (W, D, [min]) |
| v_input_6 | 8 | Period MA |
| v_input_7 | false | Show Date Range |
| v_input_8 | true | From Month |
| v_input_9 | true | From Day |
| v_input_10 | 1995 | From Year |
| v_input_11 | true | Thru Month |
| v_input_12 | true | Thru Day |
| v_input_13 | 2112 | Thru Year |
Source Pine Script
/*backtest
start: 2022-11-16 00:00:00
end: 2023-11-22 00:00:00
period: 1d
basePeriod: 1h
exchanges: [{"eid":"Futures_Binance","currency":"BTC_USDT"}]
*/

// This source code is subject to the terms of the Mozilla Public License 2.0 at https://mozilla.org/MPL/2.0/
// © universique

//@version=4
strategy("Monthly MA Close ", shorttitle="MMAC", overlay=true, default_qty_type =  strategy.percent_of_equity, default_qty_value = 100)
//MAY 6 2020 18:00

// No repaint function
// Function to securely and simply call `security()` so that it never repaints and never looks ahead.
f_secureSecurity(_symbol, _res, _src) => security(_symbol, _res, _src[1], lookahead = barmerge.lookahead_on)
//sec10 = f_secureSecurity(syminfo.tickerid, higherTf, data)

// ----- Converts current chart resolution into a float minutes value.
f_resInMinutes() =>
    _resInMinutes = timeframe.multiplier * (
      timeframe.isseconds ? 1. / 60             :
      timeframe.isminutes ? 1.                  :
      timeframe.isdaily   ? 60. * 24            :
      timeframe.isweekly  ? 60. * 24 * 7        :
      timeframe.ismonthly ? 60. * 24 * 30.4375  : na)
// ----- Returns the float minutes value of the string _res.
f_tfResInMinutes(_res) =>
    // _res: resolution of any TF (in "timeframe.period" string format).
    // Dependency: f_resInMinutes().
    security(syminfo.tickerid, _res, f_resInMinutes())

// ---------- Determine if current timeframe is smaller that higher timeframe selected in Inputs.
// Get higher timeframe in minutes.
//higherTfInMinutes = f_tfResInMinutes(higherTf)
// Get current timeframe in minutes.
currentTfInMinutes = f_resInMinutes()
// Compare current TF to higher TF to make sure it is smaller, otherwise our plots don't make sense.
//chartOnLowerTf = currentTfInMinutes < higherTfInMinutes

// Input
switch1=input(true, title="Show MA")
exponential = input(true, title="Exponential MA")
ticker = input(false, title="Other ticker MA")

tic_ma = input(title="Ticker MA", type=input.symbol, defval="BTC_USDT:swap")
res_ma = input(title="Time MA (W, D, [min])", type=input.string, defval="M")
len_ma = input(8, minval=1, title="Period MA")

ma_cus = exponential?f_secureSecurity(tic_ma, res_ma, ema(close,len_ma)) : f_secureSecurity(tic_ma, res_ma, sma(close,len_ma))
ma_long = exponential?f_secureSecurity(syminfo.tickerid, res_ma, ema(close,len_ma)) : f_secureSecurity(syminfo.tickerid, res_ma, sma(close,len_ma))

cl1 = f_secureSecurity(syminfo.tickerid, 'M', close)
cl2 = f_secureSecurity(tic_ma, 'M', close)

// Input Backtest Range
showDate  = input(defval = false, title = "Show Date Range", type = input.bool)
fromMonth = input(defval = 1,    title = "From Month",      type = input.integer, minval = 1, maxval = 12)
fromDay   = input(defval = 1,    title = "From Day",        type = input.integer, minval = 1, maxval = 31)
fromYear  = input(defval = 1995, title = "From Year",       type = input.integer, minval = 1850)
thruMonth = input(defval = 1,    title = "Thru Month",      type = input.integer, minval = 1, maxval = 12)
thruDay   = input(defval = 1,    title = "Thru Day",        type = input.integer, minval = 1, maxval = 31)
thruYear  = input(defval = 2112, title = "Thru Year",       type = input.integer, minval = 1850)

// Funcion Example
start     = timestamp(fromYear, fromMonth, fromDay, 00, 00)        // backtest start window
finish    = timestamp(thruYear, thruMonth, thruDay, 23, 59)        // backtest finish window
window()  => time >= start and time <= finish ? true : false       // create function "within window of time"

// Calculation
bullish_cross = ticker?cl2>ma_cus : cl1>ma_long
bearish_cross = ticker?cl2<ma_cus : cl1<ma_long

MAColor = bullish_cross ? color.green : bearish_cross ? color.red : color.orange

// Strategy
strategy.entry("long", strategy.long, when = window() and bullish_cross)
strategy.close("long", when = window() and bearish_cross)

// Output
plot(switch1?ma_long:na,color = MAColor,linewidth=4)

// Alerts
alertcondition(bullish_cross, title='Bullish', message='Bullish')
alertcondition(bearish_cross, title='Bearish', message='Bearish')Published by ChaoZhang on the FMZ strategy square · last modified 2023-11-23. Collected in the Quant Trading Vault. Unvalidated research: re-test with your own data and costs before trusting it.
Build this with AgenKit
A spec is not a trading system. Paste this into your coding agent and AgenKit runs a specialist team — architecture, test-first build, risk gates, review — with paper trading on by default.
/agenkit build a production-grade trading bot with a backtest engine, risk controls and paper trading by default from strategies/Monthly-Close-Price-and-Moving-Average-Crossover-Strategy.md- npx agenkit install engineering-kit in your project
- Paste the command into your agent and approve each phase
- Get tests, backtest, risk controls and a paper-trading switch
Understand it first
Before you run this, read the lesson behind the idea and how to backtest it honestly. Specs like this one are the survivors of an unknown number of trials; deflate their results accordingly.
Related specs
- Bollinger Bands and RSI Trend Following StrategyPine Script · Trend following · 1h
- Dual ATR Channel Trend Following StrategyPine Script · Trend following · 15m
- Dual MA Crossover Trend Tracking StrategyPine Script · Trend following · 1h
- Dynamic Dual EMA Crossover Strategy with Adaptive Profit Loss ControlPine Script · Trend following · 1d
- EMA SMA Multi Indicator Comprehensive Trend Following StrategyPine Script · Trend following · 1h
- EMA and RSI Trend Trading StrategyPine Script · Trend following · 1d