Strategy vault / Trend following
Multi Dimensional Trend Analysis with ATR Based Dynamic Stop Management Strategy
This strategy is a trend following system that combines multiple technical indicators, including Ichimoku Cloud, MACD indicator, and long-term moving average (EMA200). Through the coordination of these indicators, it…
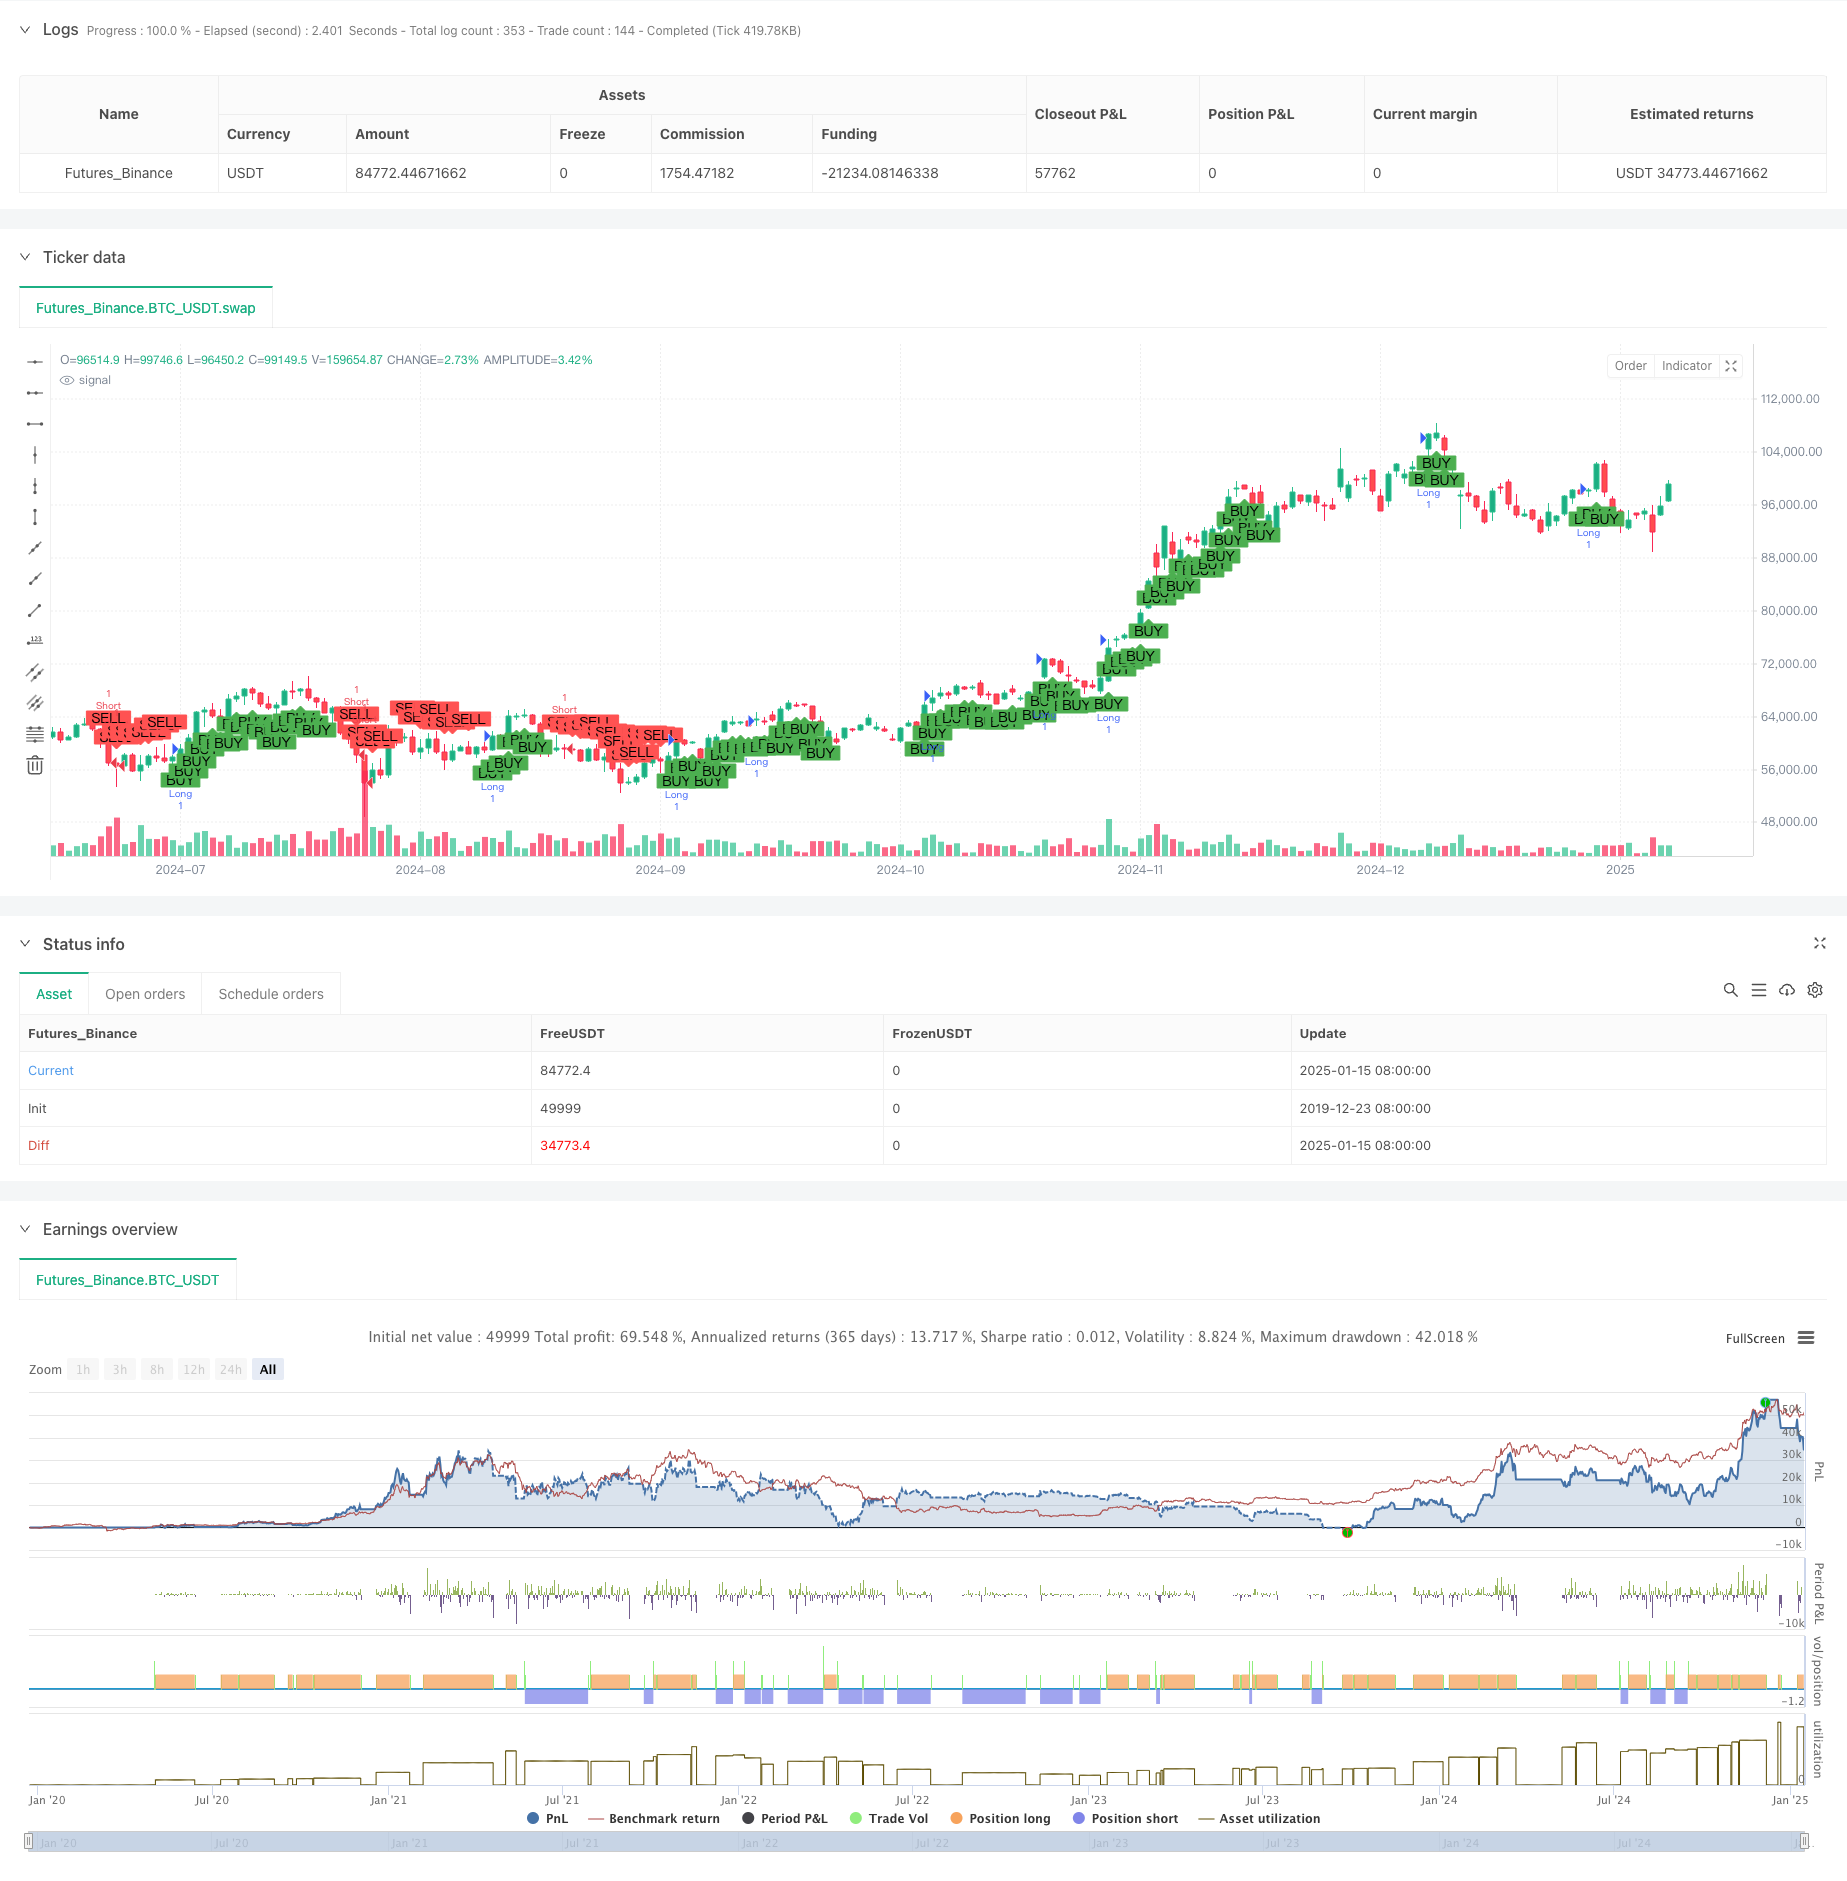
Overview
This strategy is a trend following system that combines multiple technical indicators, including Ichimoku Cloud, MACD indicator, and long-term moving average (EMA200). Through the coordination of these indicators, it forms a complete trading system that not only accurately captures market trends but also effectively controls risk through ATR-based dynamic stop management.
Strategy Principle
The strategy employs a triple confirmation mechanism to identify trading signals. First, it uses the Ichimoku Cloud to judge price position, favoring long positions when price is above the cloud and short positions when below. Second, it utilizes the MACD indicator, confirming trend direction through MACD line and signal line crossovers. Finally, it incorporates a 200-period EMA as a trend filter to ensure trade direction aligns with the long-term trend. For risk control, the strategy employs the ATR indicator to dynamically set stop-loss and take-profit levels, allowing them to adapt to market volatility.
Strategy Advantages
- Multi-dimensional trend confirmation mechanism significantly improves trading signal reliability
- Long-term moving average filtering prevents counter-trend trading
- ATR-based dynamic stop adjustment better adapts to market volatility
- Executing trades only after candle confirmation reduces false signals
- Combination of multiple mature technical indicators provides mutual verification, reducing misjudgment risk
Strategy Risks
- Multiple confirmation mechanisms may lead to delayed entry signals, missing some market moves
- May generate frequent entry and exit signals in ranging markets
- Reliance on technical indicators may underperform during extreme market volatility
- ATR-based stops may be triggered prematurely when volatility suddenly increases Recommend adjusting ATR multipliers to balance risk-reward ratio and consider adding market environment filters.
Strategy Optimization Directions
- Introduce volatility indicators (such as ATR range assessment) for market environment identification
- Add volume analysis to improve trend confirmation reliability
- Optimize MACD parameters to better adapt to different market cycles
- Consider adding trend strength filters to avoid trading in weak trends
- Implement dynamically adjusted profit/loss ratios to adapt to different market phases
Summary
This strategy constructs a relatively complete trend following system through the combined application of multi-dimensional technical indicators. Its core advantages lie in its multiple signal confirmation mechanism and dynamic risk management method, though parameter optimization based on actual market conditions is still needed. The strategy's overall design is clear and practical, suitable for application in markets with obvious trends.
Source Pine Script
/*backtest
start: 2019-12-23 08:00:00
end: 2025-01-16 00:00:00
period: 1d
basePeriod: 1d
exchanges: [{"eid":"Futures_Binance","currency":"BTC_USDT","balance":49999}]
*/

//@version=6
strategy("JOJOLong-Term Trend", overlay=true, shorttitle="JOJO Long-Term Trend")

// Ichimoku Cloud chart
conversionLine = ta.sma(high, 9)  // conversion line
baseLine = ta.sma(low, 26)  // Base line
leadingSpanA = (conversionLine + baseLine) / 2  // Leading SpanA
leadingSpanB = (ta.sma(high, 52) + ta.sma(low, 52)) / 2  // Leading SpanB
laggingSpan = close[26]  // Lagging Span

// MACD Indicator
macdLine = ta.ema(close, 12) - ta.ema(close, 26)  // MACD Line
signalLine = ta.ema(macdLine, 9)  // Signal Line
macdHist = macdLine - signalLine  // MACD Bar Chart

// Long-term moving average
longTermEMA = ta.ema(close, 200)  // 200timeframeEMA,Used to confirm long-term trend

// Declare long and short condition variables
var bool longCondition = false
var bool shortCondition = false

// Declare close position condition variables
var bool exitLongCondition = false
var bool exitShortCondition = false

// Only inKCalculated after line completion
if barstate.isconfirmed
    longCondition := (close > leadingSpanA) and (macdLine > signalLine) and (close > longTermEMA)  // Long Condition
    shortCondition := (close < leadingSpanB) and (macdLine < signalLine) and (close < longTermEMA)  // Short Condition

    // Close position condition
    exitLongCondition := macdLine < signalLine or close < leadingSpanB  // Long position closing conditions
    exitShortCondition := macdLine > signalLine or close > leadingSpanA  // Short position closing conditions

    // Execute strategy to enter the market
    if longCondition
        strategy.entry("Long", strategy.long)  // Long Entry

    if shortCondition
        strategy.entry("Short", strategy.short)  // Short Entry

    // Set stop loss and take profit, using ATR Multiple dynamic adjustments
    stopLoss = input.float(1.5, title="stop loss (ATR Multiples)", step=0.1) * ta.atr(14)  // Stop Loss Based On ATR
    takeProfit = input.float(3.0, title="take profit (ATR Multiples)", step=0.1) * ta.atr(14)  // Take Profit Based On ATR

    // Execute Close Position
    if exitLongCondition
        strategy.exit("Exit Long", from_entry="Long", stop=close - stopLoss, limit=close + takeProfit)  // Close long positions

    if exitShortCondition
        strategy.exit("Exit Short", from_entry="Short", stop=close + stopLoss, limit=close - takeProfit)  // Close short position

// Draw buy and sell signals
plotshape(series=barstate.isconfirmed and longCondition, location=location.belowbar, color=color.green, style=shape.labelup, text="BUY")
plotshape(series=barstate.isconfirmed and shortCondition, location=location.abovebar, color=color.red, style=shape.labeldown, text="SELL")
Published by ChaoZhang on the FMZ strategy square · last modified 2025-01-17. Collected in the Quant Trading Vault. Unvalidated research: re-test with your own data and costs before trusting it.
Build this with AgenKit
A spec is not a trading system. Paste this into your coding agent and AgenKit runs a specialist team — architecture, test-first build, risk gates, review — with paper trading on by default.
/agenkit build a production-grade trading bot with a backtest engine, risk controls and paper trading by default from strategies/Multi-Dimensional-Trend-Analysis-with-ATR-Based-Dynamic-Stop-Management-Strategy.md- npx agenkit install engineering-kit in your project
- Paste the command into your agent and approve each phase
- Get tests, backtest, risk controls and a paper-trading switch
Understand it first
Before you run this, read the lesson behind the idea and how to backtest it honestly. Specs like this one are the survivors of an unknown number of trials; deflate their results accordingly.
Related specs
- Dual ATR Channel Trend Following StrategyPine Script · Trend following · 15m
- Ichimoku Cloud MACD and Stochastic Based Multi Timeframe Trend Tracking StrategyPine Script · Trend following · 4h
- Ichimoku Mixed Equilibrium Table Macd and Tsi Combined StrategyPine Script · Trend following · 1h
- Bollinger Bands and RSI Trend Following StrategyPine Script · Trend following · 1h
- Dual MA Crossover Trend Tracking StrategyPine Script · Trend following · 1h
- Dynamic Dual EMA Crossover Strategy with Adaptive Profit Loss ControlPine Script · Trend following · 1d