Strategy vault / Trend following
Multi EMA and RSI Trend Following Strategy
This article mainly analyzes the quantitative trading strategy developed by Ravikant sharma based on multiple exponential moving averages (EMA) and relative strength index (RSI). The strategy identifies price trends…
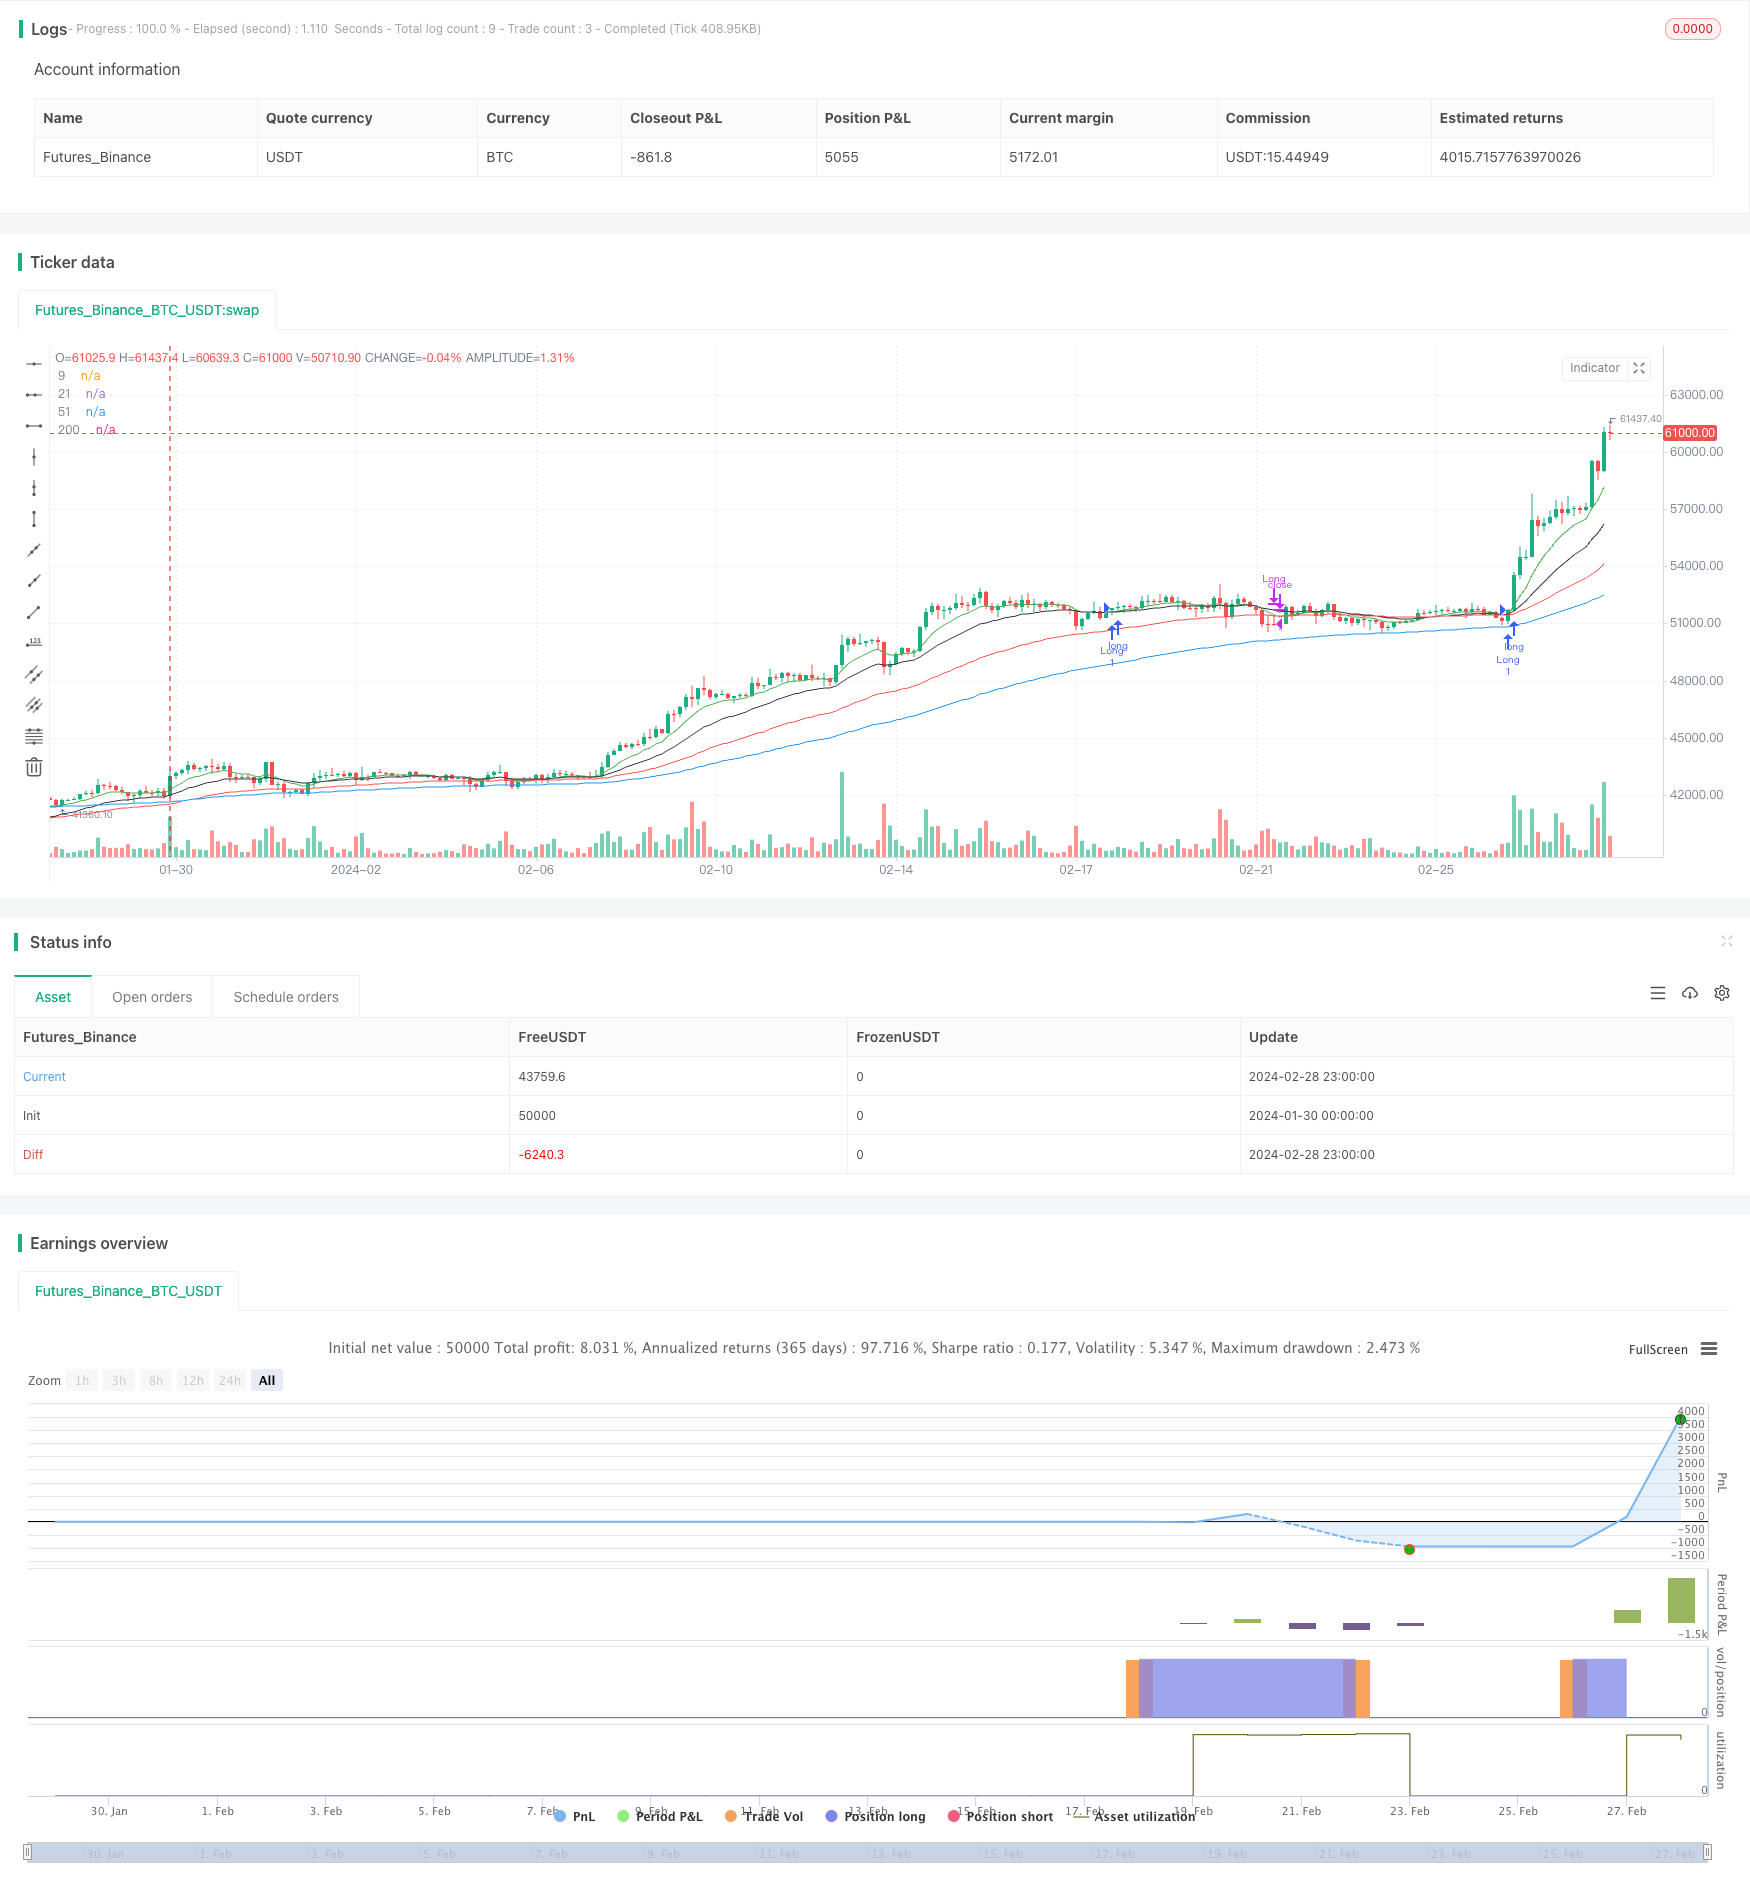
Overview
This article mainly analyzes the quantitative trading strategy developed by Ravikant_sharma based on multiple exponential moving averages (EMA) and relative strength index (RSI). The strategy identifies price trends and determines entry and exit points by crossing EMAs with different cycles and values of RSI.
Strategy Principle
Indicator Calculation
The strategy uses 5 EMAs with different periods, including 9-day, 21-day, 51-day, 100-day and 200-day lines. Only the first 4 EMAs are plotted in the code. The RSI parameter is set to 14.
Entry Conditions
One of the following conditions must be met before buying:
- The 9-day EMA crosses above the 21-day EMA
- The 9-day EMA crosses above the 51-day EMA
- The 51-day EMA crosses below the 100-day EMA
At the same time, RSI must be greater than 65, indicating a strong uptrend.
Exit Conditions
One of the following conditions must be met before closing the position:
- 9-day EMA crosses below 51-day EMA, indicating trend reversal
- The closing price exceeds 125% of the entry price, reaching the profit target
- RSI drops below 40, signaling reversal
- The closing price falls below 98% of the entry price, stop loss triggered
Advantage Analysis
It is a typical trend following strategy with the following strengths:
- Using EMA crossovers to determine trend direction for effective trend tracking
- Combining EMAs of different periods identifies more reliable trend signals
- RSI filter avoids false signals in range-bound markets
- Take profit and stop loss settings lock in profits and control risks
Risks and Solutions
There are still some risks:
- Uncertain signals may occur frequently in range-bound markets, causing over-trading. EMA periods and RSI filter conditions can be adjusted.
- EMA crossover signals may lag during sharp reversals, unable to exit in time. Other indicators can be added to determine long/short signal strength.
- Improper profit target and stop loss settings lead to premature stop loss or failure to lock in profits in time. Parameters should be optimized according to different products and market environments.
Optimization Directions
The strategy can be further optimized in the following ways:
- Parameter optimization for different products
- Adding other technical indicators to build multifactor models
- Incorporating machine learning algorithms to judge signal quality
- Combining sentiment analysis to avoid emotional pitfalls
- Testing different take profit/stop loss strategies to find optimum
Conclusion
In conclusion, this is an overall reliable and easy-to-implement trend following strategy. With EMA crossover for trend direction and RSI filter for false signals, good backtest results provide a solid foundation for further parameter and model optimization to obtain steady profits. However, traders should still be cautious of sharp reversals and improper parameters that pose risks.
Source Pine Script
/*backtest
start: 2024-01-30 00:00:00
end: 2024-02-29 00:00:00
period: 3h
basePeriod: 15m
exchanges: [{"eid":"Futures_Binance","currency":"BTC_USDT"}]
*/

// This source code is subject to the terms of the Mozilla Public License 2.0 at https://mozilla.org/MPL/2.0/
// © Ravikant_sharma

//@version=5

strategy('new', overlay=true)

start = timestamp(1990, 1, 1, 0, 0)
end = timestamp(2043, 12, 12, 23, 59)
ema0 = ta.ema(close, 9)
ema1 = ta.ema(close, 21)
ema2 = ta.ema(close, 51)
ema3 = ta.ema(close, 100)
ema4 = ta.ema(close, 200)

rsi2=ta.rsi(ta.sma(close,14),14)
plot(ema0, '9', color.new(color.green, 0))
plot(ema1, '21', color.new(color.black, 0))
plot(ema2, '51', color.new(color.red, 0))
plot(ema3, '200', color.new(color.blue, 0))

//plot(ema4, '100', color.new(color.gray, 0))


//LongEntry = (  ta.crossover(ema0,ema3)  or  ta.crossover(ema0,ema2) or  ta.crossunder(ema2,ema3) ) // ta.crossover(ema0,ema1) //
LongEntry=false
if ta.crossover(ema0,ema1)
    if rsi2>65
        LongEntry:=true
if ta.crossover(ema1,ema2)
    if rsi2>65
        LongEntry:=true

LongExit =  ta.crossunder(ema0,ema2) or close >(strategy.position_avg_price*1.25) or rsi2 <40 or close < (strategy.position_avg_price*0.98)


if time >= start and time <= end
    if(LongEntry and rsi2>60)
        strategy.entry('Long', strategy.long, 1)
    if(LongExit)
        strategy.close('Long')
Published by ChaoZhang on the FMZ strategy square · last modified 2024-03-01. Collected in the Quant Trading Vault. Unvalidated research: re-test with your own data and costs before trusting it.
Build this with AgenKit
A spec is not a trading system. Paste this into your coding agent and AgenKit runs a specialist team — architecture, test-first build, risk gates, review — with paper trading on by default.
/agenkit build a production-grade trading bot with a backtest engine, risk controls and paper trading by default from strategies/Multi-EMA-and-RSI-Trend-Following-Strategy.md- npx agenkit install engineering-kit in your project
- Paste the command into your agent and approve each phase
- Get tests, backtest, risk controls and a paper-trading switch
Understand it first
Before you run this, read the lesson behind the idea and how to backtest it honestly. Specs like this one are the survivors of an unknown number of trials; deflate their results accordingly.
Related specs
- Bollinger Bands and RSI Trend Following StrategyPine Script · Trend following · 1h
- Dual ATR Channel Trend Following StrategyPine Script · Trend following · 15m
- Dual Mode Adaptive Trend Trading Strategy EMA Crossover with ATR Volatility Based Risk Management SystemPine Script · Trend following · 1d
- Dynamic Dual EMA Crossover Strategy with Adaptive Profit Loss ControlPine Script · Trend following · 1d
- Dynamic Signal Line Trend Following and Volatility Filtering StrategyPine Script · Trend following · 1h
- EMA AROON ASHPine Script · Trend following · 3m