Strategy vault / Trend following
OBV EMA Crossover Trend Following Strategy
This strategy uses the crossover of dual EMA lines of OBV indicator to determine the trend of OBV, and takes long/short positions according to the trend direction. OBV indicator can reflect the relationship between…
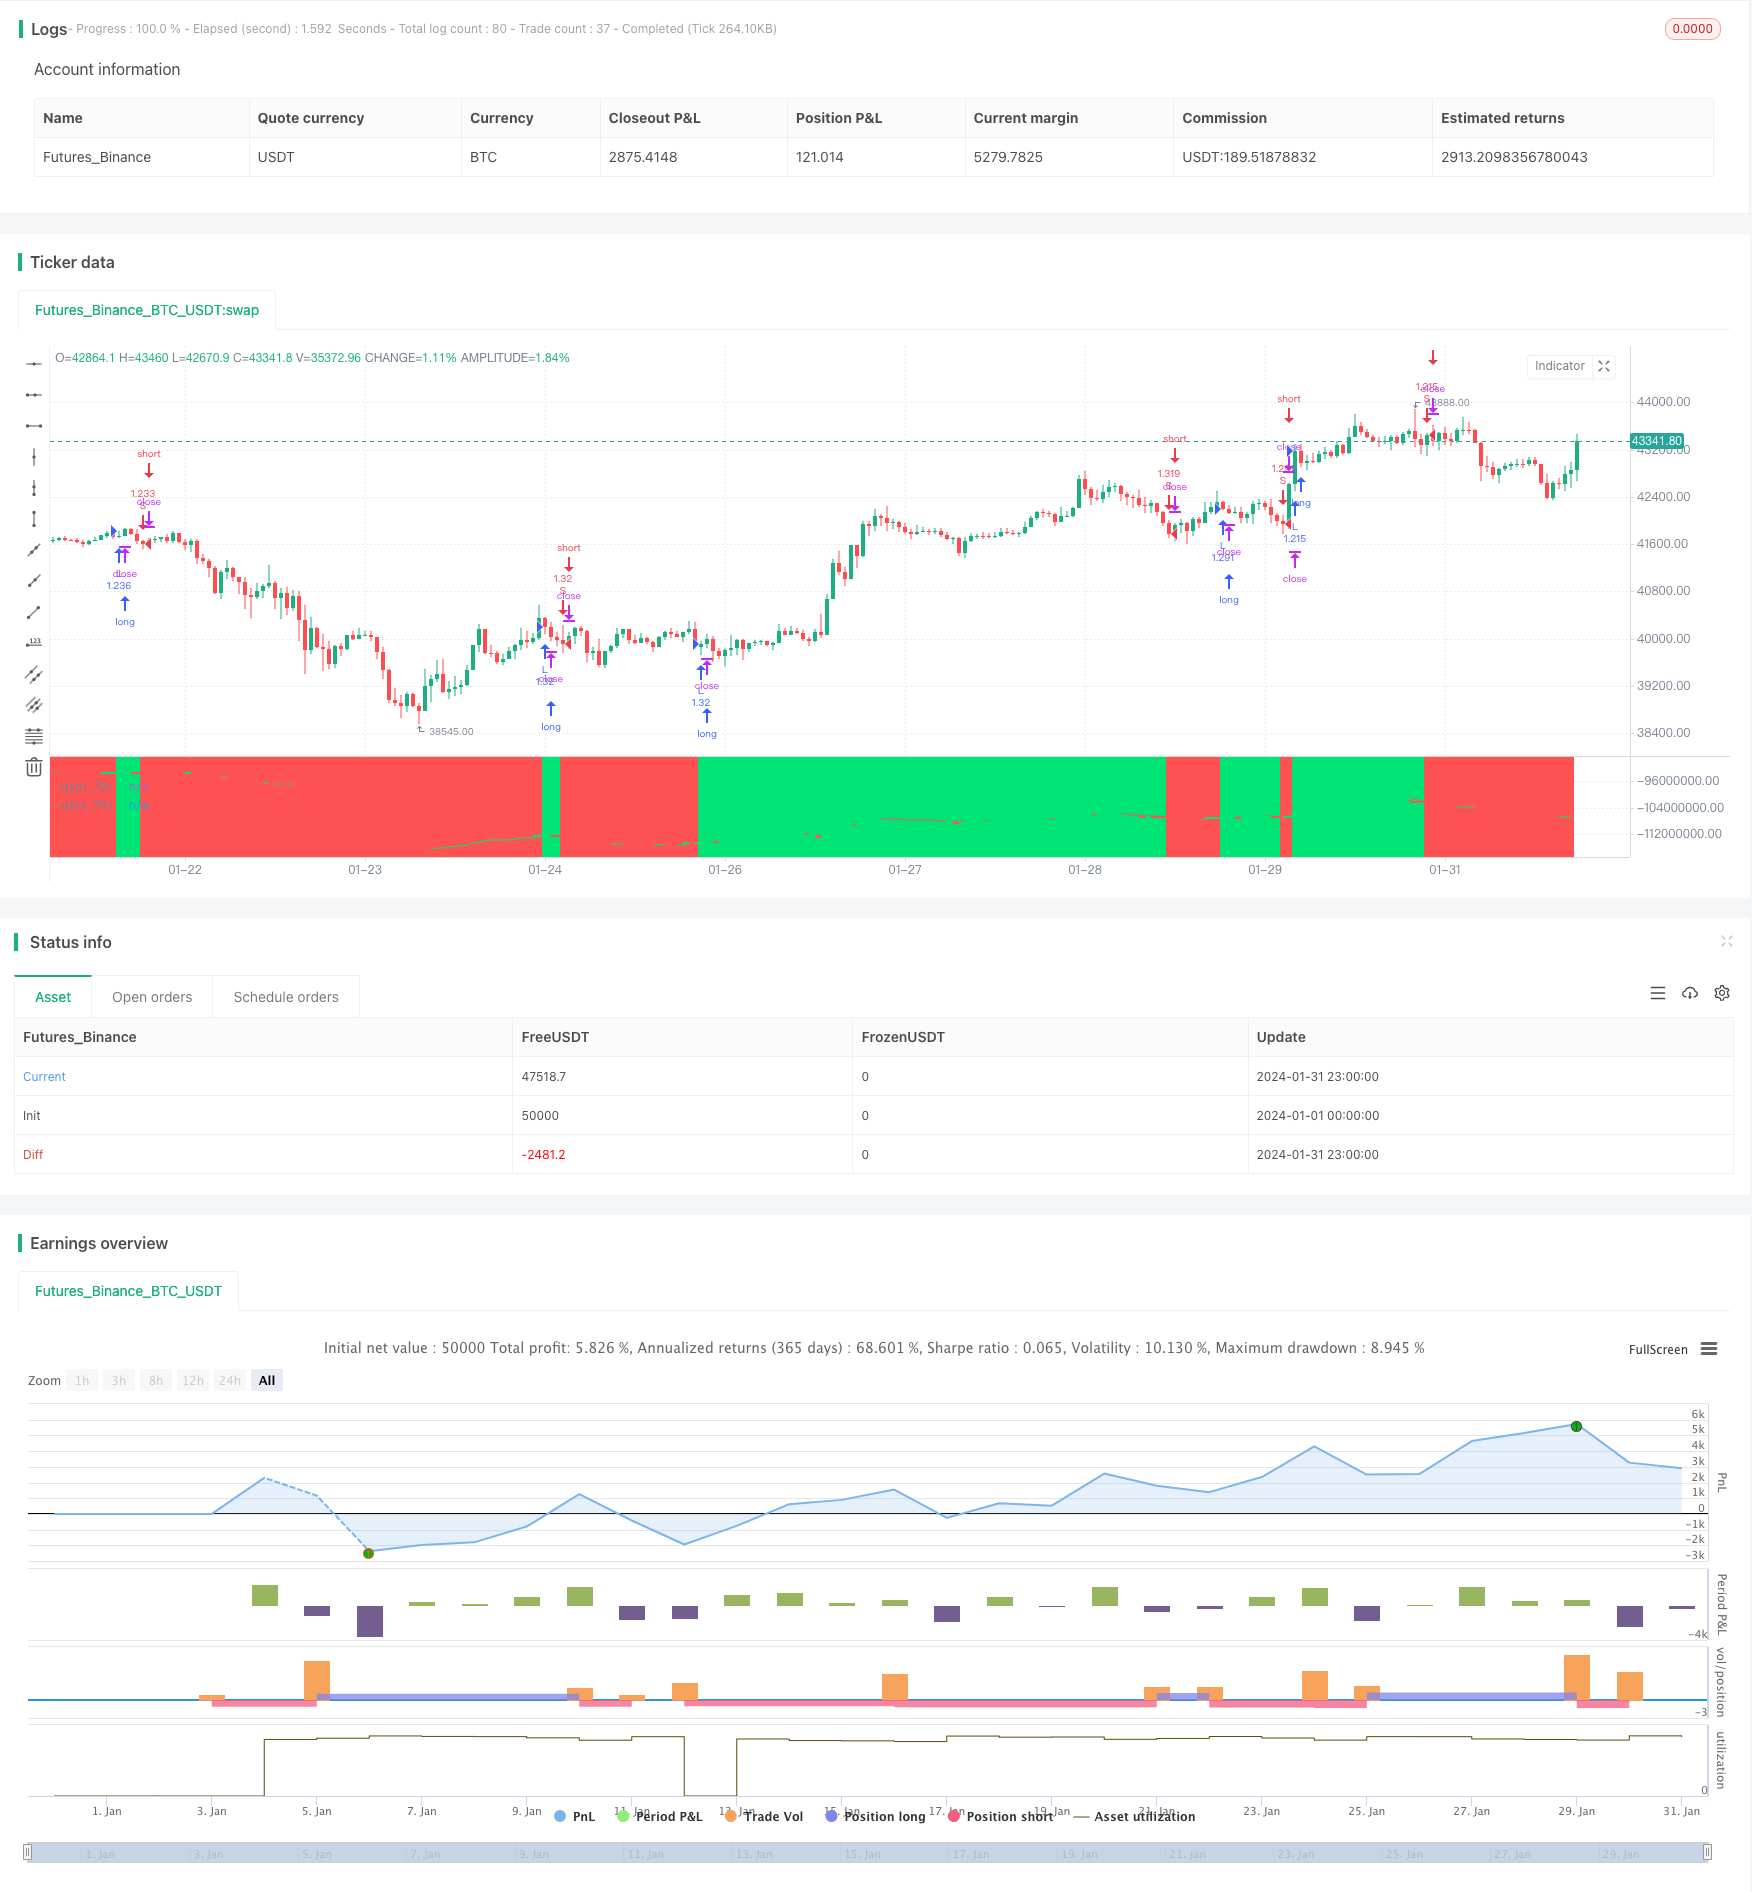
Overview
This strategy uses the crossover of dual EMA lines of OBV indicator to determine the trend of OBV, and takes long/short positions according to the trend direction. OBV indicator can reflect the relationship between price and volume more clearly and judge the intention of market participants, so it can be used to capture market trend. This strategy combines the indicator smoothing of moving averages, which can effectively filter out market noise and capture the main trend.
Strategy Principle
This strategy mainly uses whether OBV is in an uptrend to determine the long entry timing. Specifically, it calculates the 6-day EMA and 24-day EMA of OBV. When the 6-day EMA crosses above the 24-day EMA, a long signal is generated. Similarly, when the 6-day EMA crosses below the 24-day EMA, a short signal is generated. In addition, the strategy also sets a 3% stop loss.
The key to the strategy's trend judgment lies in the OBV indicator. OBV indicator reflects the collective intention of big money and can effectively reflect the attitude of market participants. Combined with the moving average line processing, some noise can be filtered out to make the signal clearer and more reliable. The strategy uses fast EMA lines and slow EMA lines to construct trading signals, which can smooth price data and also capture trend changes more sensitively.
Advantage Analysis
The strategy has the following advantages:
OBV indicator based on trading volume can clearly judge the intention of market participants, and the signal is more reliable.
The dual EMA line processing can filter out some noise to make the signal clearer.
The combination of fast and slow EMA lines can take into account both price smoothing and capturing trend changes.
The strategy operation is simple and easy to implement.
Risk Analysis
The strategy also has some risks:
OBV indicator may issue wrong signals at some point, at which the strategy may suffer losses.
In violent trading, EMA lines have lagging effect, which may miss the optimal entry point.
The fixed stop loss setting may be too rigid to adapt to market changes.
Countermeasures:
Confirm with other indicators to avoid wrong signals.
Optimize parameter settings to make EMA lines more sensitive.
Set dynamic stop loss.
Optimization Direction
The strategy can be optimized in the following aspects:
Optimize EMA parameter combination to find better matched moving average parameters.
Increase other indicators for signal confirmation, such as MACD, RSI, etc., to improve signal accuracy.
Set dynamic stop loss, which can adjust stop loss point in real time according to market fluctuations.
Parameter combination optimization to find the best parameter combination.
Conclusion
In general, this strategy is a relatively simple and reliable trend following strategy. It combines OBV indicator and dual EMA lines to judge the trend. The advantages are simple operation, clear signals, and ability to effectively track trends. The disadvantages are possible wrong signals and lagging of EMA line processing. Optimization with other indicators can achieve better results.
Parameters
| Name | Default | What it controls |
|---|---|---|
| v_input_1 | 2017 | Backtest Start Year |
| v_input_2 | true | Backtest Start Month |
| v_input_3 | true | Backtest Start Day |
| v_input_4 | 2019 | Backtest Stop Year |
| v_input_5 | 12 | Backtest Stop Month |
| v_input_6 | 31 | Backtest Stop Day |
| v_input_7 | 3 | ATR Period |
| v_input_8 | true | ATR Mult |
| v_input_9 | 24 | v_input_9 |
| v_input_10 | 6 | v_input_10 |
| v_input_11 | 3 | Stop Loss % |
| v_input_12 | 5000 | Take Profit % |
Source Pine Script
/*backtest
start: 2024-01-01 00:00:00
end: 2024-01-31 23:59:59
period: 1h
basePeriod: 15m
exchanges: [{"eid":"Futures_Binance","currency":"BTC_USDT"}]
*/

//@version=4
strategy("OBV EMA X BF ?", overlay=false, initial_capital=10000, default_qty_type=strategy.percent_of_equity, default_qty_value=100, commission_type=strategy.commission.percent, commission_value=0.0)

/////////////// Time Frame ///////////////
testStartYear = input(2017, "Backtest Start Year")
testStartMonth = input(1, "Backtest Start Month")
testStartDay = input(1, "Backtest Start Day")
testPeriodStart = timestamp(testStartYear,testStartMonth,testStartDay, 0, 0)

testStopYear = input(2019, "Backtest Stop Year")
testStopMonth = input(12, "Backtest Stop Month")
testStopDay = input(31, "Backtest Stop Day")
testPeriodStop = timestamp(testStopYear,testStopMonth,testStopDay, 0, 0)

testPeriod() => true

/////////////// OBV ///////////////
src = close
atr = atr(input(title="ATR Period", defval=3, minval=1))
atrmult = input(title="ATR Mult", defval=1, minval=0)
obv = cum(change(src) > 0 ? volume * (volume / atr) : change(src) < 0 ? -volume * (volume / atr) : 0 * volume / atr)
e1 = ema(obv, input(24))
e2 = ema(obv, input(6))

///////////////  Strategy  ///////////////
long = crossover(e2, e1)
short = crossunder(e2, e1)

last_long = 0.0
last_short = 0.0
last_long := long ? time : nz(last_long[1])
last_short := short ? time : nz(last_short[1])

long_signal = crossover(last_long, last_short)
short_signal = crossover(last_short, last_long)

last_open_long_signal = 0.0
last_open_short_signal = 0.0
last_open_long_signal := long_signal ? open : nz(last_open_long_signal[1])
last_open_short_signal := short_signal ? open : nz(last_open_short_signal[1])

last_long_signal = 0.0
last_short_signal = 0.0
last_long_signal := long_signal ? time : nz(last_long_signal[1])
last_short_signal := short_signal ? time : nz(last_short_signal[1])

in_long_signal = last_long_signal > last_short_signal
in_short_signal = last_short_signal > last_long_signal

last_high = 0.0
last_low = 0.0
last_high := not in_long_signal ? na : in_long_signal and (na(last_high[1]) or high > nz(last_high[1])) ? high : nz(last_high[1])
last_low := not in_short_signal ? na : in_short_signal and (na(last_low[1]) or low < nz(last_low[1])) ? low : nz(last_low[1])

since_longEntry = barssince(last_open_long_signal != last_open_long_signal[1])
since_shortEntry = barssince(last_open_short_signal != last_open_short_signal[1])

//////////////// Stop loss ///////////////
sl_inp = input(3.0, title='Stop Loss %') / 100
tp_inp = input(5000.0, title='Take Profit %') / 100

take_level_l = strategy.position_avg_price * (1 + tp_inp)
take_level_s = strategy.position_avg_price * (1 - tp_inp)

slLong = in_long_signal ? strategy.position_avg_price * (1 - sl_inp) : na
slShort = strategy.position_avg_price * (1 + sl_inp)
long_sl = in_long_signal ? slLong : na
short_sl = in_short_signal ? slShort : na

/////////////// Execution ///////////////
if testPeriod()
    strategy.entry("L", strategy.long, when=long)
    strategy.entry("S", strategy.short, when=short)
    strategy.exit("L SL", "L", stop=long_sl, when=since_longEntry > 0)
    strategy.exit("S SL", "S", stop=short_sl, when=since_shortEntry > 0)

/////////////// Plotting ///////////////
plot(e1, color = e1 > e1[1] ? color.lime : e1 < e1[1] ? color.red : color.white, linewidth = 2, offset = 0)
plot(e2, color = e2 > e2[1] ? color.lime : e2 < e2[1] ? color.red : color.white, linewidth = 1)
bgcolor(strategy.position_size > 0 ? color.lime : strategy.position_size < 0 ? color.red : color.white, transp=90)
bgcolor(long_signal ? color.lime : short_signal ? color.red : na, transp=60)Published by ChaoZhang on the FMZ strategy square · last modified 2024-02-20. Collected in the Quant Trading Vault. Unvalidated research: re-test with your own data and costs before trusting it.
Build this with AgenKit
A spec is not a trading system. Paste this into your coding agent and AgenKit runs a specialist team — architecture, test-first build, risk gates, review — with paper trading on by default.
/agenkit build a production-grade trading bot with a backtest engine, risk controls and paper trading by default from strategies/OBV-EMA-Crossover-Trend-Following-Strategy.md- npx agenkit install engineering-kit in your project
- Paste the command into your agent and approve each phase
- Get tests, backtest, risk controls and a paper-trading switch
Understand it first
Before you run this, read the lesson behind the idea and how to backtest it honestly. Specs like this one are the survivors of an unknown number of trials; deflate their results accordingly.
Related specs
- Five Minute Triple Confirmation Trend Trading Strategy with Risk Management SystemPine Script · Trend following · 1m
- Adaptive ATR and RSI Trend Following Strategy with Trailing Stop LossPine Script · Trend following · 1h
- Bollinger Bands and RSI Trend Following StrategyPine Script · Trend following · 1h
- Dual ATR Channel Trend Following StrategyPine Script · Trend following · 15m
- Dynamic Dual EMA Crossover Strategy with Adaptive Profit Loss ControlPine Script · Trend following · 1d
- EMA and RSI Trend Trading StrategyPine Script · Trend following · 1d