Strategy vault / Trend following
Relative Strength Index and Moving Average Crossover Strategy
The Relative Strength Index (RSI) and Moving Average Crossover strategy combines the RSI indicator and moving averages to make quantitative trading decisions. It utilizes the overbought and oversold levels indicated…
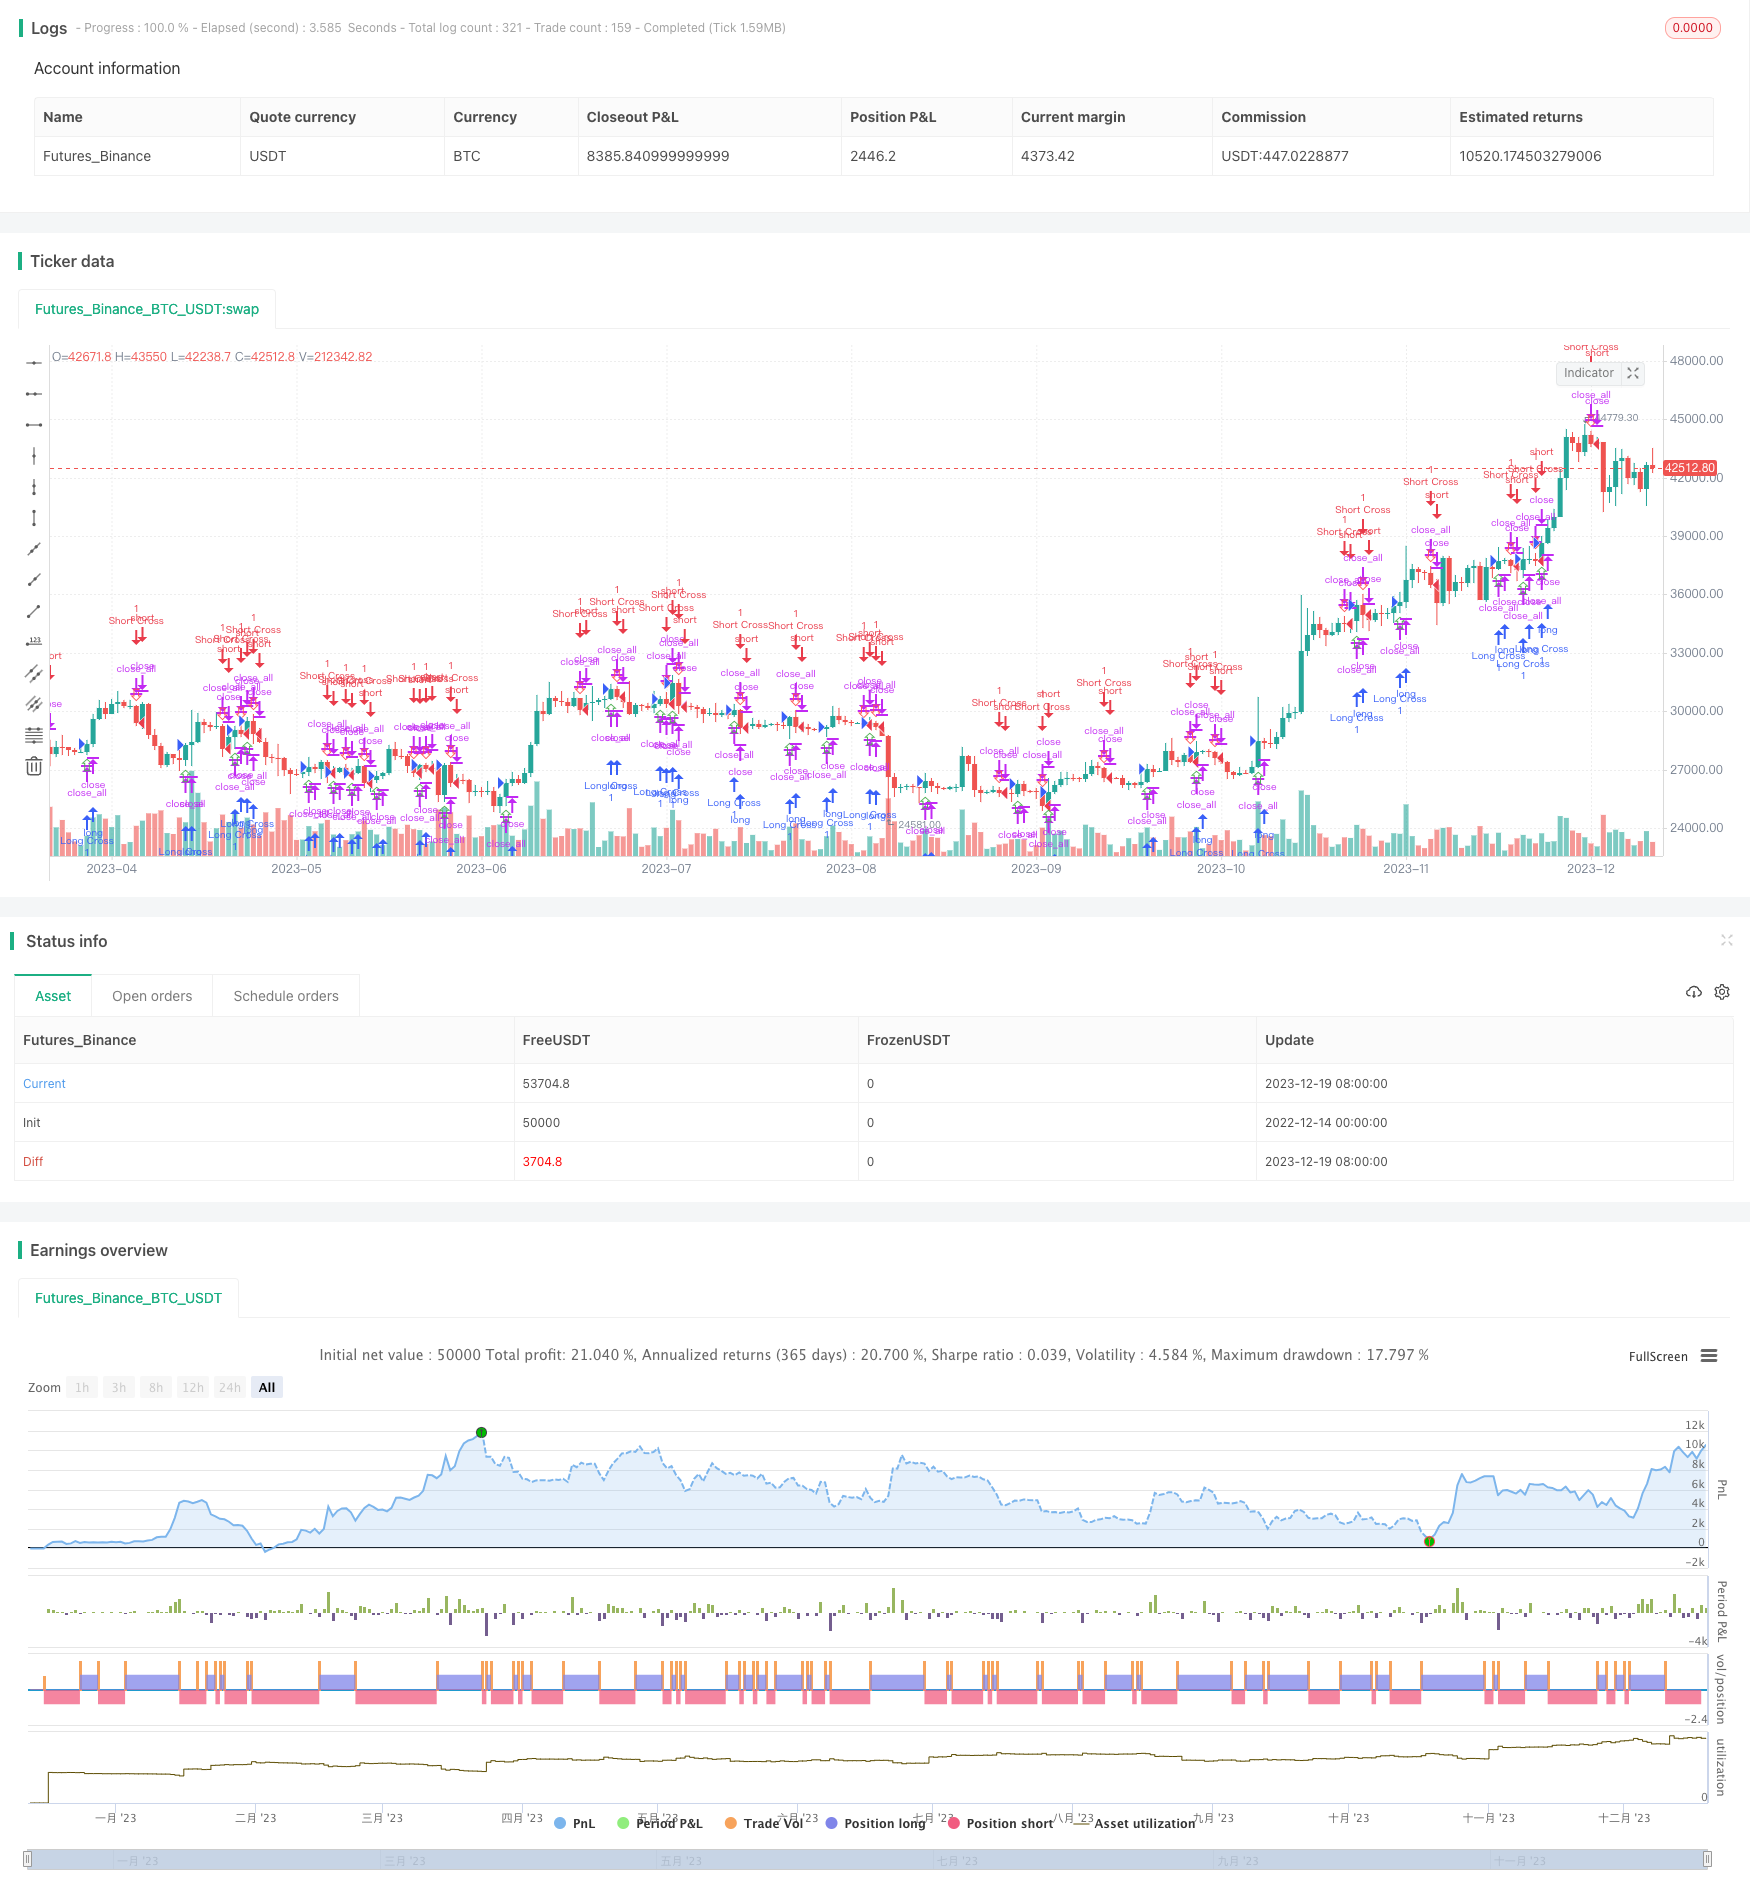
Overview
The Relative Strength Index (RSI) and Moving Average Crossover strategy combines the RSI indicator and moving averages to make quantitative trading decisions. It utilizes the overbought and oversold levels indicated by RSI to determine entries and exits, alongside golden cross and death cross signals generated when RSI crosses its moving average line.
Strategy Logic
Calculate the RSI indicator value. RSI measures the magnitude of recent price changes to evaluate if an asset is overbought or oversold.
Compute a moving average line (MA) of RSI, using an Exponential Moving Average (EMA) or Simple Moving Average (SMA).
When RSI crosses above its MA line, a golden cross buy signal is generated. When RSI crosses below its MA line, a death cross sell signal is triggered.
When RSI rises above the overbought threshold, the asset is considered overbought and a short position can be initiated. When RSI falls below the oversold threshold, the asset is considered oversold and a long position can be opened.
Advantage Analysis
Combining indicator crossover signals with RSI overbought/oversold levels improves the accuracy of trading decisions.
RSI overbought and oversold thresholds determine optimal entries and exits.
Capturing trend reversals by acting on indicator crossover signals.
Risk Analysis
RSI may generate incorrect signals during choppy or sideways markets.
Improper overbought or oversold threshold settings could lead to signals that are too loose or too strict.
Moving averages are sensitive to short-term anomalies and volatility spikes, increasing the likelihood of being stopped out prematurely.
Optimization Directions
Optimize RSI parameter by testing different length periods.
Find the optimal moving average periods by assessing different MA lengths.
Test various overbought and oversold threshold levels to refine entry signals.
Incorporate additional filters to validate signals and avoid false trades.
Conclusion
The RSI and Moving Average Crossover Strategy combines RSI overbought/oversold levels with MA crossover signals to identify market turning points and capture reversals. Performance and risk management can be enhanced through parameter optimization and signal filtering. This medium-term trading strategy offers strong alpha generation potential for experienced investors.
Parameters
| Name | Default | What it controls |
|---|---|---|
| v_input_1 | 13 | Length |
| v_input_2 | 9 | MA Lenght |
| v_input_3 | false | Exponential |
| v_input_4 | 10 | From Month |
| v_input_5 | 3 | From Day |
| v_input_6 | 2017 | From Year |
| v_input_7 | true | To Month |
| v_input_8 | true | To Day |
| v_input_9 | 9999 | To Year |
| v_input_10 | 90 | RSI % start overbought |
| v_input_11 | 10 | RSI % start oversold |
Source Pine Script
/*backtest
start: 2022-12-14 00:00:00
end: 2023-12-20 00:00:00
period: 1d
basePeriod: 1h
exchanges: [{"eid":"Futures_Binance","currency":"BTC_USDT"}]
*/

//@version=3
//dfurrer45
strategy(title="Relative Strength Index", shorttitle="RSI", overlay=true)
src = close, len = input(13, minval=1, title="Length"), maLen = input(9, minval=1, title="MA Lenght"), exponential = input(false, title="Exponential")

// === BACKTEST RANGE ===
FromMonth = input(defval = 10, title = "From Month", minval = 1)
FromDay   = input(defval = 3, title = "From Day", minval = 1)
FromYear  = input(defval = 2017, title = "From Year", minval = 2014)
ToMonth   = input(defval = 1, title = "To Month", minval = 1)
ToDay     = input(defval = 1, title = "To Day", minval = 1)
ToYear    = input(defval = 9999, title = "To Year", minval = 2014)
// ===  BACKTEST END  ===
backtestdaterange = (time > timestamp(FromYear, FromMonth, FromDay, 00, 00))

rsioverbought = input(90, minval=1, title="RSI % start overbought")
rsioversold = input(10, minval=1, title="RSI % start oversold")
up = rma(max(change(src), 0), len)
down = rma(-min(change(src), 0), len)
rsi = down == 0 ? 100 : up == 0 ? 0 : 100 - (100 / (1 + up / down))
ma = exponential ? ema(rsi, maLen) : sma(rsi, maLen)
rsimacrossup = cross(rsi,ma) and rsi > ma
rsimacrossdown = cross(rsi,ma) and rsi < ma
plotchar(rsimacrossup, char='⇧', location = location.belowbar, color = green, text = "", textcolor = green, size=size.small)
plotchar(rsimacrossdown, char='⇩', location = location.abovebar, color = red, text = "", textcolor = red, size=size.small)
plotchar(rsi > rsioverbought, char='x', location = location.belowbar, color = aqua, text = "", textcolor = red, size=size.small)
plotchar(rsi < rsioversold, char='x', location = location.belowbar, color = aqua, text = "", textcolor = red, size=size.small)


closetrade = rsimacrossup or rsimacrossdown
strategy.close_all(closetrade)
strategy.close_all((rsi > rsioverbought) or (rsi < rsioversold))
strategy.entry("Short Overbought",strategy.short, when=(rsi > rsioverbought) and backtestdaterange)
strategy.entry("Buy Overbought",strategy.long, when=(rsi < rsioversold) and backtestdaterange)
strategy.entry("Long Cross", strategy.long, when=rsimacrossup and backtestdaterange)
strategy.entry("Short Cross", strategy.short, when=rsimacrossdown and backtestdaterange)
Published by ChaoZhang on the FMZ strategy square · last modified 2023-12-21. Collected in the Quant Trading Vault. Unvalidated research: re-test with your own data and costs before trusting it.
Build this with AgenKit
A spec is not a trading system. Paste this into your coding agent and AgenKit runs a specialist team — architecture, test-first build, risk gates, review — with paper trading on by default.
/agenkit build a production-grade trading bot with a backtest engine, risk controls and paper trading by default from strategies/Relative-Strength-Index-and-Moving-Average-Crossover-Strategy.md- npx agenkit install engineering-kit in your project
- Paste the command into your agent and approve each phase
- Get tests, backtest, risk controls and a paper-trading switch
Understand it first
Before you run this, read the lesson behind the idea and how to backtest it honestly. Specs like this one are the survivors of an unknown number of trials; deflate their results accordingly.
Related specs
- Bollinger Bands and RSI Trend Following StrategyPine Script · Trend following · 1h
- Dual ATR Channel Trend Following StrategyPine Script · Trend following · 15m
- Dual Mode Adaptive Trend Trading Strategy EMA Crossover with ATR Volatility Based Risk Management SystemPine Script · Trend following · 1d
- Dynamic Dual EMA Crossover Strategy with Adaptive Profit Loss ControlPine Script · Trend following · 1d
- Dynamic Signal Line Trend Following and Volatility Filtering StrategyPine Script · Trend following · 1h
- EMA AROON ASHPine Script · Trend following · 3m