RSI and Bollinger Bands Profitable Strategy
This strategy mainly uses the RSI indicator and Bollinger Bands to design trading rules and make profits in trending markets. It goes long when RSI is below overbought line and price is near the Bollinger Bands lower…
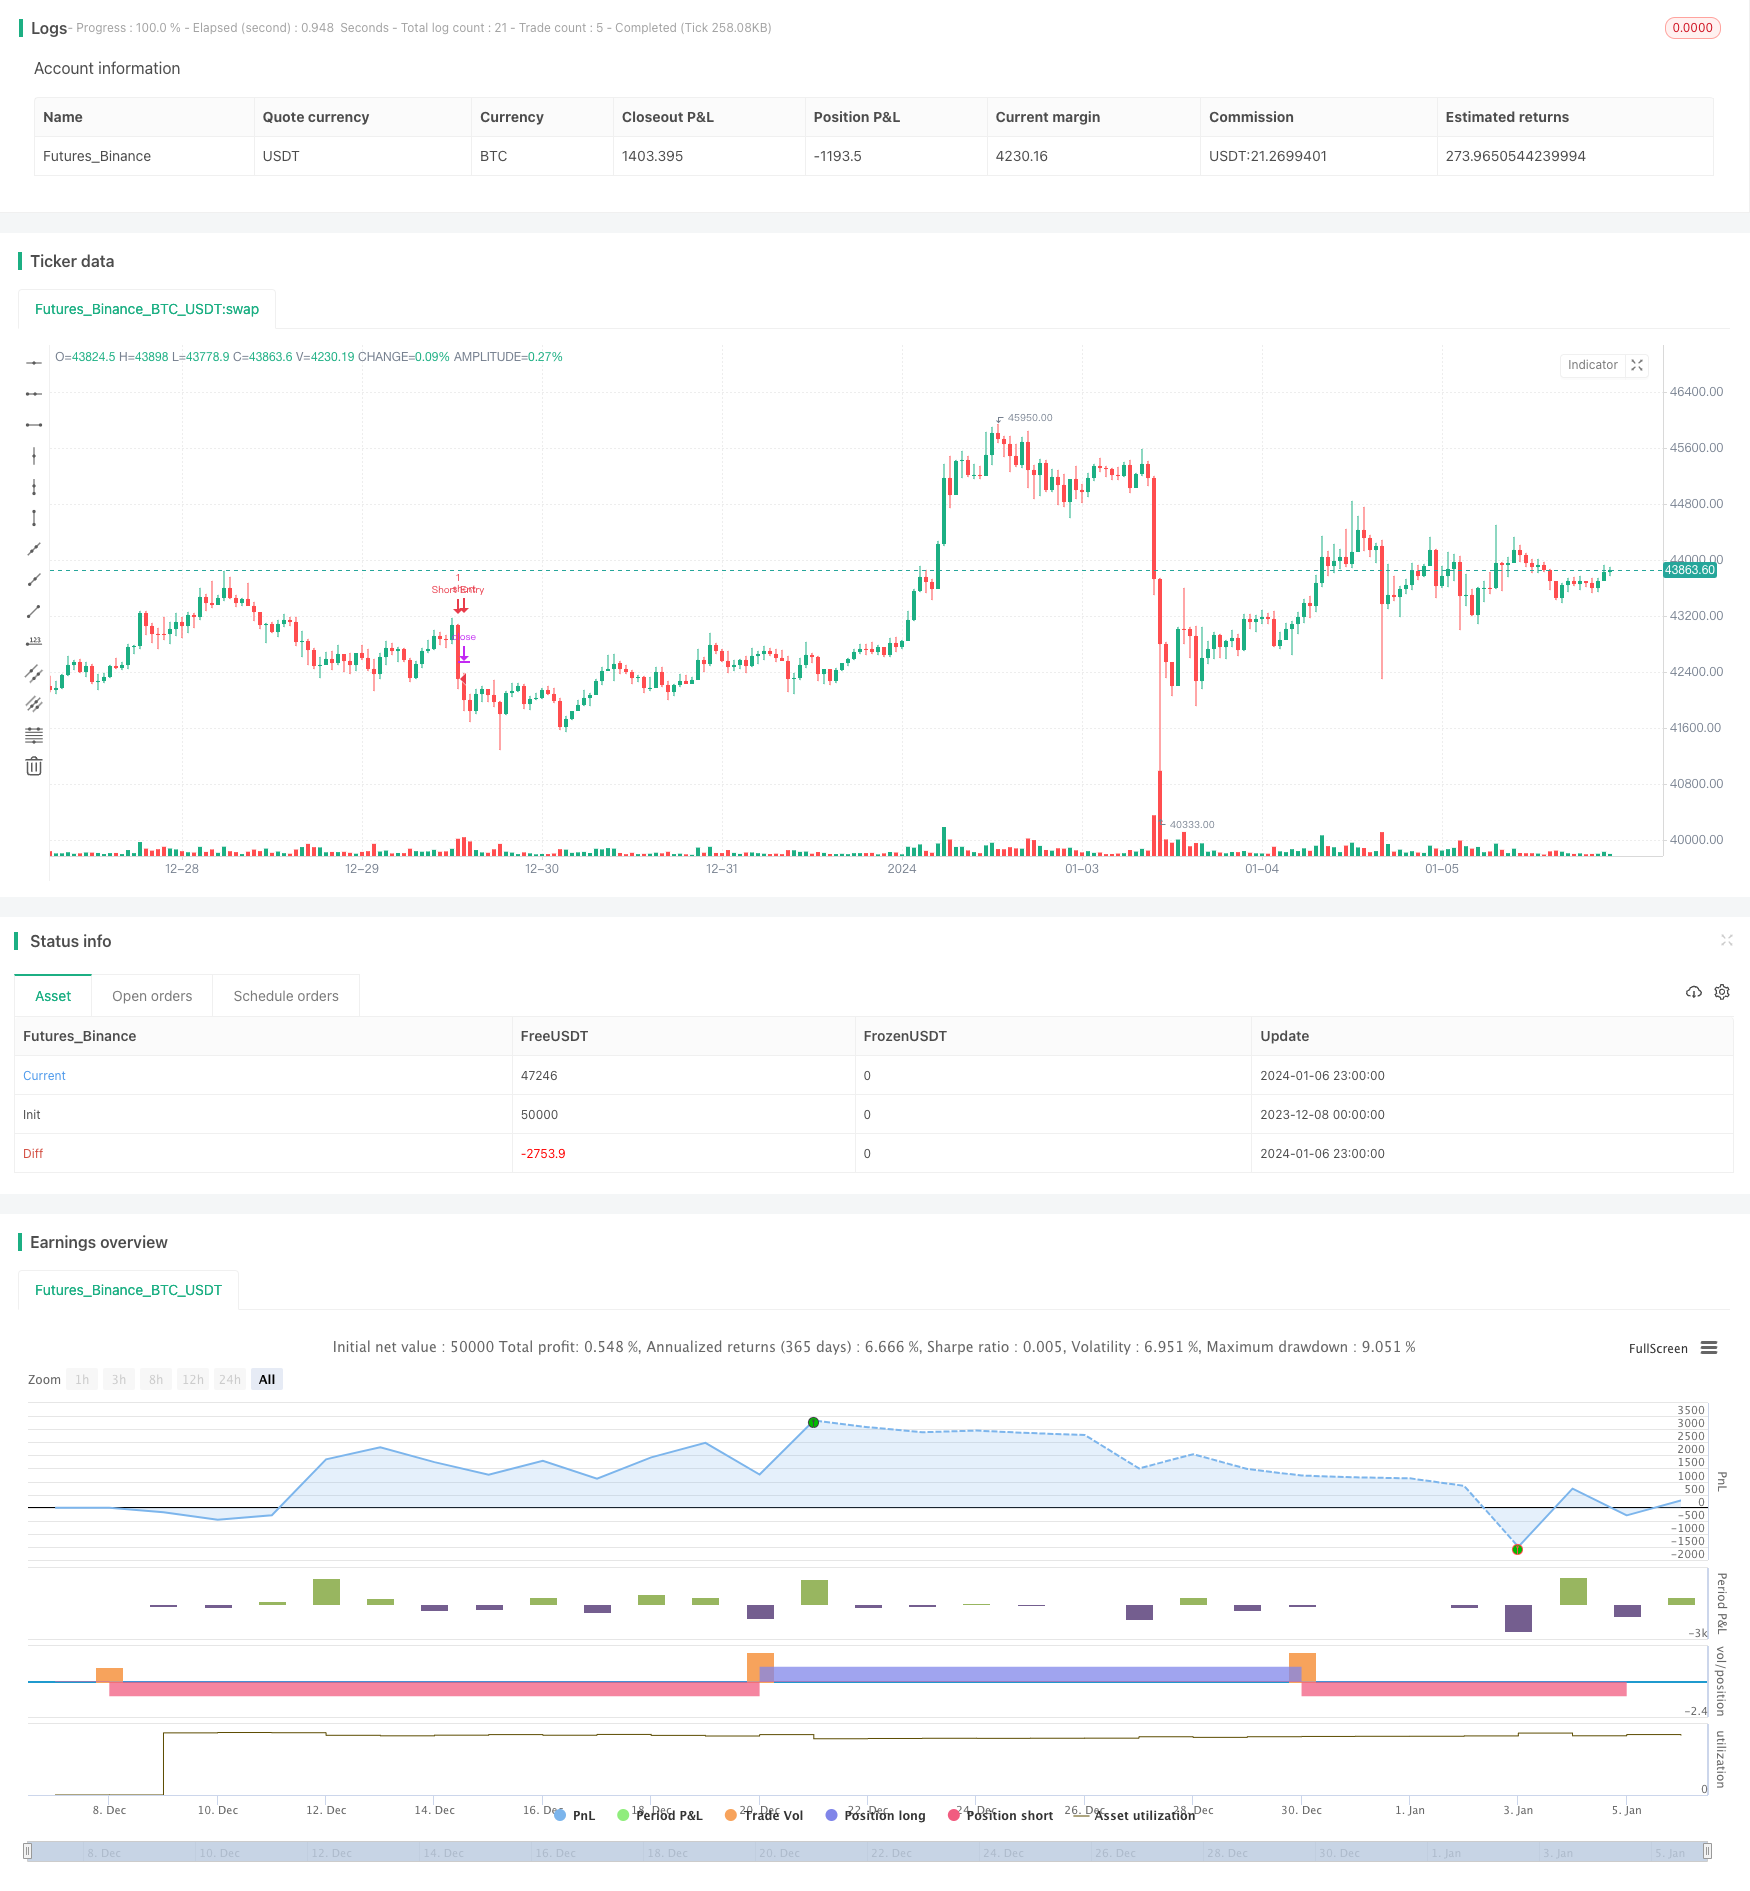
Overview
This strategy mainly uses the RSI indicator and Bollinger Bands to design trading rules and make profits in trending markets. It goes long when RSI is below overbought line and price is near the Bollinger Bands lower band; it goes short when RSI is above oversold line and price is near the upper band. This is the basic trading logic.
Strategy Logic
The strategy uses RSI indicator to identify overbought and oversold levels. RSI below the overbought threshold is considered oversold signal, while above oversold threshold is overbought signal. Bollinger Bands indicator is used to detect price breakouts. Upward breakout of the lower band is long signal, while downward breakout of upper band is short signal.
The strategy combines RSI for gauging market sentiment and Bollinger Bands for detecting price breakout. Trades are opened only when both conditions are met simultaneously. This helps filter out fake signals and improves strategy performance.
Strengths
The strategy combines RSI and Bollinger Bands, which helps better determine market trend and capture momentum. Compared to single indicator strategies, it filters out more false signals and generates higher quality signals. RSI gauges overbought/oversold levels, while BB catches trend after the breakout. Together they work very effectively.
The strategy opens trades only when both RSI and BB give signals simultaneously. This avoids interference from fake signals. With stop loss in pace, risks can also be controlled when market turns around.
Risks Analysis
Although the strategy filters out some false signals, RSI and BB may still give out wrong signals simultaneously in ranging markets, causing unnecessary losses. Inappropriate parameter settings may also lead to poor strategy performance.
It's recommended to optimize parameters through backtesting to find the best parameter combination. Also, consider pausing trading in ranging markets to avoid unnecessary losses. In addition, use stop loss properly to control single trade loss.
Improvement Areas
The strategy can be improved in the following aspects:
Optimize RSI and BB parameters for best combination
Add other indicators as filter signals, like MACD, KD etc
Add breakthrough validation to avoid false breakouts
Adjust parameters or stop trading per different market conditions
Optimize stop loss for dynamic stop loss
Conclusion
The strategy combines RSI and Bollinger Bands to design trading rules. By only taking signals when both agree, fake signals can be filtered out effectively. Through parameter optimization, adding signal filters, stop loss optimization etc., this strategy can be constantly refined for more stable profits.
Parameters
| Name | Default | What it controls |
|---|---|---|
| v_input_1 | 16 | RSI Period Length |
| v_input_2 | 45 | RSI Value Range |
| v_input_3 | 20 | Bollinger Bands SMA Period Length |
| v_input_4 | 2 | Bollinger Bands Standard Deviation |
Source Pine Script
/*backtest
start: 2023-12-08 00:00:00
end: 2024-01-07 00:00:00
period: 1h
basePeriod: 15m
exchanges: [{"eid":"Futures_Binance","currency":"BTC_USDT"}]
*/

//@version=5
strategy("Get Funded Easily by mjanusic", shorttitle="FTMO Crusher by mjanusic", overlay=true)

///////////// RSI
RSIlength = input(16, title="RSI Period Length")
RSIvalue = input(45, title="RSI Value Range")
RSIoverSold = 0 + RSIvalue
RSIoverBought = 100 - RSIvalue
price = close
vrsi = ta.rsi(price, RSIlength)

///////////// Bollinger Bands
BBlength = input(20, title="Bollinger Bands SMA Period Length")
BBmult = input(2.0, title="Bollinger Bands Standard Deviation")
BBbasis = ta.sma(price, BBlength)
BBdev = BBmult * ta.stdev(price, BBlength)
BBupper = BBbasis + BBdev
BBlower = BBbasis - BBdev
source = close
buyCondition = ta.crossover(vrsi, RSIoverSold) and ta.crossover(source, BBlower)
sellCondition = ta.crossunder(vrsi, RSIoverBought) and ta.crossunder(source, BBupper)

///////////// RSI + Bollinger Bands Strategy
if (not na(vrsi))
    if (buyCondition)
        strategy.entry("Long Entry", strategy.long, stop=BBlower, comment="Long Entry")
    else
        strategy.cancel(id="Long Entry")

    if (sellCondition)
        strategy.entry("Short Entry", strategy.short, stop=BBupper, comment="Short Entry")
    else
        strategy.cancel(id="Short Entry")

//plot(strategy.equity, title="equity", color=color.red, linewidth=2, style=plot.style_area)
Published by ChaoZhang on the FMZ strategy square · last modified 2024-01-08. Collected in the Quant Trading Vault. Unvalidated research: re-test with your own data and costs before trusting it.
Build this with AgenKit
A spec is not a trading system. Paste this into your coding agent and AgenKit runs a specialist team — architecture, test-first build, risk gates, review — with paper trading on by default.
/agenkit build a production-grade trading bot with a backtest engine, risk controls and paper trading by default from strategies/RSI-and-Bollinger-Bands-Profitable-Strategy.md- npx agenkit install engineering-kit in your project
- Paste the command into your agent and approve each phase
- Get tests, backtest, risk controls and a paper-trading switch
Understand it first
Before you run this, read the lesson behind the idea and how to backtest it honestly. Specs like this one are the survivors of an unknown number of trials; deflate their results accordingly.
Related specs
- Bollinger Bands Dynamic Breakout StrategyPine Script · Breakout · 1h
- Cross boundary Dynamic Range Quantitative Trading Strategy Based on Bollinger BandsPine Script · Breakout · 3h
- Momentum Breakout Moving Average StrategyPine Script · Breakout · 1d
- Momentum Breakout Trading Strategy 440964Pine Script · Breakout · 5m
- Moving Average Crossover and Upper Rail Breakthrough Impulse StrategyPine Script · Breakout · 1m
- Multi Indicator Bollinger Bands Trading StrategyPine Script · Breakout · 2h