Strategy vault / Trend following
RSI and EMA Based Trend Following Strategy
This strategy combines the Relative Strength Index (RSI) and Exponential Moving Average (EMA) technical indicators to implement a quantitative trading strategy based on trend following. It is mainly suitable for…
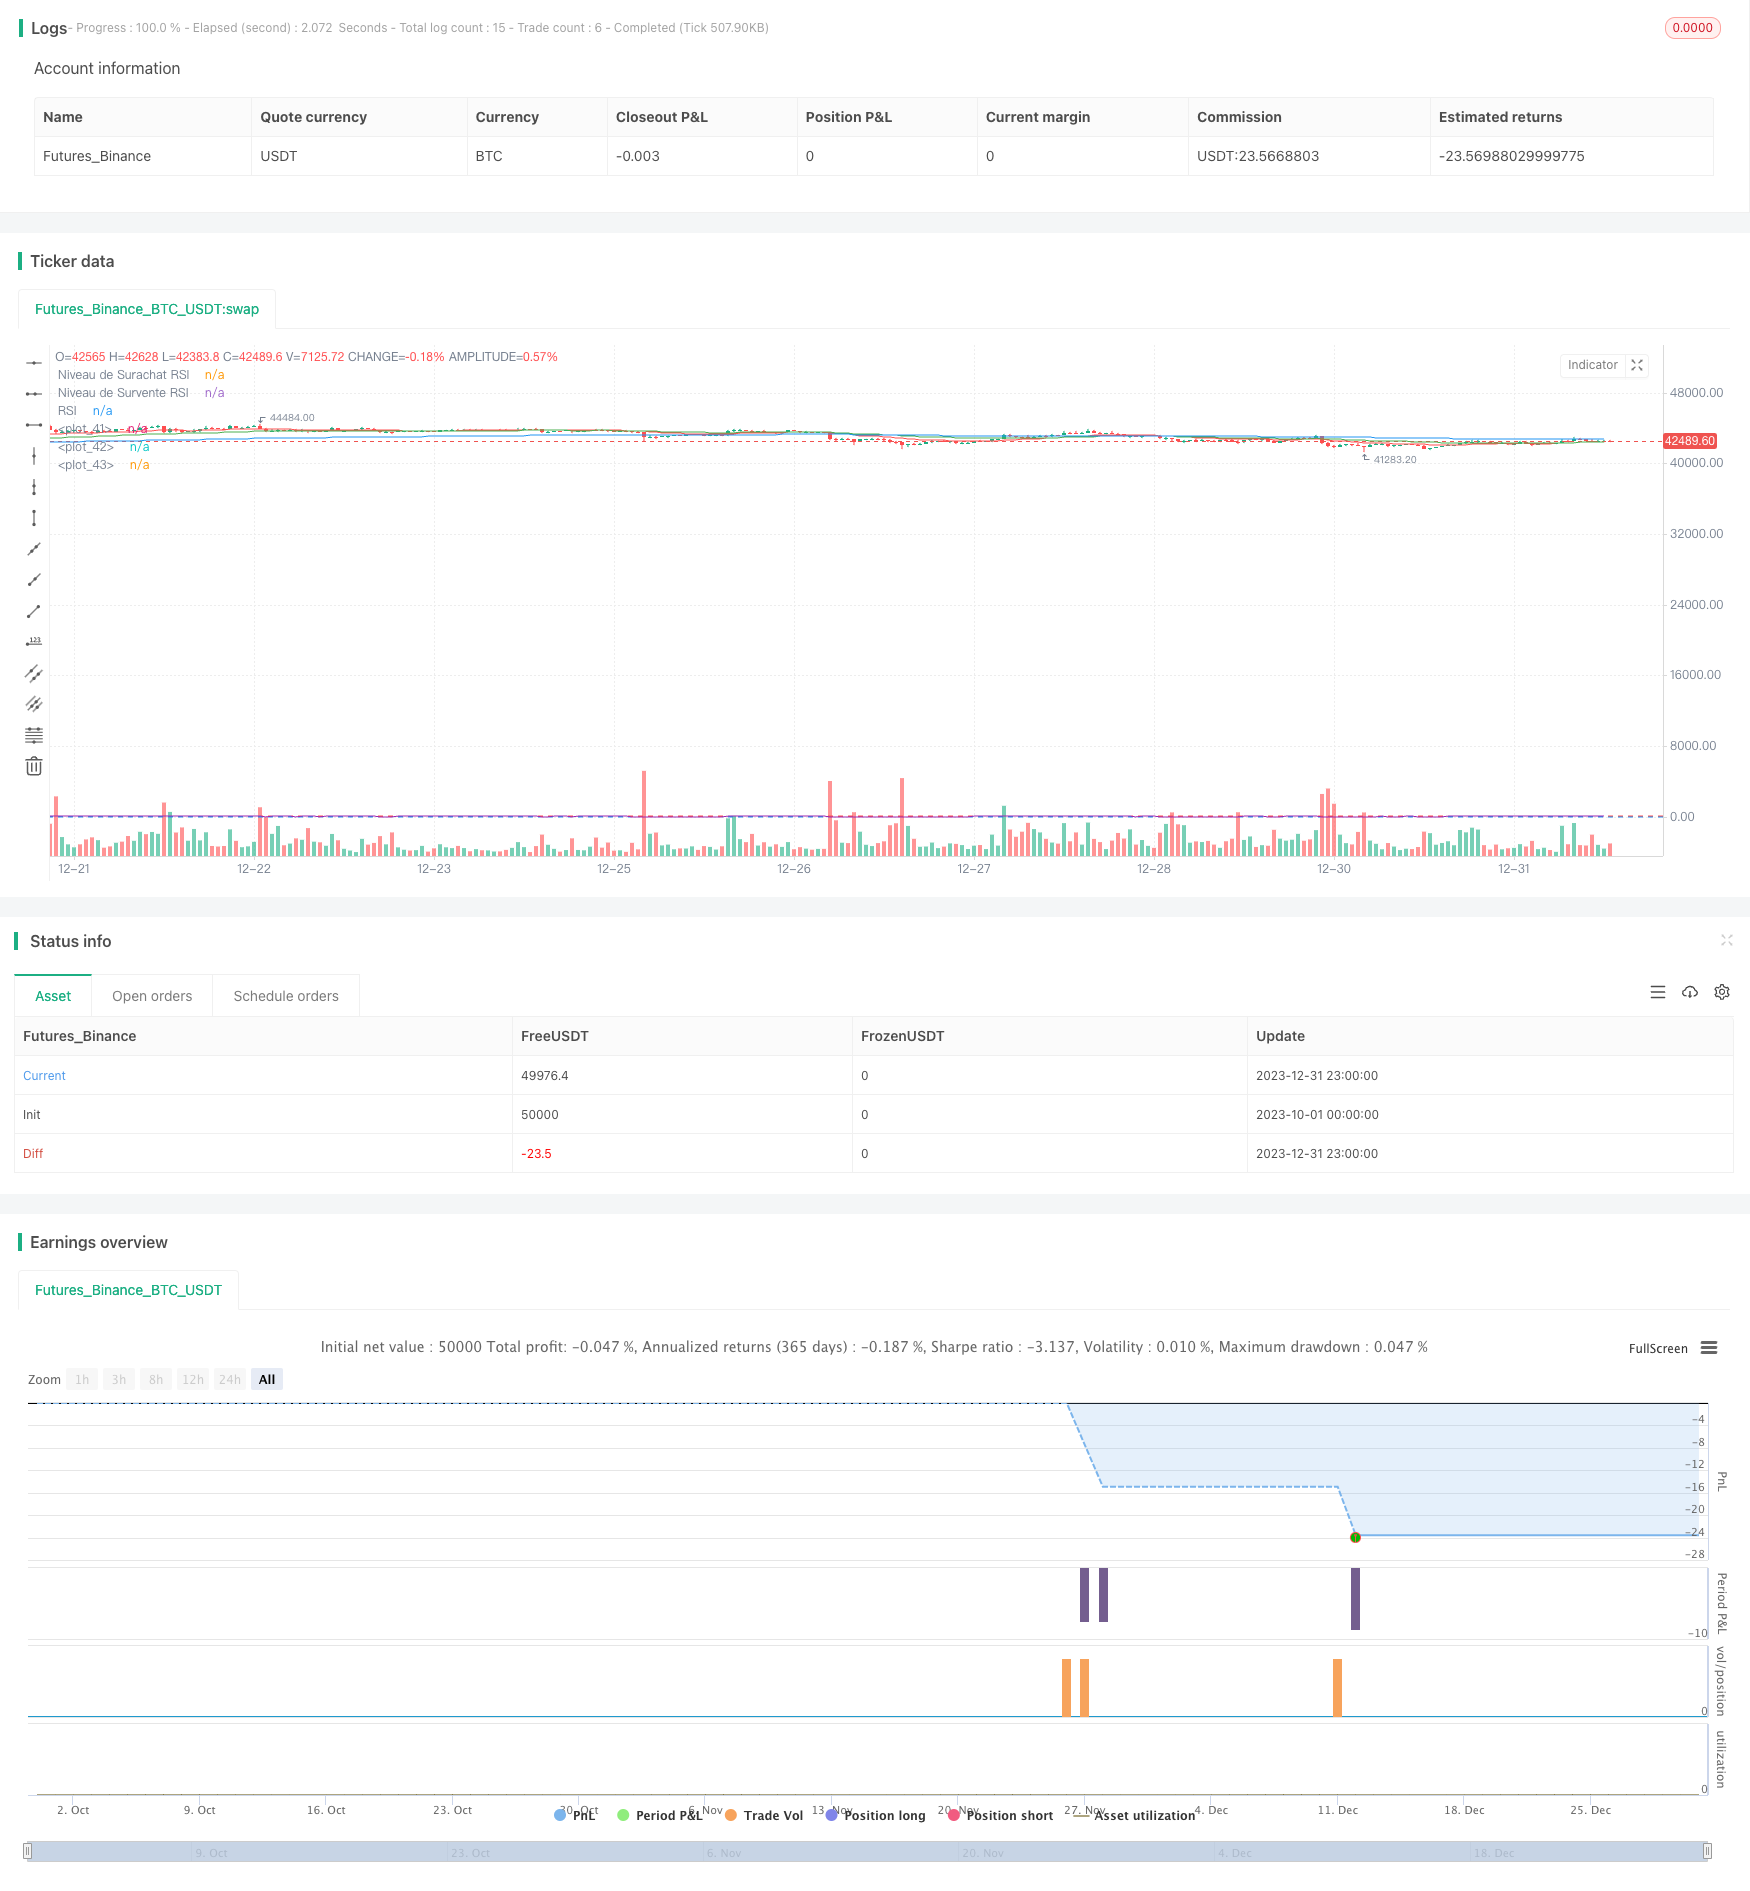
Overview
This strategy combines the Relative Strength Index (RSI) and Exponential Moving Average (EMA) technical indicators to implement a quantitative trading strategy based on trend following. It is mainly suitable for trending markets, entering when price reversals are identified to profit from the trend.
Strategy Logic
Indicator Selection
- EMA to determine current trend direction. The strategy uses 20-day, 50-day and 200-day EMA. When price is above these EMAs, an uptrend is identified.
- RSI to identify overbought/oversold levels. A standard 14-period RSI, with overbought threshold at 70 and oversold threshold at 30.
Entry Rules
Long entry signal:
- RSI below 30 level, indicating oversold conditions where price may rebound
- Price above either 20-day, 50-day or 200-day EMA, showing an upward trending market
When both criteria are met, a long position is entered.
Risk Management
Maximum loss for each trade is limited to 3% of total account value. Stop loss placement needs to consider market characteristics.
Position sizing at entry: Max Loss / (Entry Price - Stop Loss Price) = Position Size
This effectively controls per trade risk.
Exit Rules
Main exit signals:
- RSI rises above 70 level, price may fall due to overbought conditions
- Price drops below either 20-day, 50-day or 200-day EMA, trend reversal
When either signal occurs, the position is closed.
Advantage Analysis
The strategy combines the advantages of trend following and mean reversion. The EMA determines overall trend, then entry signals happen at potential reversal zones, benefiting from both trend and reversals for stability. RSI parameters can also be optimized for different markets, making the strategy robust.
The fixed max loss per trade protects capital by directly controlling trade risk level.
Risk Analysis
The strategy works well in obvious trending markets. In complex and volatile environments, using EMA for trend may have limitations. Also RSI has some lagging effect, needing confirmation from actual price action.
Stop loss placement is critical to PnL, needing careful testing for different markets. If too wide, single loss can expand; if too tight, noise may trigger unwanted stops. Live testing is required for ongoing optimization.
Optimization Directions
Testing different RSI parameters to fit more markets. Finding optimal trade size ratios. Adding other technical indicators to build more robust entry/exit systems. These are all options worth exploring.
Conclusion
The strategy integrates the strengths of trend following and mean reversion strategies. Entry happens on potential reversal while identifying the bigger trend. RSI optimization adapts it to more market regimes. The fixed trade risk level keeps operation stable over the medium to long term. Further improvements are possible through adjustments and robustness testing using different markets and styles.
Parameters
| Name | Default | What it controls |
|---|---|---|
| v_input_1 | 14 | Longueur du RSI |
| v_input_2 | 70 | Niveau de Surachat RSI |
| v_input_3 | 30 | Niveau de Survente RSI |
| v_input_4 | 0.03 | Risque par Trade (3%) |
| v_input_5 | true | Distance du Stop-Loss en pips |
Source Pine Script
/*backtest
start: 2023-10-01 00:00:00
end: 2023-12-31 23:59:59
period: 1h
basePeriod: 15m
exchanges: [{"eid":"Futures_Binance","currency":"BTC_USDT"}]
*/

//@version=4
strategy("Stratégie RSI et EMA avec Gestion du Risque", overlay=true)

// Paramètres de la stratégie
rsiLength = input(14, "Longueur du RSI")
rsiOverbought = input(70, "Niveau de Surachat RSI")
rsiOversold = input(30, "Niveau de Survente RSI")

// Calcul du RSI
rsiValue = rsi(close, rsiLength)

// Paramètres des EMA
ema20 = ema(close, 20)
ema50 = ema(close, 50)
ema200 = ema(close, 200)

// Paramètre du risque par trade
riskPerTrade = input(0.03, "Risque par Trade (3%)")

// Distance du stop-loss en pips (à ajuster selon votre stratégie)
stopLossPips = input(1, "Distance du Stop-Loss en pips")

// Calcul de la taille de position et du stop-loss
calculatePositionSize(entryPrice, stopLossPips) =>
    stopLossPrice = entryPrice - stopLossPips * syminfo.mintick
    riskPerTradeValue = strategy.equity * riskPerTrade
    positionSize = riskPerTradeValue / (entryPrice - stopLossPrice)
    positionSize

// Conditions d'entrée
longCondition = (rsiValue < rsiOversold) and (close > ema20 or close > ema50 or close > ema200)
if longCondition
    strategy.entry("Long", strategy.long, qty=1)

// Conditions de sortie
exitCondition = (rsiValue > rsiOverbought) or (close < ema20 or close < ema50 or close < ema200)
if exitCondition
    strategy.close("Long")

// Affichage des EMA et RSI sur le graphique
plot(ema20, color=color.red)
plot(ema50, color=color.green)
plot(ema200, color=color.blue)
hline(rsiOverbought, "Niveau de Surachat RSI", color=color.red)
hline(rsiOversold, "Niveau de Survente RSI", color=color.blue)
plot(rsiValue, "RSI", color=color.purple)
Published by ChaoZhang on the FMZ strategy square · last modified 2024-01-25. Collected in the Quant Trading Vault. Unvalidated research: re-test with your own data and costs before trusting it.
Build this with AgenKit
A spec is not a trading system. Paste this into your coding agent and AgenKit runs a specialist team — architecture, test-first build, risk gates, review — with paper trading on by default.
/agenkit build a production-grade trading bot with a backtest engine, risk controls and paper trading by default from strategies/RSI-and-EMA-Based-Trend-Following-Strategy.md- npx agenkit install engineering-kit in your project
- Paste the command into your agent and approve each phase
- Get tests, backtest, risk controls and a paper-trading switch
Understand it first
Before you run this, read the lesson behind the idea and how to backtest it honestly. Specs like this one are the survivors of an unknown number of trials; deflate their results accordingly.
Related specs
- Adaptive ATR and RSI Trend Following Strategy with Trailing Stop LossPine Script · Trend following · 1h
- Advanced Multi Indicator Multi Dimensional Trend Cross Quantitative StrategyPine Script · Trend following · 3h
- Bollinger Bands and RSI Trend Following StrategyPine Script · Trend following · 1h
- Dual ATR Channel Trend Following StrategyPine Script · Trend following · 15m
- Dual EMA Crossover with RSI Trend Confirmation StrategyPine Script · Trend following · 3h
- Dual Mode Adaptive Trend Trading Strategy EMA Crossover with ATR Volatility Based Risk Management SystemPine Script · Trend following · 1d