Strategy vault / Trend following
SMC EMA Strategy with PL Projections SMC
This strategy uses two exponential moving averages (EMAs) with different periods to determine the current market trend. When the fast EMA is above the slow EMA, it is considered a bullish trend, and conversely, when…
Overview
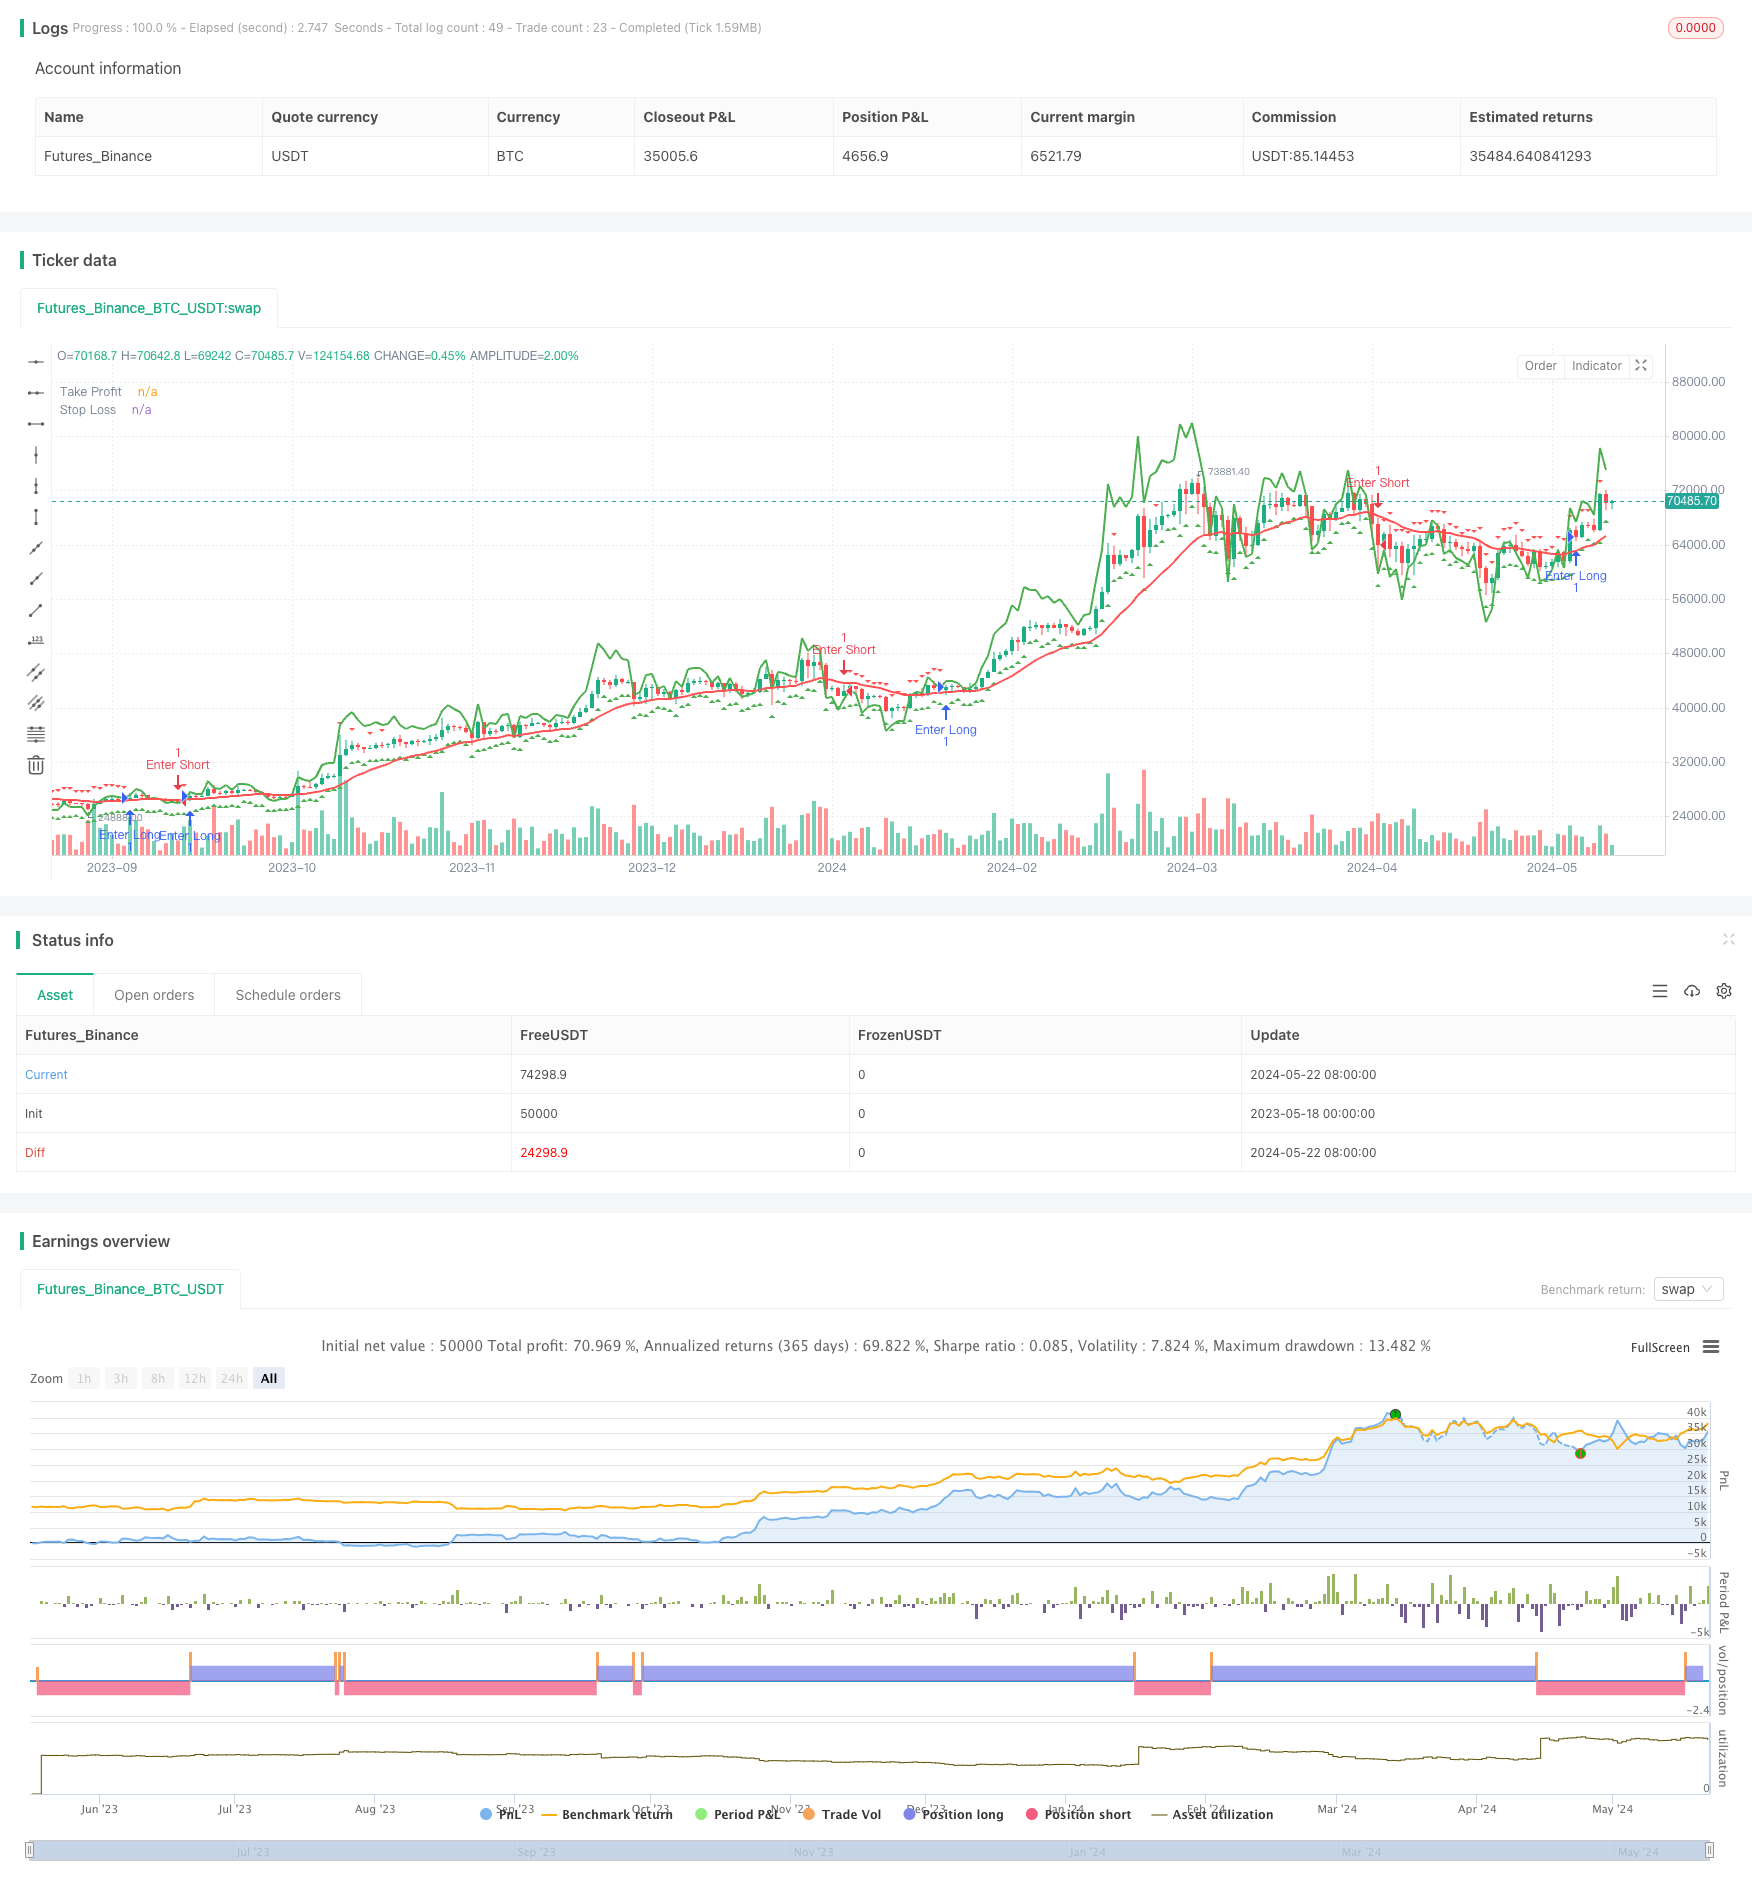
This strategy uses two exponential moving averages (EMAs) with different periods to determine the current market trend. When the fast EMA is above the slow EMA, it is considered a bullish trend, and conversely, when the fast EMA is below the slow EMA, it is considered a bearish trend. Additionally, the strategy calculates the risk-to-reward ratio and sets take profit and stop loss levels to help optimize risk management in trading.
Strategy Principle
The core principle of this strategy is to utilize EMAs with different periods to capture market trends. When the fast EMA (period of 10) is above the slow EMA (period of 20), the market is considered to be in an uptrend, and the strategy generates a buy signal. Conversely, when the fast EMA is below the slow EMA, the market is considered to be in a downtrend, and the strategy generates a sell signal.
Apart from trend identification, the strategy also introduces the concept of risk management. It evaluates the potential risk and reward of each trade by calculating the risk-to-reward ratio. Moreover, the strategy calculates take profit and stop loss levels based on the position of the EMAs to help limit potential losses and lock in profits.
Strategy Advantages
- Simple and effective: The strategy uses simple EMA crossovers to determine trends, making it easy to understand and implement.
- Risk management: By calculating the risk-to-reward ratio and setting take profit and stop loss levels, the strategy helps optimize risk management.
- Adaptability: The strategy can be adapted to different market conditions by adjusting the EMA periods and risk-to-reward ratio thresholds.
Strategy Risks
- False signals: In choppy markets or at trend turning points, EMA crossovers may generate false signals, leading to incorrect trading decisions.
- Lag: As a trend-following strategy, EMA crossovers may generate signals after the trend has already been established, missing early trading opportunities.
- Fixed stop loss: The strategy uses fixed stop loss levels, which may lead to frequent stop-outs in highly volatile markets, impacting strategy performance.
Strategy Optimization Directions
- Incorporate other indicators: Combine other technical indicators such as RSI, MACD, etc., to improve the reliability and accuracy of signals.
- Dynamic stop loss: Adjust stop loss levels dynamically based on market volatility or indicators like ATR to better adapt to market changes.
- Parameter optimization: Through backtesting and optimization, find the optimal EMA periods and risk-to-reward ratio thresholds to enhance strategy performance.
Summary
This strategy uses EMA crossovers to identify trends and introduces risk management concepts, providing traders with a simple yet effective trading framework. Although the strategy may face risks such as false signals and lag, further improvements can be made by incorporating other indicators, implementing dynamic stop losses, and optimizing parameters. Overall, it is a strategy worth further research and optimization.
Source Pine Script
/*backtest
start: 2023-05-18 00:00:00
end: 2024-05-23 00:00:00
period: 1d
basePeriod: 1h
exchanges: [{"eid":"Futures_Binance","currency":"BTC_USDT"}]
*/

//@version=5
strategy("SMC & EMA Strategy with P&L Projections", shorttitle="SMC-EMA", overlay=true)

// Define EMAs
ema_fast = ta.ema(close, 10)
ema_slow = ta.ema(close, 20)

// Calculate SMC conditions (you can adjust these based on your understanding)
is_bullish = ema_fast > ema_slow
is_bearish = ema_fast < ema_slow

// Draw order blocks
plotshape(is_bullish, style=shape.triangleup, location=location.belowbar, color=color.green, size=size.small, title="Buy Signal")
plotshape(is_bearish, style=shape.triangledown, location=location.abovebar, color=color.red, size=size.small, title="Sell Signal")

// Calculate risk-to-reward ratio
entry_price = close
take_profit = entry_price + (entry_price - ema_slow)  // Example: 1:1 risk-to-reward
stop_loss = entry_price - (entry_price - ema_slow)

// Calculate P&L
profit = take_profit - entry_price
loss = entry_price - stop_loss
risk_reward_ratio = profit / loss

// Display alerts
alertcondition(is_bullish, title="Buy Alert", message="Smart Money Buy Signal")
alertcondition(is_bearish, title="Sell Alert", message="Smart Money Sell Signal")

// Plot take profit and stop loss levels
plot(take_profit, color=color.green, linewidth=2, title="Take Profit")
plot(stop_loss, color=color.red, linewidth=2, title="Stop Loss")

// Draw risk-to-reward ratio
plotshape(risk_reward_ratio >= 1 ? 1 : 0, style=shape.triangleup, location=location.belowbar, color=color.green, size=size.small, title="Risk-Reward Ratio (Green)")
plotshape(risk_reward_ratio < 1 ? 1 : 0, style=shape.triangledown, location=location.abovebar, color=color.red, size=size.small, title="Risk-Reward Ratio (Red)")


if is_bullish
    strategy.entry("Enter Long", strategy.long)
else if is_bearish
    strategy.entry("Enter Short", strategy.short)
Published by ChaoZhang on the FMZ strategy square · last modified 2024-05-24. Collected in the Quant Trading Vault. Unvalidated research: re-test with your own data and costs before trusting it.
Build this with AgenKit
A spec is not a trading system. Paste this into your coding agent and AgenKit runs a specialist team — architecture, test-first build, risk gates, review — with paper trading on by default.
/agenkit build a production-grade trading bot with a backtest engine, risk controls and paper trading by default from strategies/SMC-EMA-Strategy-with-PL-Projections-SMC.md- npx agenkit install engineering-kit in your project
- Paste the command into your agent and approve each phase
- Get tests, backtest, risk controls and a paper-trading switch
Understand it first
Before you run this, read the lesson behind the idea and how to backtest it honestly. Specs like this one are the survivors of an unknown number of trials; deflate their results accordingly.
Related specs
- Adaptive ATR and RSI Trend Following Strategy with Trailing Stop LossPine Script · Trend following · 1h
- Bollinger Bands and RSI Trend Following StrategyPine Script · Trend following · 1h
- Dual ATR Channel Trend Following StrategyPine Script · Trend following · 15m
- Dynamic Dual EMA Crossover Strategy with Adaptive Profit Loss ControlPine Script · Trend following · 1d
- EMA and RSI Trend Trading StrategyPine Script · Trend following · 1d
- Fixed Range Volume Profile And Anchored VWAP Trend Identification Strategy With Dynamic Stop LossPine Script · Trend following · 1h