Strategy vault / Trend following
Solid and Steady SMA Position Holding Strategy
This strategy is a simple position holding strategy based on SMA lines. It goes long when the short term SMA line crosses over the long term SMA line, and closes position when the short term SMA line crosses below…
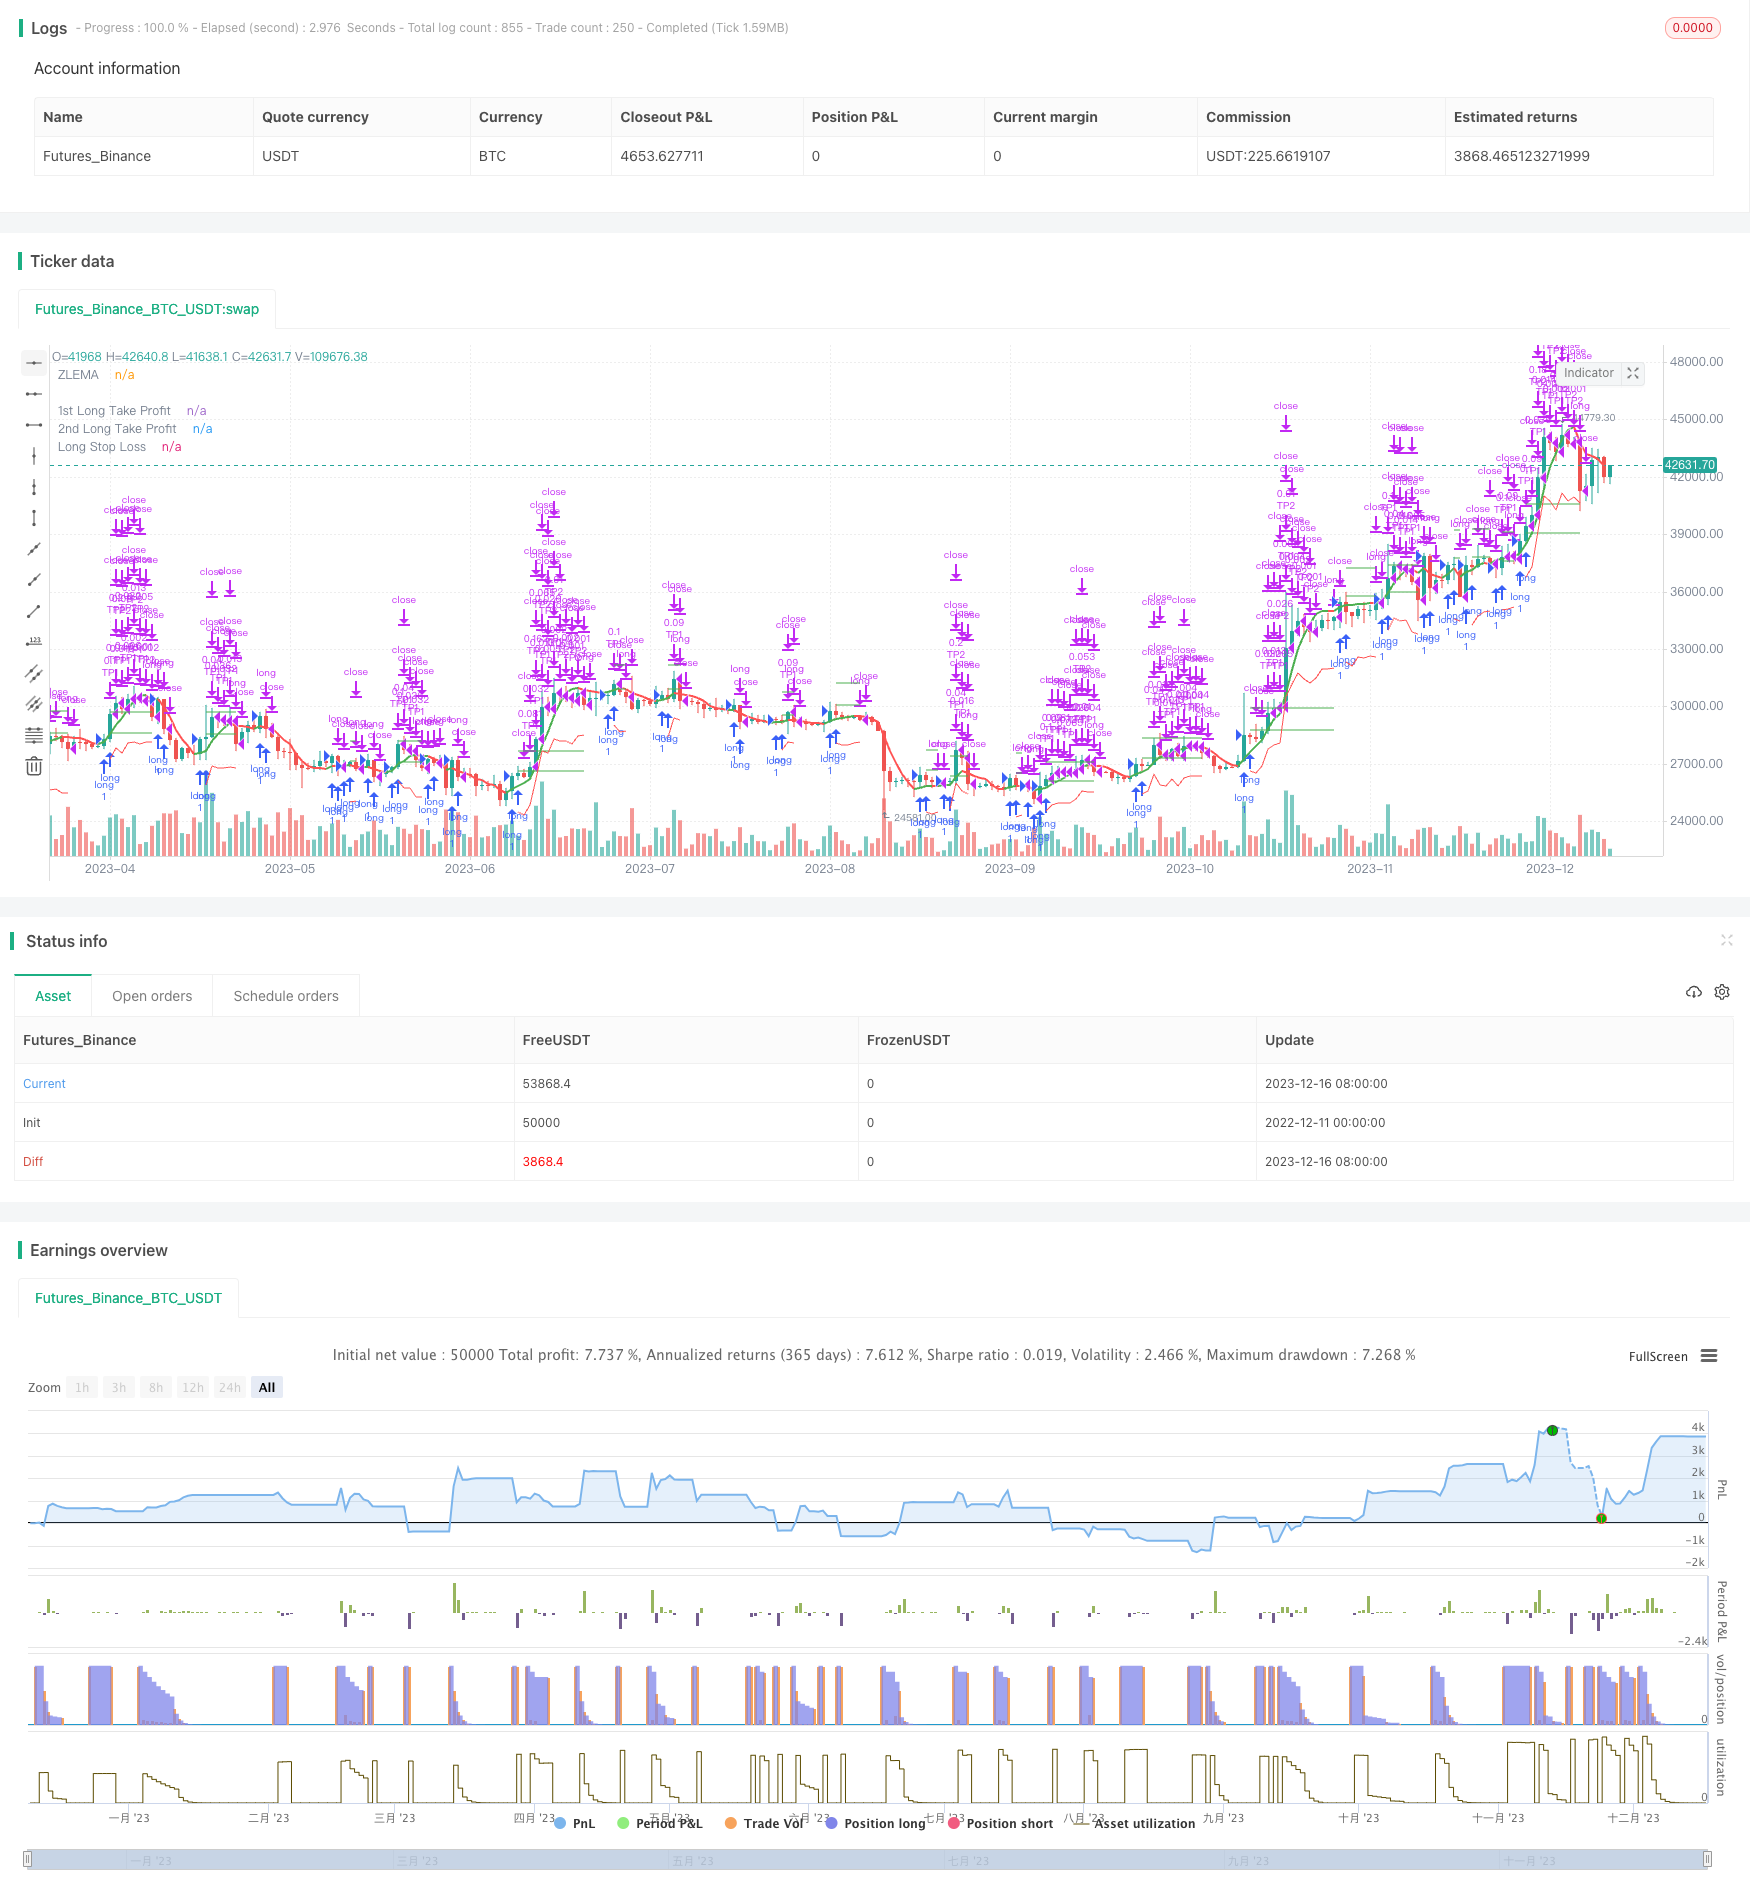
Overview
This strategy is a simple position holding strategy based on SMA lines. It goes long when the short term SMA line crosses over the long term SMA line, and closes position when the short term SMA line crosses below the long term SMA line.
Strategy Principle
The strategy uses two SMA lines, one short term 20-day line and one long term 50-day line. The short term line can catch price trend changes faster, while the long term line filters out short term noise. When the short term line rises quickly above the long term line, it indicates the trend may have started a long term upturn, so we go long here. When the short term line drops below the long term line, it suggests the uptrend may have ended, so we close position here.
In summary, this strategy utilizes the curve features of SMA lines to determine price movement trends on two time dimensions, and makes stable profits with relatively steady position holding.
Advantage Analysis
The advantages of this strategy include:
- Simple to operate, easy to understand, low barrier to use
- Relatively stable by leveraging the strengths of SMA lines
- Long holding periods, less impacted by short term market noise
- Few configurable parameters, easy to find optimal parameter combinations
Risk Analysis
The risks of this strategy include:
- More stop losses possible when prolonged range-bound markets
- SMA lines have lagging effect, cannot catch immediate price changes
- Unable to capitalize on short term spike pullback patterns
- Unable to control single trade loss size
Optimization Directions
This strategy can be further optimized in the following aspects:
- Add MACD indicator to identify bottom rebound timing for less losses during range-bound markets
- Test different SMA line parameter combinations to find optimal
- Incorporate domestic indicators for spotting trend divergence, improving entry accuracy
- Add profit taking and stop loss mechanisms to control per trade profit/loss
Summary
In summary, this SMA position holding strategy is stable, simple and easy to operate, suitable for beginner live trading. As algo trading keeps evolving, this strategy can incorporate more indicators and techniques for better performance.
Parameters
| Name | Default | What it controls |
|---|---|---|
| v_input_1 | 14 | Length |
| v_input_2 | true | Highlight Movements ? |
| v_input_3_close | 0 | Source: close | high | low | open | hl2 | hlc3 | hlcc4 | ohlc4 |
| v_input_float_1 | true | Long Take Profit 1 % |
| v_input_int_1 | 10 | Long Take Profit 1 Qty |
| v_input_float_2 | 5 | Long Take Profit 2% |
| v_input_int_2 | 50 | Long Take Profit 2 Qty |
| v_input_float_3 | 2.2 | SL Mutiplier |
| v_input_int_3 | 17 | ATR period |
| v_input_4 | 2022 | Backtest Start Year |
| v_input_5 | true | Backtest Start Month |
| v_input_6 | true | Backtest Start Day |
| v_input_7 | 9999 | Backtest Stop Year |
| v_input_8 | 12 | Backtest Stop Month |
| v_input_9 | 31 | Backtest Stop Day |
Source Pine Script
/*backtest
start: 2022-12-11 00:00:00
end: 2023-12-17 00:00:00
period: 1d
basePeriod: 1h
exchanges: [{"eid":"Futures_Binance","currency":"BTC_USDT"}]
*/

//@version=5
strategy('Zlema Strateg Long 5m', overlay=true )

// FUNCTIONS

Atr(p) =>
    atr = 0.
    Tr = math.max(high - low, math.max(math.abs(high - close[1]), math.abs(low - close[1])))
    atr := nz(atr[1] + (Tr - atr[1]) / p, Tr)
    atr

// ZLEMA
length = input(title='Length', defval=14)
highlightMovements = input(title='Highlight Movements ?', defval=true)
src = input(title='Source', defval=close)

lag = math.floor((length - 1) / 2)

zlema = ta.ema(src + src - src[lag], length)

zlemaColor = highlightMovements ? zlema > zlema[1] ? color.green : color.red : #6d1e7f
plot(zlema, title='ZLEMA', linewidth=2, color=zlemaColor, transp=0)


// TAKE PROFIT AND STOP LOSS
long_tp1_inp = input.float(1, title='Long Take Profit 1 %', step=0.1) / 100
long_tp1_qty = input.int(10, title='Long Take Profit 1 Qty', step=1)

long_tp2_inp = input.float(5, title='Long Take Profit 2%', step=0.1) / 100
long_tp2_qty = input.int(50, title='Long Take Profit 2 Qty', step=1)

long_take_level_1 = strategy.position_avg_price * (1 + long_tp1_inp)
long_take_level_2 = strategy.position_avg_price * (1 + long_tp2_inp)


// Stop Loss
multiplier = input.float(2.2, 'SL Mutiplier', minval=1, step=0.1)
ATR_period = input.int(17, 'ATR period', minval=1, step=1)

// Strategy
entry_long = zlema > zlema[1]
entry_price_long = ta.valuewhen(entry_long, close, 0)
SL_floating_long = entry_price_long - multiplier * Atr(ATR_period)
exit_long = zlema < zlema[1]

///// BACKTEST PERIOD ///////
testStartYear = input(2022, 'Backtest Start Year')
testStartMonth = input(1, 'Backtest Start Month')
testStartDay = input(1, 'Backtest Start Day')
testPeriodStart = timestamp(testStartYear, testStartMonth, testStartDay, 0, 0)

testStopYear = input(9999, 'Backtest Stop Year')
testStopMonth = input(12, 'Backtest Stop Month')
testStopDay = input(31, 'Backtest Stop Day')
testPeriodStop = timestamp(testStopYear, testStopMonth, testStopDay, 0, 0)

testPeriod() =>
    time >= testPeriodStart and time <= testPeriodStop ? true : false

if testPeriod()
    strategy.entry('long', strategy.long, comment='Long', when=entry_long)
    strategy.exit('TP1', 'long', qty_percent=long_tp1_qty, limit=long_take_level_1)  //, trail_points=entry_price_long * long_trailing / syminfo.mintick, trail_offset=entry_price_long * long_trailing / syminfo.mintick)
    strategy.exit('TP2', qty_percent=long_tp2_qty, limit=long_take_level_2)  //, trail_points=entry_price_long * long_trailing / syminfo.mintick, trail_offset=entry_price_long * long_trailing / syminfo.mintick)
    strategy.close('long', when=exit_long, comment='exit long')


// LONG POSITION
plot(strategy.position_size > 0 ? long_take_level_1 : na, style=plot.style_linebr, color=color.new(color.green, 0), linewidth=1, title='1st Long Take Profit')
plot(strategy.position_size > 0 ? long_take_level_2 : na, style=plot.style_linebr, color=color.new(color.green, 0), linewidth=1, title='2nd Long Take Profit')
plot(strategy.position_size > 0 ? SL_floating_long : na, style=plot.style_linebr, color=color.new(color.red, 0), linewidth=1, title='Long Stop Loss')


if testPeriod()
    strategy.entry('long', strategy.long, comment='Long', when=entry_long)


// LONG POSITIONplot(strategy.position_size > 0 ? SL_floating_long : na, style=plot.style_linebr, color=color.new(color.red, 0), linewidth=1, title='Long Stop Loss')
Published by ChaoZhang on the FMZ strategy square · last modified 2023-12-18. Collected in the Quant Trading Vault. Unvalidated research: re-test with your own data and costs before trusting it.
Build this with AgenKit
A spec is not a trading system. Paste this into your coding agent and AgenKit runs a specialist team — architecture, test-first build, risk gates, review — with paper trading on by default.
/agenkit build a production-grade trading bot with a backtest engine, risk controls and paper trading by default from strategies/Solid-and-Steady-SMA-Position-Holding-Strategy.md- npx agenkit install engineering-kit in your project
- Paste the command into your agent and approve each phase
- Get tests, backtest, risk controls and a paper-trading switch
Understand it first
Before you run this, read the lesson behind the idea and how to backtest it honestly. Specs like this one are the survivors of an unknown number of trials; deflate their results accordingly.
Related specs
- Bollinger Bands and RSI Trend Following StrategyPine Script · Trend following · 1h
- Dual ATR Channel Trend Following StrategyPine Script · Trend following · 15m
- Dual MA Crossover Trend Tracking StrategyPine Script · Trend following · 1h
- Dynamic Dual EMA Crossover Strategy with Adaptive Profit Loss ControlPine Script · Trend following · 1d
- EMA and RSI Trend Trading StrategyPine Script · Trend following · 1d
- Fixed Range Volume Profile And Anchored VWAP Trend Identification Strategy With Dynamic Stop LossPine Script · Trend following · 1h