Strategy vault / Trend following
This strategy makes trading decisions based on the trend of MACD Histogram
This strategy makes trading decisions based on the trend of MACD Histogram. It utilizes the upward and downward trends of Histogram to generate buy and sell signals. When the Histogram continues to rise or fall for a…
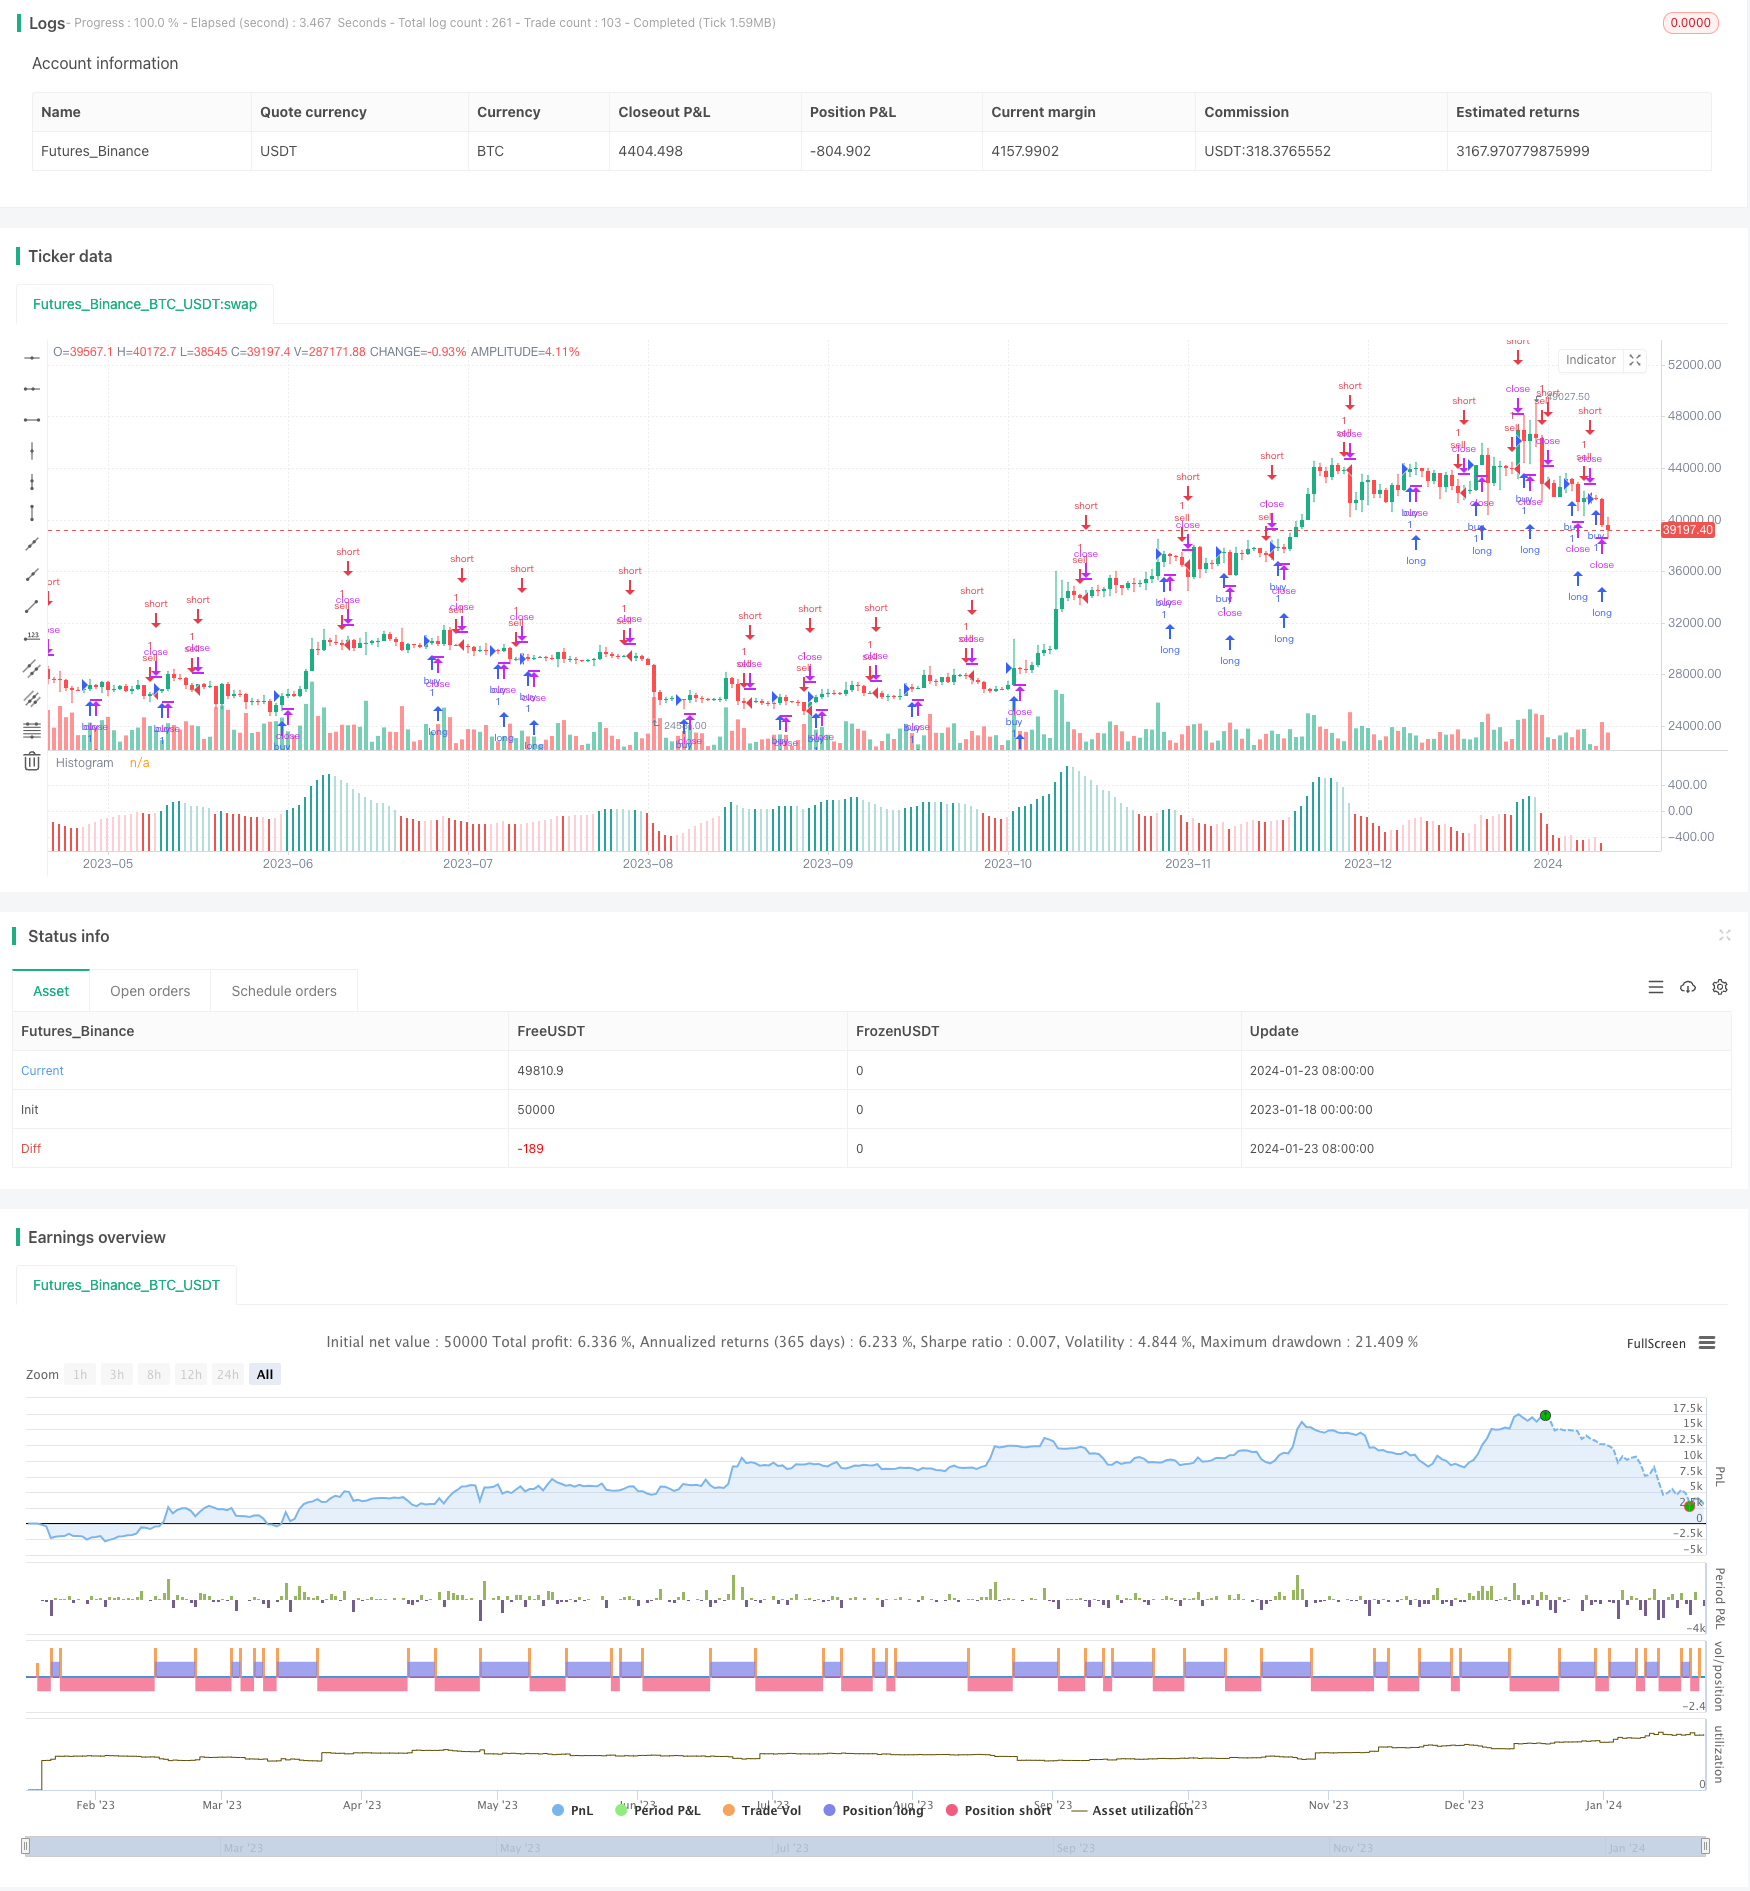
Overview
This strategy makes trading decisions based on the trend of MACD Histogram. It utilizes the upward and downward trends of Histogram to generate buy and sell signals. When the Histogram continues to rise or fall for a certain period, corresponding signals are generated.
Strategy Logic
The strategy uses the fast line, slow line and Histogram of the MACD indicator. First calculate the fast EMA and slow EMA. Then subtract slow EMA from fast EMA to get MACD, and subtract Signal which is the moving average of MACD to get Histogram.
When the Histogram continues to rise for the set period, a buy signal is generated. This indicates that MACD is accelerating to break through its signal line upward, predicting that prices may rise.
When the Histogram continues to decline for the set period, a sell signal is generated. This indicates that MACD is accelerating to break through its signal line downward, predicting that prices may fall.
Advantage Analysis
The strategy has the following advantages:
Utilizing the trending characteristic of MACD Histogram, it can capture the turning points of price changes and enhance profitability.
Combining with the condition of consecutive rise or fall of Histogram, some noisy trades can be filtered out to reduce unnecessary losses.
Allowing customization of MACD parameters and Histogram trend period, it can be adjusted to suit different products and trading sessions.
The strategy logic is simple and clear, easy to understand and modify, and also convenient to combine with other indicators or strategies.
Risk Analysis
The strategy also has some risks:
Wrong signals may occur when prices are oscillating in range. Trend indicators need to be combined to filter.
After Histogram rises or falls, MACD line may fail to break through the signal line, unable to profitably exit. Stop loss should be set to control risk.
Trading cost and slippage are not considered. Actual profit may decrease in live trading.
Improper parameter settings (e.g. MACD period, Histogram trend period) may worsen strategy performance. Parameters need to be optimized for products and sessions.
These risks can be controlled and reduced through methods like combining with trend indicators, setting stop loss mechanism, optimizing parameters etc.
Optimization Directions
The strategy can be optimized in the following aspects:
Combine other indicators to determine overall trend direction, avoiding trading in oscillating ranges. E.g. 20-day line for medium-long term trend.
Add stop loss mechanism. E.g. stop loss when MACD re-breaks signal line downwards.
Optimize MACD parameters to suit products of different frequencies. E.g. shorten period parameters for high-frequency data.
Optimize minimum period of consecutive Histogram rise or fall, balancing signal frequency and reliability.
Try logic of trailing signals after breakout failure. I.e. trailing reverse signal after Histogram reversal.
Combine other indicators like volume or volatility indicators to gauge market heat and filter signals.
Conclusion
In conclusion, the MACD Histogram Trend strategy realizes judgment of price change turning points by capturing Histogram trend changes. Combining parameter optimization and combo indicators can effectively filter out wrong signals. As an important auxiliary judgment tool in quantitative trading, this strategy provides a simple and practical trading idea using MACD Histogram.
Parameters
| Name | Default | What it controls |
|---|---|---|
| v_input_1 | 2017 | Year |
| v_input_2 | 12 | Fast Length |
| v_input_3 | 26 | Slow Length |
| v_input_4 | true | Trend of Histogram Number |
| v_input_5_close | 0 | Source: close | high | low | open | hl2 | hlc3 | hlcc4 | ohlc4 |
| v_input_6 | 9 | Signal Smoothing |
| v_input_7 | false | Simple MA(Oscillator) |
| v_input_8 | false | Simple MA(Signal Line) |
Source Pine Script
/*backtest
start: 2023-01-18 00:00:00
end: 2024-01-24 00:00:00
period: 1d
basePeriod: 1h
exchanges: [{"eid":"Futures_Binance","currency":"BTC_USDT"}]
*/

//@version=4
//study(title="Histogram Strategy by Sedkur", shorttitle="Histogram Strategy by Sedkur")
strategy (title="Histogram Trends Strategy by Sedkur", shorttitle="Histogram Trends Strategy by Sedkur")


/// Getting inputs
dyear = input(title="Year", type=input.integer, defval=2017, minval=1950, maxval=2500)
fast_length = input(title="Fast Length", type=input.integer, defval=12)
slow_length = input(title="Slow Length", type=input.integer, defval=26)
hist_length = input(title="Trend of Histogram Number", type=input.integer, defval=1, minval=1, maxval=100)
//buyh = input(title="Buy histogram value", type=input.float, defval=0.0, minval=-1000, maxval=1000, step=0.1)
//sellh = input(title="Sell histogram value", type=input.float, defval=0.0, minval=-1000, maxval=1000, step=0.1)
src = input(title="Source", type=input.source, defval=close)
signal_length = input(title="Signal Smoothing", type=input.integer, minval = 1, maxval = 50, defval = 9)
sma_source = input(title="Simple MA(Oscillator)", type=input.bool, defval=false)
sma_signal = input(title="Simple MA(Signal Line)", type=input.bool, defval=false)

// Plot colors
col_grow_above = #26A69A
col_grow_below = #FFCDD2
col_fall_above = #B2DFDB
col_fall_below = #EF5350
col_macd = #0094ff
col_signal = #ff6a00

/// Calculating
fast_ma = sma_source ? sma(src, fast_length) : ema(src, fast_length)
slow_ma = sma_source ? sma(src, slow_length) : ema(src, slow_length)
macd = fast_ma - slow_ma
signal = sma_signal ? sma(macd, signal_length) : ema(macd, signal_length)
hist = macd - signal

plot(hist, title="Histogram", style=plot.style_columns, color=(hist>=0 ? (hist[1] < hist ? col_grow_above : col_fall_above) : (hist[1] < hist ? col_grow_below : col_fall_below) ), transp=0 )
//plot(macd, title="MACD", color=col_macd, transp=0)
//plot(signal, title="Signal", color=col_signal, transp=0)

//bullish = hist[1] <= hist and buyh<=hist?true:false
//bearish = hist[1] >= hist and sellh>=hist?true:false
bull=0
bear=0


for i=0 to hist_length
    if (hist[i+1] <= hist[i])
        bull:=bull+1
bullish = bull==hist_length+1?true:false

for j=0 to hist_length
    if (hist[j+1] >= hist[j])
        bear:=bear+1
bearish = bear==hist_length+1?true:false


//bullish = hist[1] <= hist and hist[2] <= hist and hist[3] <= hist and hist[4] <= hist and hist[5] <= hist?true:false
//bearish = hist[1] >= hist and hist[2] >= hist and hist[3] >= hist and hist[4] >= hist and hist[5] >= hist?true:false

strategy.entry("buy", strategy.long, comment="buy", when = bullish and year>=dyear)
strategy.entry("sell", strategy.short, comment="sell", when = bearish and year>=dyear)
Published by ChaoZhang on the FMZ strategy square · last modified 2024-01-25. Collected in the Quant Trading Vault. Unvalidated research: re-test with your own data and costs before trusting it.
Build this with AgenKit
A spec is not a trading system. Paste this into your coding agent and AgenKit runs a specialist team — architecture, test-first build, risk gates, review — with paper trading on by default.
/agenkit build a production-grade trading bot with a backtest engine, risk controls and paper trading by default from strategies/This-strategy-makes-trading-decisions-based-on-the-trend-of-MACD-Histogram.md- npx agenkit install engineering-kit in your project
- Paste the command into your agent and approve each phase
- Get tests, backtest, risk controls and a paper-trading switch
Understand it first
Before you run this, read the lesson behind the idea and how to backtest it honestly. Specs like this one are the survivors of an unknown number of trials; deflate their results accordingly.
Related specs
- Bollinger Bands and RSI Trend Following StrategyPine Script · Trend following · 1h
- Dual ATR Channel Trend Following StrategyPine Script · Trend following · 15m
- Dual MA Crossover Trend Tracking StrategyPine Script · Trend following · 1h
- Dynamic Dual EMA Crossover Strategy with Adaptive Profit Loss ControlPine Script · Trend following · 1d
- EMA SMA Multi Indicator Comprehensive Trend Following StrategyPine Script · Trend following · 1h
- EMA and RSI Trend Trading StrategyPine Script · Trend following · 1d