Strategy vault / Trend following
Trend Following Moving Average Crossover Strategy
This strategy utilizes the golden cross and death cross principles of moving averages, combined with the RSI indicator to assist in trend identification and tracking. It goes long when the short-term moving average…
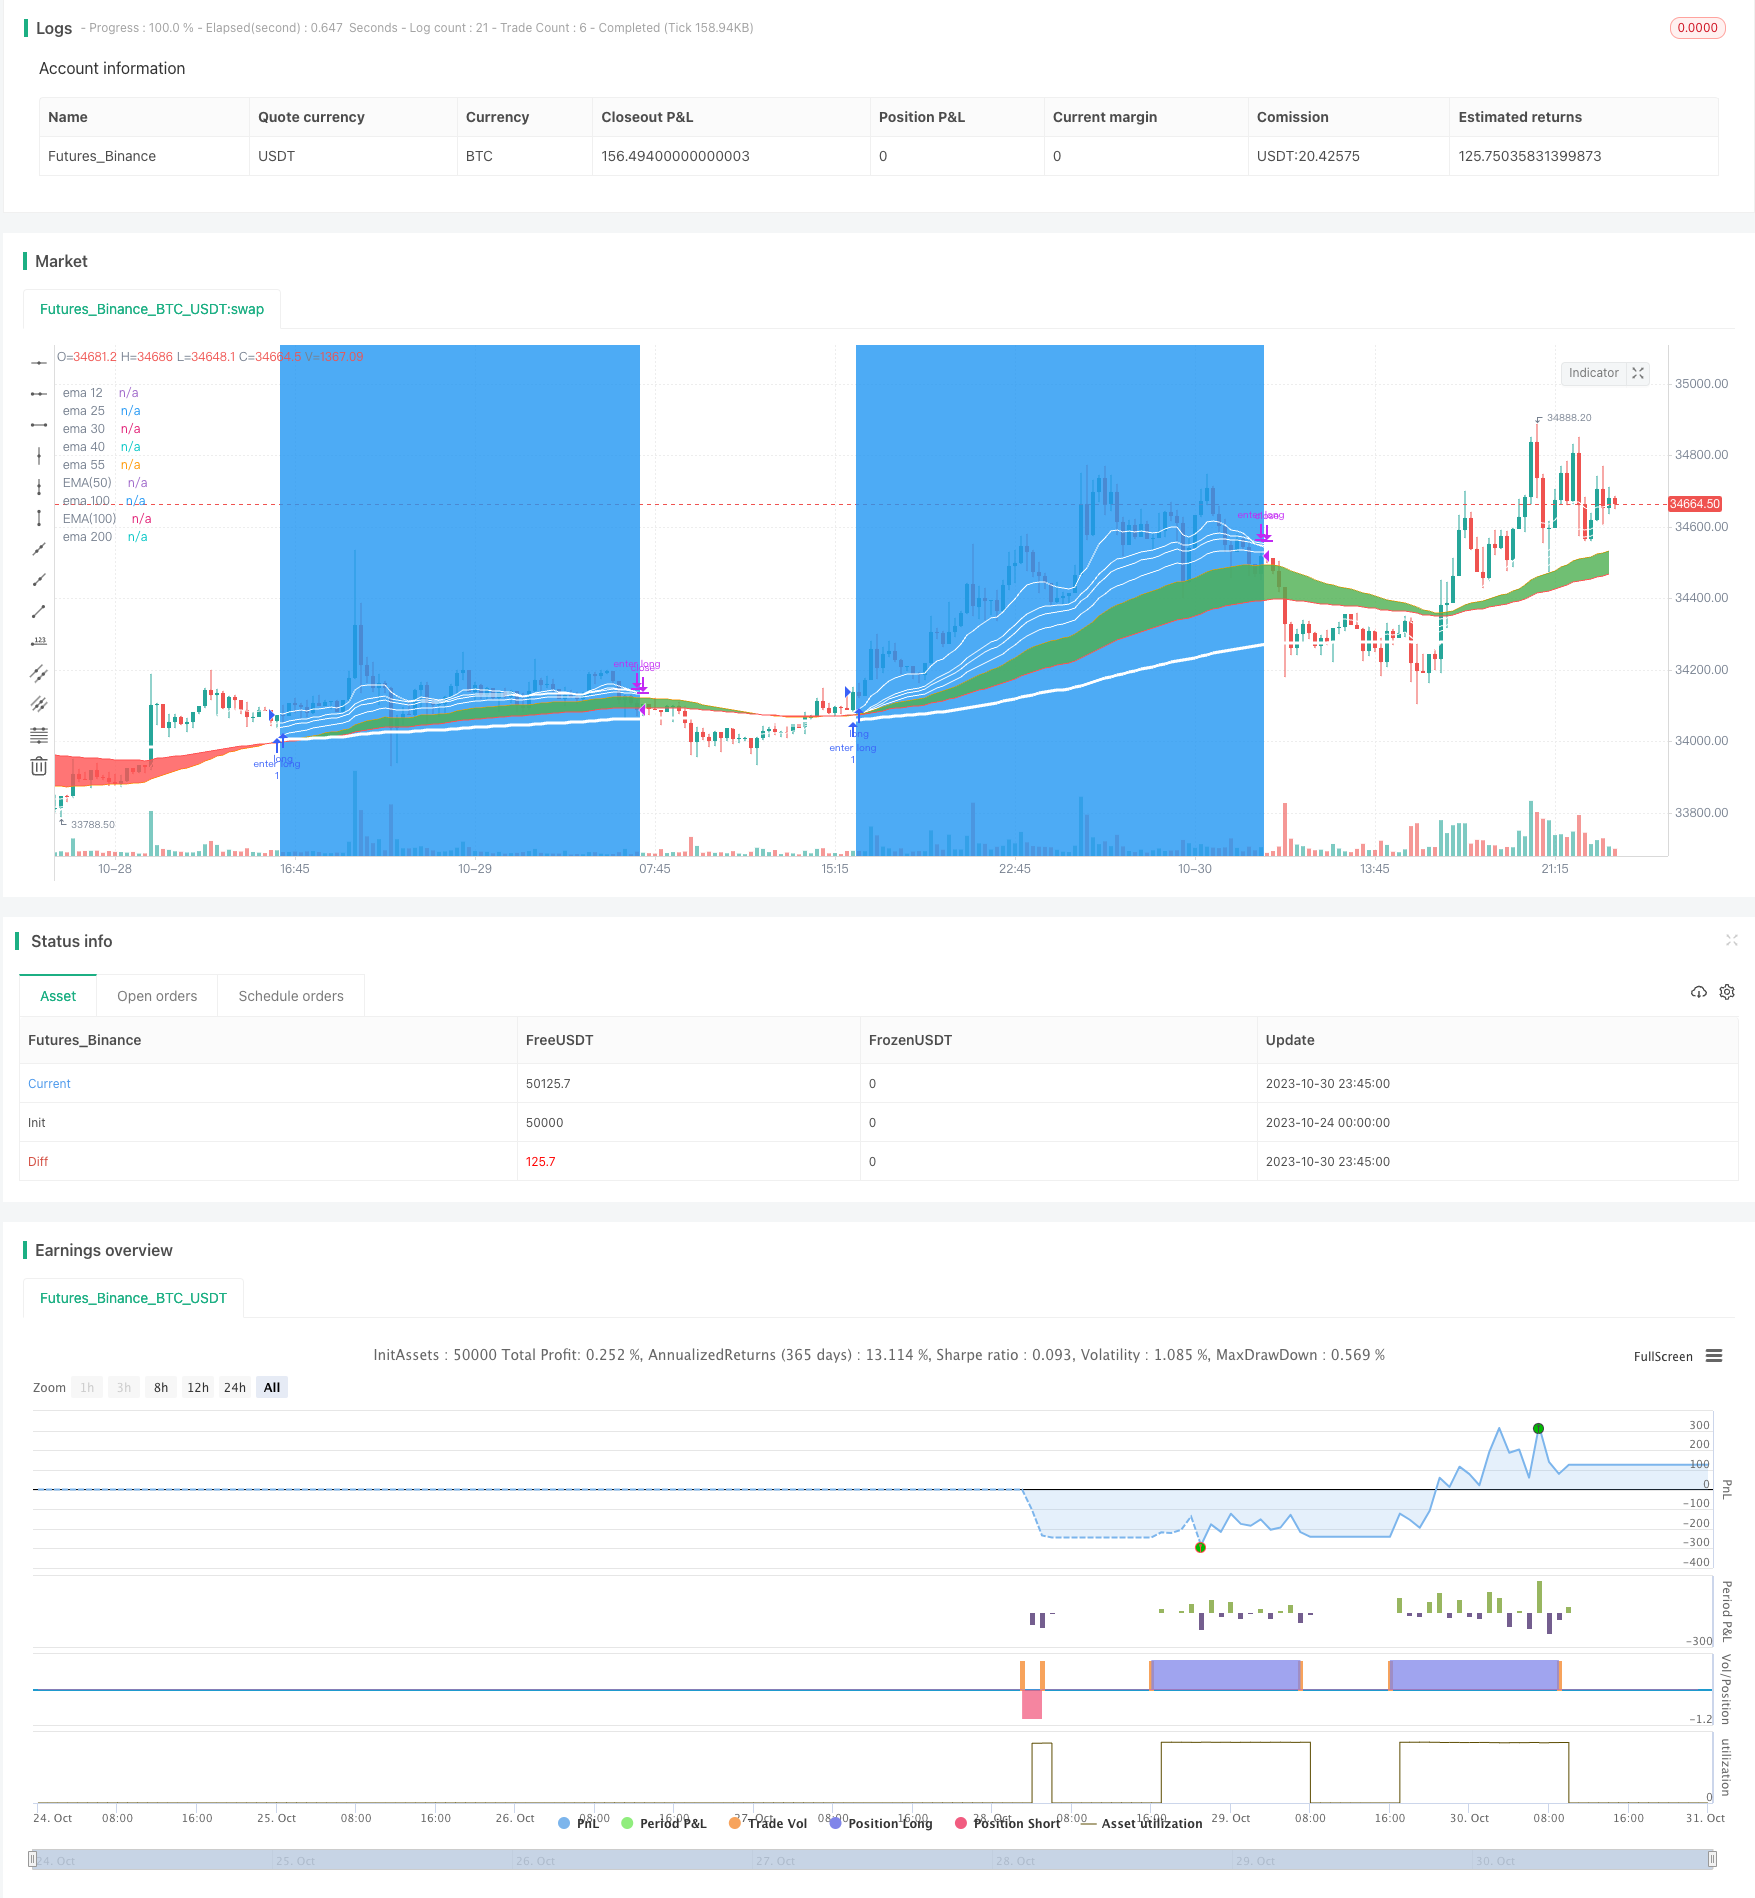
Overview
This strategy utilizes the golden cross and death cross principles of moving averages, combined with the RSI indicator to assist in trend identification and tracking. It goes long when the short-term moving average crosses above the long-term moving average, and goes short when the short-term moving average crosses below the long-term moving average. This is a typical trend following strategy.
Strategy Logic
The strategy is based on the following principles:
Use EMA instead of SMA to better reflect the latest price changes and react faster to breakouts.
Dual moving average crossover system: short-term EMA crossing above long-term EMA signals long entry, while short-term EMA crossing below long-term EMA signals short entry. This utilizes the golden cross and death cross principles to determine trend reversal.
RSI indicator assists in filtering false breakouts by signaling overbought/oversold conditions.
Multiple moving averages stacked together: 55-period EMA for short-term signal, 100-period EMA for medium-term trend, and 200-period EMA for long-term trend filtering.
Reasonable stop loss and take profit settings to control risk.
The main trading logic is:
Enter long when 55-period EMA crosses above 100-period EMA, and 12-period EMA is above 200-period EMA.
Enter short when 100-period EMA crosses below 200-period EMA.
Set stop loss and take profit after entry to optimize returns.
Close long/short positions when RSI shows overbought/oversold to avoid reversal risks.
The combination of multiple moving average periods accounts for both trend tracking and reversal confirmation, thus avoiding being trapped in prolonged consolidation while following the major trend.
Advantages
The main advantages of this strategy are:
Simple logic based on moving average crossovers, easy to understand and implement.
Faster reaction to price changes and trend reversals by using EMA.
Multiple moving average periods account for both trend tracking and reversal identification.
RSI filters out false breakouts and increases signal accuracy.
Default stop loss/take profit parameters effectively control trading risks.
Highly customizable by adjusting moving average periods, stop loss/take profit ratios etc.
Risks
The main risks of this strategy are:
Prone to being whipsawed in ranging, volatile markets, generating excessive inactive signals.
Default parameters may not fit all products and timeframes, requiring optimization.
Purely technical signal driven, prone to fundamental shifts and event risks.
May underperform when index rises but market breadth diverges.
Risk of profit taking too early and missing most of the trend move.
To address these risks, the following optimizations can be made:
Add filters like volume to avoid false breakouts.
Backtest to find optimal parameters for each product.
Tighter stop loss and profit taking to limit whipsaw risks in ranging markets.
Incorporate fundamental filters to avoid signals before major events.
Optimization Directions
The strategy can be optimized in the following aspects:
Optimize moving average periods to find the best short, medium and long-term combinations, via machine learning etc.
Test close price vs typical price for performance.
Add volume filter to only take signals on high volume bars.
Optimize stop loss/take profit ratios for higher precision. Or set dynamic stops based on percentages.
Build composite models with additional indicators like Stochastics, MACD, Bollinger Bands to improve performance.
Backtest across different products, timeframes and market conditions for robustness.
Utilize machine learning for multidimensional parameter optimization.
Conclusion
This is an easy to understand trend following strategy based on simple moving average crossover logic. It has advantages like easy implementation, reliability, and high customization potential. But it also carries inherent market risks, requiring ongoing optimization of parameters and modules based on backtest results, to make the strategy more robust and intelligent. Combining technical analysis with fundamental research can further improve its completeness and reliability.
Parameters
| Name | Default | What it controls |
|---|---|---|
| v_input_1 | 27 | profit_short |
| v_input_2 | 2 | stop_short |
| v_input_3 | 3 | stop_long |
| v_input_4 | 35 | profit_long |
| v_input_5 | 55 | media_1 |
| v_input_6 | 100 | media_2 |
| v_input_7 | false | resta_medias |
| v_input_8 | false | resta_medias2 |
| v_input_9 | 42 | RSI_periodos |
Source Pine Script
/*backtest
start: 2023-10-24 00:00:00
end: 2023-10-31 00:00:00
period: 15m
basePeriod: 5m
exchanges: [{"eid":"Futures_Binance","currency":"BTC_USDT"}]
*/

// This source code is subject to the terms of the Mozilla Public License 2.0 at https://mozilla.org/MPL/2.0/
// © pernath

//@version=5
strategy("TREND_CATCHER", overlay=true, commission_value=0.05, commission_type=strategy.commission.percent, initial_capital=1000)

//#####variables##############
profit_short=input(title='profit_short', defval=27)
stop_short=input(title='stop_short', defval=2)

stop_long=input(title='stop_long', defval=3)
profit_long=input(title='profit_long', defval=35)


media_1=input(title='media_1', defval=55)
media_2=input(title='media_2', defval=100)
resta_medias=input(title='resta_medias', defval=0)
resta_medias2=input(title='resta_medias2', defval=0)

RSI_periodos=input(title='RSI_periodos', defval=42)
//###############VARIABLES###################


//#####Alert#####
id_bot = ""
email_token = ""
long_open =""
long_close =""
short_open =""
short_close =""
//#  {{strategy.order.alert_message}}


//#############################
//#############################

//###############EMA##############/
//plot(ta.ema(close, 1), title='ema 5', color=color.white)
plot(ta.ema(close, 12), title='ema 12', color=color.white)
plot(ta.ema(close, 25), title='ema 25', color=color.white)
plot(ta.ema(close, 30), title='ema 30', color=color.white, linewidth=1)
plot(ta.ema(close, 40), title='ema 40', color=color.white, linewidth=1)
plot(ta.ema(close, 55), title='ema 55', color=color.orange, linewidth=1)
plot(ta.ema(close, 100), title='ema 100', color=color.red, linewidth=1)
plot(ta.ema(close, 200), title='ema 200', color=color.white, linewidth=3)

//#############################/


//######VISUAL#############
EMA50 = ta.ema(close, 55)
EMA100 = ta.ema(close, 100)


estado_medias=EMA50-EMA100


a = plot(EMA50, title="EMA(50)", color=color.orange, linewidth=1 )
b = plot(EMA100, title="EMA(100)", color=color.red, linewidth=1 )


var color col = na
col := estado_medias>resta_medias ? color.green : color.red
fill(a,b,color=col,transp=40)


//######VISUAL#############


Go_Short=(ta.crossunder(ta.ema(close,100),ta.ema(close,200)))
Go_Long=((ta.crossover(ta.ema(close,55),ta.ema(close,100))and(ta.ema(close,12)>ta.ema(close,200))))


strategy.close("enter long", (Go_Short),alert_message=long_open)

cancelar_short=((ta.crossunder(ta.ema(close,25),ta.ema(close,6))))


if Go_Short
    strategy.entry("enter short", strategy.short,1, alert_message=short_open)

strategy.exit("cerrar short", "enter short", 1, profit=close*profit_short/100/syminfo.mintick, loss=close*stop_short/100/syminfo.mintick, alert_message=short_close)


strategy.close("enter short", (Go_Long),alert_message=short_close)
cancelar=((ta.crossunder(ta.ema(close,12),ta.ema(close,30))))


if Go_Long
    strategy.entry("enter long", strategy.long,1,alert_message=long_open)

strategy.exit("cerrar long", "enter long", 1, profit=close*profit_long/100/syminfo.mintick, loss=close*stop_long/100/syminfo.mintick, alert_message=long_close)


strategy.close("enter short", (cancelar_short),alert_message=short_close)

strategy.close("enter long", (cancelar),alert_message=long_close)


//posiciones abiertas
bgcolor((strategy.position_size > 0 or strategy.position_size < 0) ? color.blue : na, transp=70)
Published by ChaoZhang on the FMZ strategy square · last modified 2023-11-01. Collected in the Quant Trading Vault. Unvalidated research: re-test with your own data and costs before trusting it.
Build this with AgenKit
A spec is not a trading system. Paste this into your coding agent and AgenKit runs a specialist team — architecture, test-first build, risk gates, review — with paper trading on by default.
/agenkit build a production-grade trading bot with a backtest engine, risk controls and paper trading by default from strategies/Trend-Following-Moving-Average-Crossover-Strategy.md- npx agenkit install engineering-kit in your project
- Paste the command into your agent and approve each phase
- Get tests, backtest, risk controls and a paper-trading switch
Understand it first
Before you run this, read the lesson behind the idea and how to backtest it honestly. Specs like this one are the survivors of an unknown number of trials; deflate their results accordingly.
Related specs
- Bollinger Bands and RSI Trend Following StrategyPine Script · Trend following · 1h
- Dual ATR Channel Trend Following StrategyPine Script · Trend following · 15m
- Dual Mode Adaptive Trend Trading Strategy EMA Crossover with ATR Volatility Based Risk Management SystemPine Script · Trend following · 1d
- Dynamic Dual EMA Crossover Strategy with Adaptive Profit Loss ControlPine Script · Trend following · 1d
- Dynamic Signal Line Trend Following and Volatility Filtering StrategyPine Script · Trend following · 1h
- EMA AROON ASHPine Script · Trend following · 3m