Strategy vault / Trend following
Trend Following Moving Average Trading Strategy
This strategy is a trend following moving average trading strategy. It uses moving averages of highest and lowest prices with different parameter settings to determine market trends and generate trading signals at…
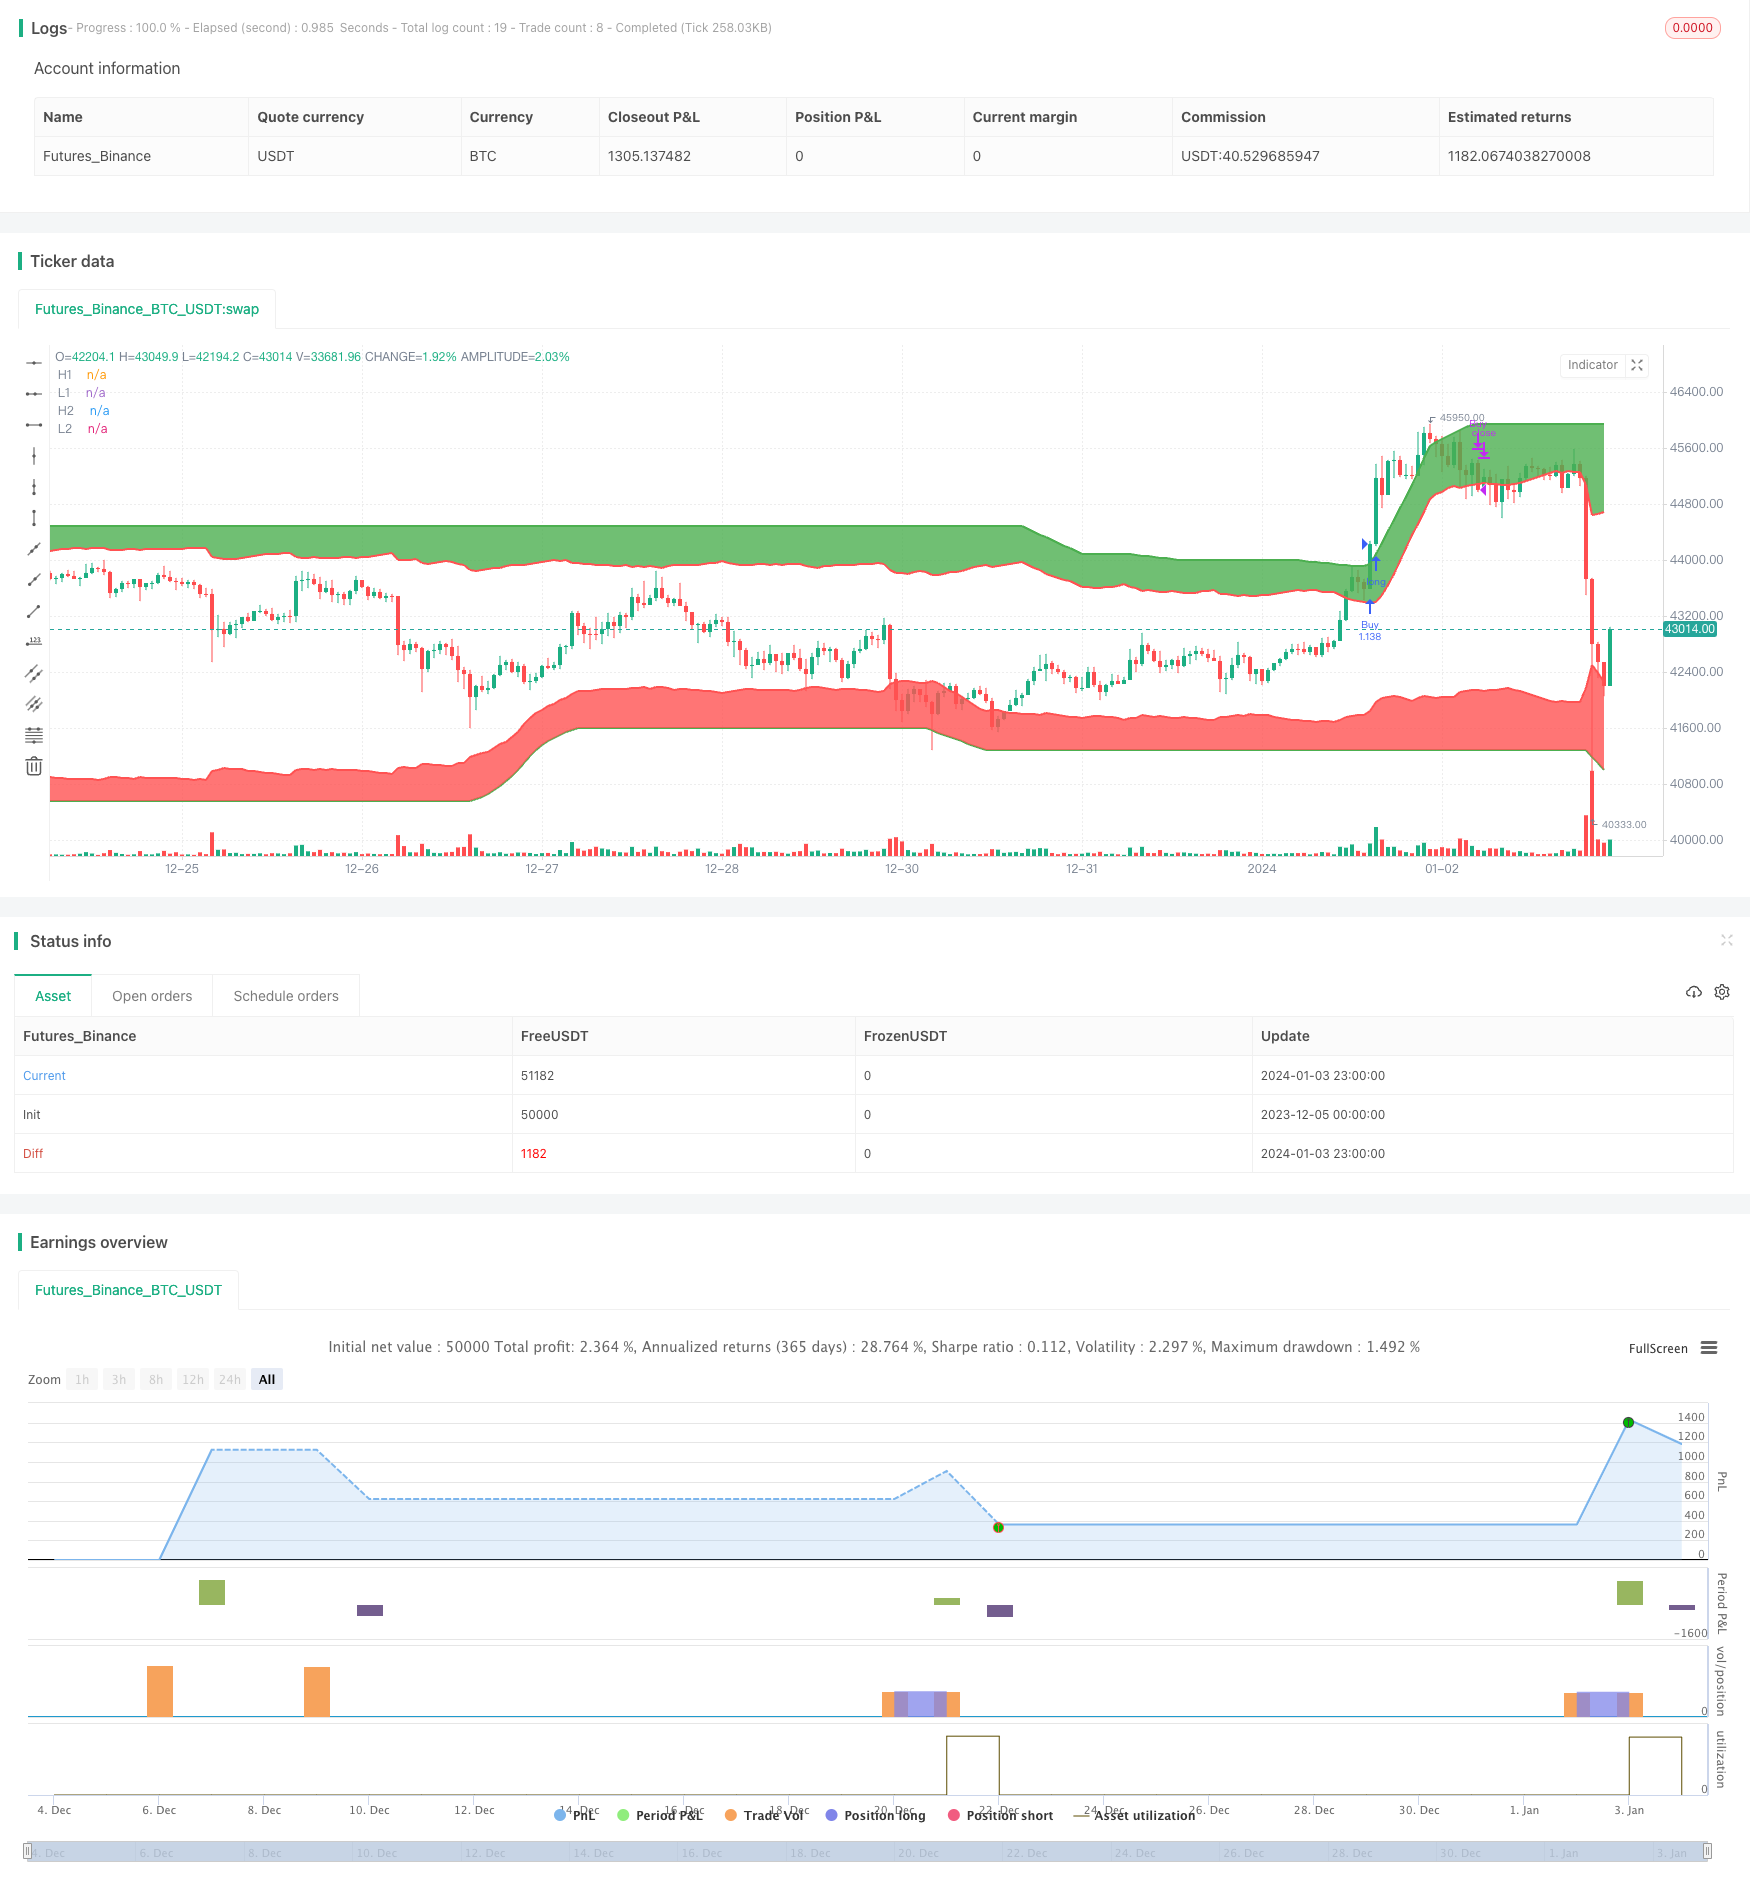
Overview
This strategy is a trend following moving average trading strategy. It uses moving averages of highest and lowest prices with different parameter settings to determine market trends and generate trading signals at turning points. It goes long when price breaks above the upward-tracking moving average line and goes short when price breaks below the downward-tracking line. The strategy also utilizes ATR to set stop loss and take profit levels.
Strategy Logic
The strategy employs simple moving averages of highest and lowest prices with different parameters to define market trends. Specifically, it creates two sets of tracking moving average systems:
The h1 and l1 system tracks the trend from upside. h1 is the simple moving average of highest prices, acting as the upper band of the trend; l1 is constructed by h1 minus the ATR value, serving as the lower band. A long signal is generated when price breaks above h1, and a close signal is generated when price falls below l1.
The h2 and l2 system tracks the trend from downside. h2 is the simple moving average of lowest prices, acting as the lower band; l2 is constructed by h2 plus the ATR value, serving as the upper band. A short signal is generated when price breaks below h2, and a close signal is generated when price rises above l2.
The dual-band systems can more accurately identify trend turning points and filter out some noisy trades. Meanwhile, the ATR value is used to set stop loss and take profit levels to control risk-reward ratio per trade.
Advantage Analysis
The main advantages of this strategy include:
- The dual-band system filters noise and identifies turning points more precisely.
- ATR dynamically tracks volatility, enabling effective per trade stop loss control.
- The logic is simple and easy to understand, suitable for beginners to learn.
- Parameters can be flexibly tuned for adapting to different market environments.
Risk Analysis
There are also some risks associated with this strategy:
- Breakout signals from the bands could lag, missing opportunities at early trend stages.
- Tracking moving averages have weaker ability in catching curved trends.
- Trading costs are not considered. They could be high with high frequency trading.
Solutions:
- Shorten moving average periods for more sensitive signals.
- Incorporate other indicators like MACD to determine trend types, avoiding over-trading in ranging zones.
- Adjust position sizing to lower trading frequency.
Optimization Directions
The strategy can be optimized from the following aspects:
- Utilize machine learning algorithms to auto-tune parameters for adapting to changing markets.
- Incorporate trading volume to avoid false breakouts.
- Add micro position sizing rules to link position size with trend strength.
- Optimize stop loss mechanisms with trailing stops etc.
Conclusion
In conclusion, this is a simple and practical trend following strategy. The core philosophy is to identify trend turning points and control per trade loss through dual-band filtering and dynamic ATR stops. It has definite practical merits and also large room for optimization. Better performances could be achieved through parameter tuning, incorporating other indicators etc.
Parameters
| Name | Default | What it controls |
|---|---|---|
| v_input_1 | 200 | Highest Length |
| v_input_2 | 10 | Highest Average Length |
| v_input_3 | 200 | Lowest Length |
| v_input_4 | 10 | Lowest Average Length |
| v_input_5 | 14 | ATR Length |
| v_input_6 | 2 | ATR Multiplier |
Source Pine Script
/*backtest
start: 2023-12-05 00:00:00
end: 2024-01-04 00:00:00
period: 1h
basePeriod: 15m
exchanges: [{"eid":"Futures_Binance","currency":"BTC_USDT"}]
*/

//@version=4
strategy("I Like Winners And Love Loosers!", overlay=true, default_qty_type=strategy.percent_of_equity, default_qty_value=100)

highest_length = input(200, type=input.integer, minval=1, title="Highest Length")
highest_average = input(10, type=input.integer, minval=1, title="Highest Average Length")

lowest_length = input(200, type=input.integer, minval=1, title="Lowest Length")
lowest_average = input(10, type=input.integer, minval=1, title="Lowest Average Length")

atr_length = input(14, type=input.integer, minval=1, title="ATR Length")
atr_multiplier = input(2, type=input.integer, minval=1, title="ATR Multiplier")
a = atr(atr_length) * atr_multiplier

h1 = sma(highest(high, highest_length), highest_average)
l1 = h1 - a

h2 = sma(lowest(low, lowest_length), lowest_average)
l2 = h2 + a

buy1_signal = crossover(close, h1)
sell1_signal = crossunder(close, l1)
strategy.entry("Buy", strategy.long, when=buy1_signal)
strategy.close("Buy", when=sell1_signal)

buy2_signal = crossunder(close, h2)
sell2_signal = crossover(close, l2)
strategy.entry("Sell", strategy.short, when=buy2_signal)
strategy.close("Sell", when=sell2_signal)

y1 = plot(h1, title="H1", color=color.green, transp=50, linewidth=2)
y2 = plot(l1, title="L1", color=color.red, transp=50, linewidth=2)
y3 = plot(h2, title="H2", color=color.green, transp=50, linewidth=2)
y4 = plot(l2, title="L2", color=color.red, transp=50, linewidth=2)

fill(y1,y2,color=color.green)
fill(y3,y4,color=color.red)
Published by ChaoZhang on the FMZ strategy square · last modified 2024-01-05. Collected in the Quant Trading Vault. Unvalidated research: re-test with your own data and costs before trusting it.
Build this with AgenKit
A spec is not a trading system. Paste this into your coding agent and AgenKit runs a specialist team — architecture, test-first build, risk gates, review — with paper trading on by default.
/agenkit build a production-grade trading bot with a backtest engine, risk controls and paper trading by default from strategies/Trend-Following-Moving-Average-Trading-Strategy.md- npx agenkit install engineering-kit in your project
- Paste the command into your agent and approve each phase
- Get tests, backtest, risk controls and a paper-trading switch
Understand it first
Before you run this, read the lesson behind the idea and how to backtest it honestly. Specs like this one are the survivors of an unknown number of trials; deflate their results accordingly.
Related specs
- Bollinger Bands and RSI Trend Following StrategyPine Script · Trend following · 1h
- Dual ATR Channel Trend Following StrategyPine Script · Trend following · 15m
- Dual MA Crossover Trend Tracking StrategyPine Script · Trend following · 1h
- Dual Moving Average Crossover Strategy with Stop Loss and Take ProfitPine Script · Trend following · 4h
- Dynamic Dual EMA Crossover Strategy with Adaptive Profit Loss ControlPine Script · Trend following · 1d
- EMA and RSI Trend Trading StrategyPine Script · Trend following · 1d