Trend Tracking Breakout Strategy 436603
The Trend Tracking Breakout Strategy is a trend following strategy based on moving average and Bollinger Bands indicators. It combines the ideas of trend analysis and breakout trading, seeking breakout opportunities…
Overview
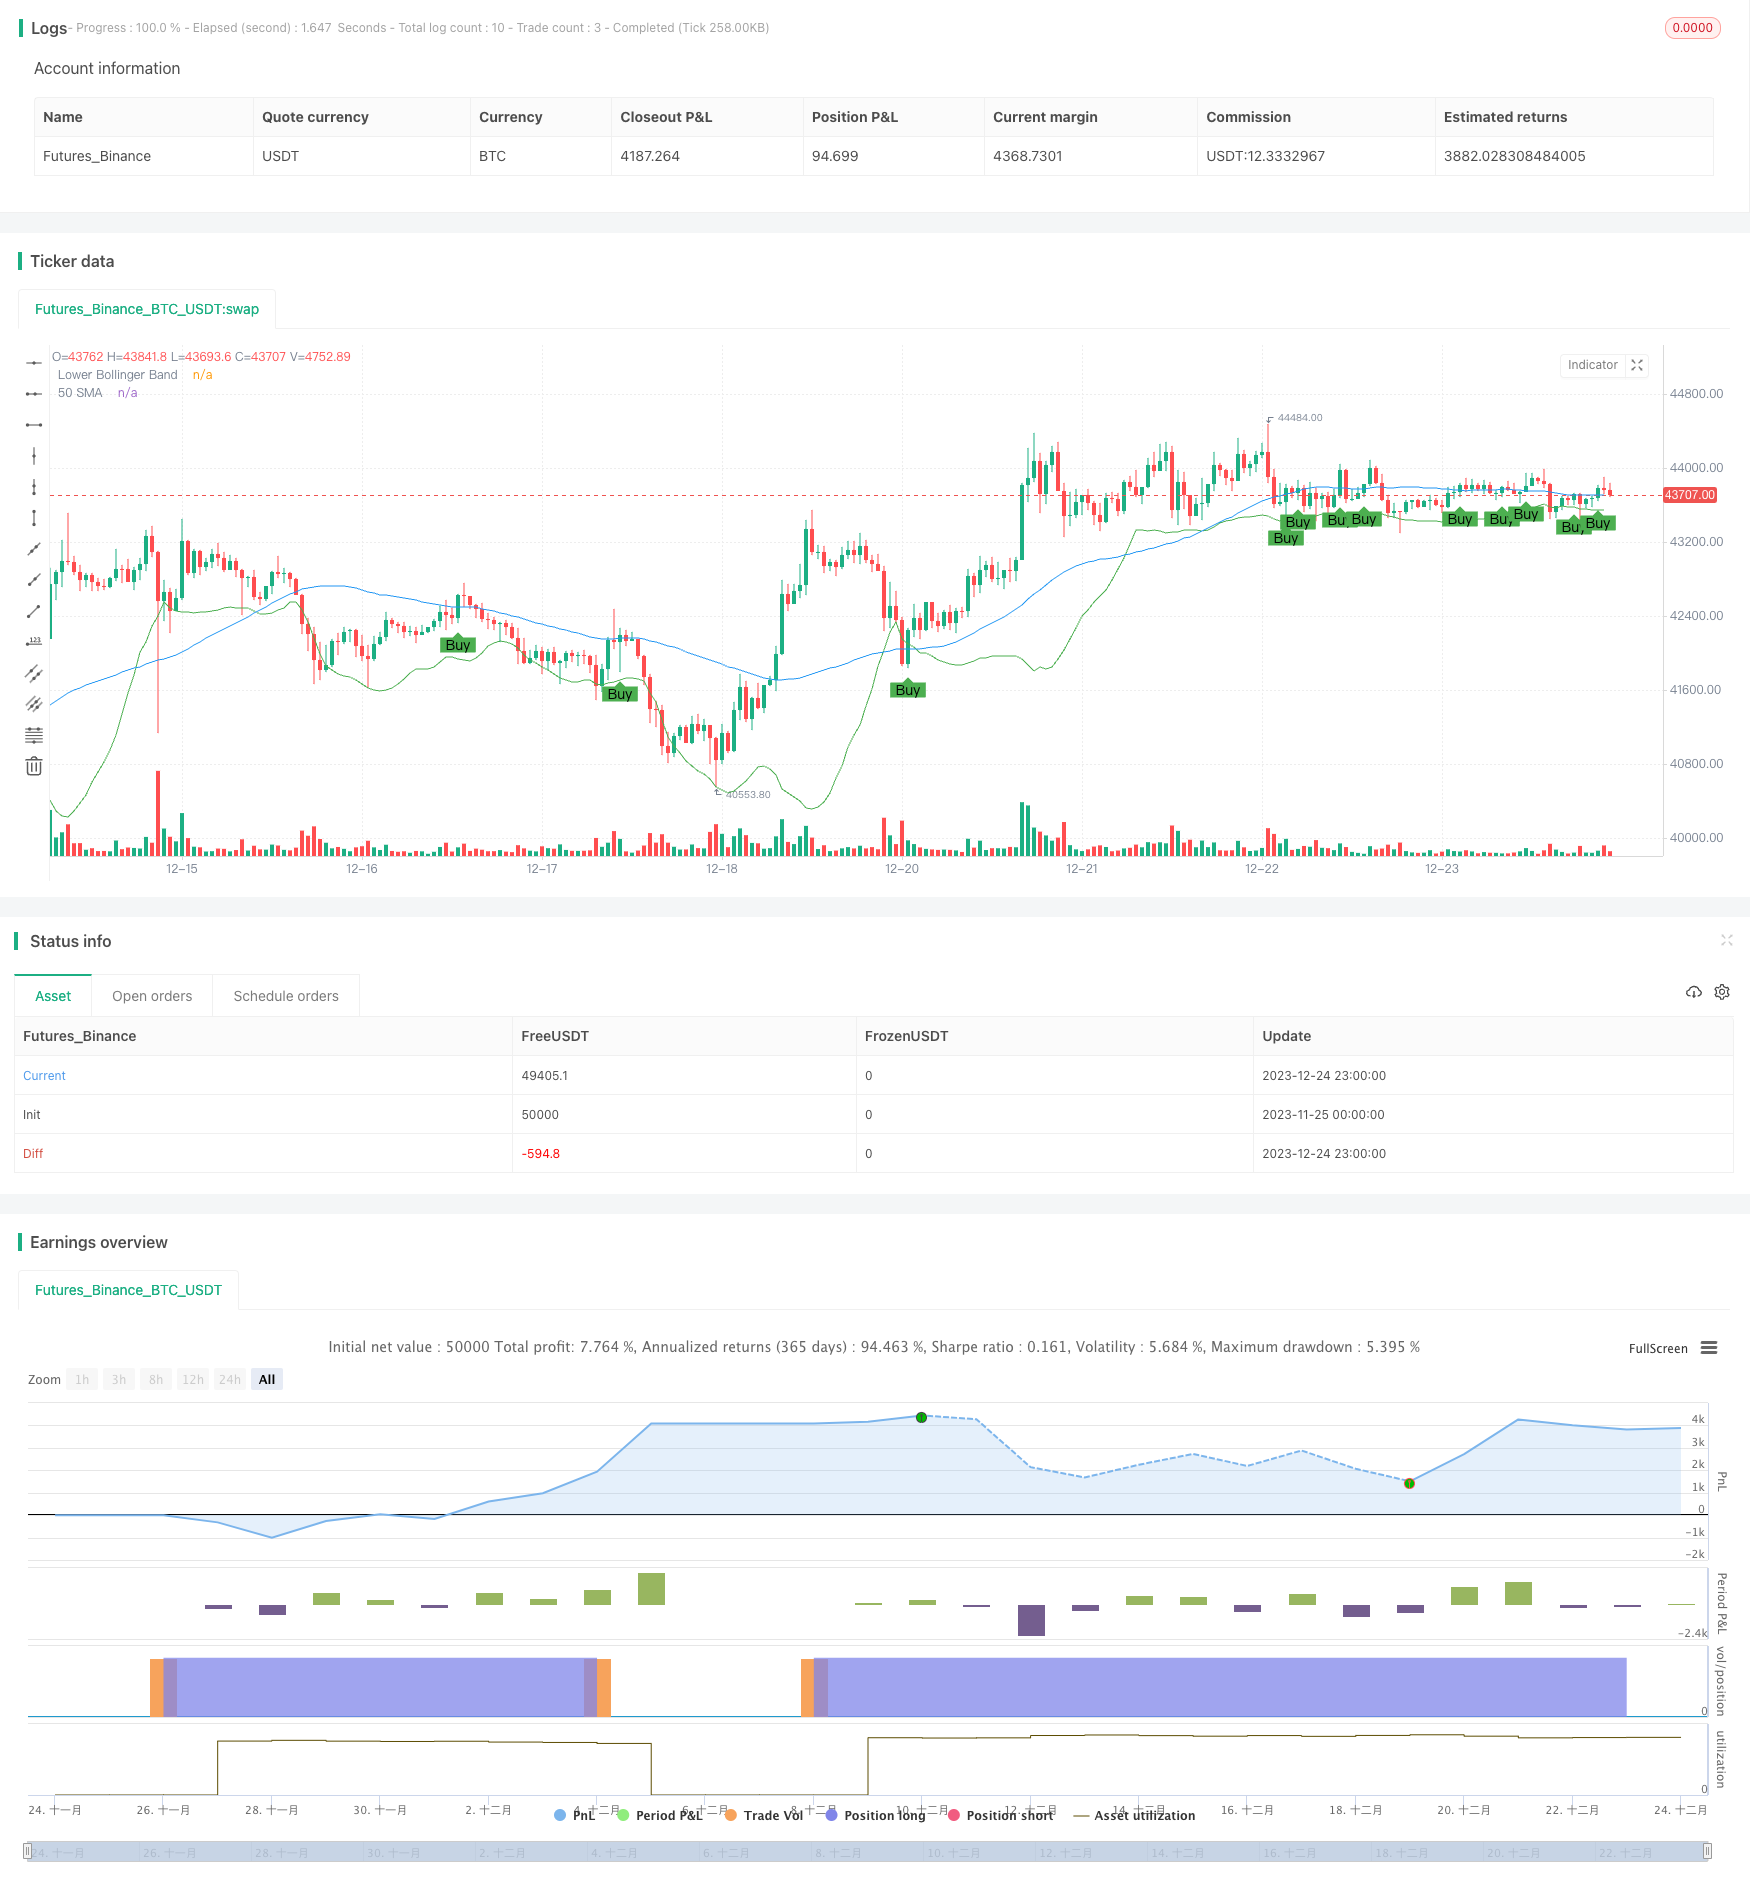
The Trend Tracking Breakout Strategy is a trend following strategy based on moving average and Bollinger Bands indicators. It combines the ideas of trend analysis and breakout trading, seeking breakout opportunities while determining the market trend.
Strategy Logic
The strategy uses the 50-period simple moving average (SMA) to determine the trend direction. A long position is considered when the closing price crosses above the 50-day SMA, indicating a potential upward trend.
At the same time, it requires the closing price to be above the lower Bollinger Band, suggesting the price is not in the lower extreme and may be poised for an upward move. The low of the candle must be within 1% of the lower Bollinger Band, indicating potential support near that level for a breakout.
After the entry signal is triggered, the strategy checks if the next day's opening price is above the stop level, which is set at 1 point above the highest price of the previous day, to confirm the actual entry.
The stop loss is preset at 5.7 points below the low of the entry bar. Take profit is set at 11.4 points above the closing price of the entry bar to achieve a 2:1 risk-reward ratio.
Advantage Analysis
The strategy combines trend judgment and breakout near key support levels to effectively filter false breakouts and improve win rate. Stop loss and take profit are set according to risk-reward principles to aid risk control.
The relatively simple indicators and entry rules make the strategy easy to understand and implement, suitable for beginners to learn algorithmic trading.
Risk Analysis
The strategy relies mainly on moving averages to determine trend direction, which may generate incorrect signals when the trend changes. Improper Bollinger Bands parameters could also lead to false breakouts.
The stop loss being too close may get stopped out prematurely. Take profit being too wide could also limit profits. These parameters need adjusting for different markets.
The strategy only considers the daily high and low prices and cannot react to overnight gaps.
Optimization Directions
Other indicators could be combined to determine the trend, like MACD. Or adaptive moving averages can be used to track trend changes.
Bollinger Bands parameters can be optimized to find the best combination. Stop loss and take profit levels can also be optimized based on backtesting results.
Logic can be added to judge overnight gaps, avoiding widened losses after gaps.
Conclusion
The strategy integrates the ideas of trend following and breakout trading, using simple indicators to create a filtering effect. Its advantage lies in being easy to understand and implement. Through parameter optimization, better results can be achieved. But there are also market risks to be aware of, requiring continuous improvements based on live trading results.
Source Pine Script
/*backtest
start: 2023-11-25 00:00:00
end: 2023-12-25 00:00:00
period: 1h
basePeriod: 15m
exchanges: [{"eid":"Futures_Binance","currency":"BTC_USDT"}]
*/

//@version=4
strategy("Custom Strategy", overlay=true)

// Input variables
smaLength = 50
bbLength = 20
supportPercentage = 1
riskRewardRatio = 2

// Calculate indicators
sma = sma(close, smaLength)
bb_lower = sma(close, bbLength) - 2 * stdev(close, bbLength)

// Entry conditions based on provided details
enterLongCondition = crossover(close, sma) and close > bb_lower and low <= (bb_lower * (1 + supportPercentage / 100))

// Entry and exit logic
if (enterLongCondition)
    strategy.entry("Long", strategy.long)

// Assuming the details provided are for the daily timeframe
stopLossPrice = low - 5.70
takeProfitPrice = close + 11.40

strategy.exit("Take Profit/Stop Loss", from_entry="Long", loss=stopLossPrice, profit=takeProfitPrice)

// Plotting
plot(sma, color=color.blue, title="50 SMA")
plot(bb_lower, color=color.green, title="Lower Bollinger Band")

// Plot entry points on the chart
plotshape(series=enterLongCondition, title="Buy Signal", location=location.belowbar, color=color.green, style=shape.labelup, text="Buy")
Published by ChaoZhang on the FMZ strategy square · last modified 2023-12-26. Collected in the Quant Trading Vault. Unvalidated research: re-test with your own data and costs before trusting it.
Build this with AgenKit
A spec is not a trading system. Paste this into your coding agent and AgenKit runs a specialist team — architecture, test-first build, risk gates, review — with paper trading on by default.
/agenkit build a production-grade trading bot with a backtest engine, risk controls and paper trading by default from strategies/Trend-Tracking-Breakout-Strategy-436603.md- npx agenkit install engineering-kit in your project
- Paste the command into your agent and approve each phase
- Get tests, backtest, risk controls and a paper-trading switch
Understand it first
Before you run this, read the lesson behind the idea and how to backtest it honestly. Specs like this one are the survivors of an unknown number of trials; deflate their results accordingly.
Related specs
- Bollinger Bands Dynamic Breakout StrategyPine Script · Breakout · 1h
- Cross boundary Dynamic Range Quantitative Trading Strategy Based on Bollinger BandsPine Script · Breakout · 3h
- Momentum Breakout Moving Average StrategyPine Script · Breakout · 1d
- Momentum Breakout Trading Strategy 440964Pine Script · Breakout · 5m
- Momentum Breakout Trading StrategyPine Script · Breakout · 4h
- Moving Average Crossover and Upper Rail Breakthrough Impulse StrategyPine Script · Breakout · 1m