Strategy vault / Trend following
Trend Trading Strategy Based on MACD Indicator
The core of this strategy is based on the indicator developed in the article "Trading the Trend" published by Andrew Abraham in TASC magazine September 1998 issue. The indicator utilizes average true range and price…
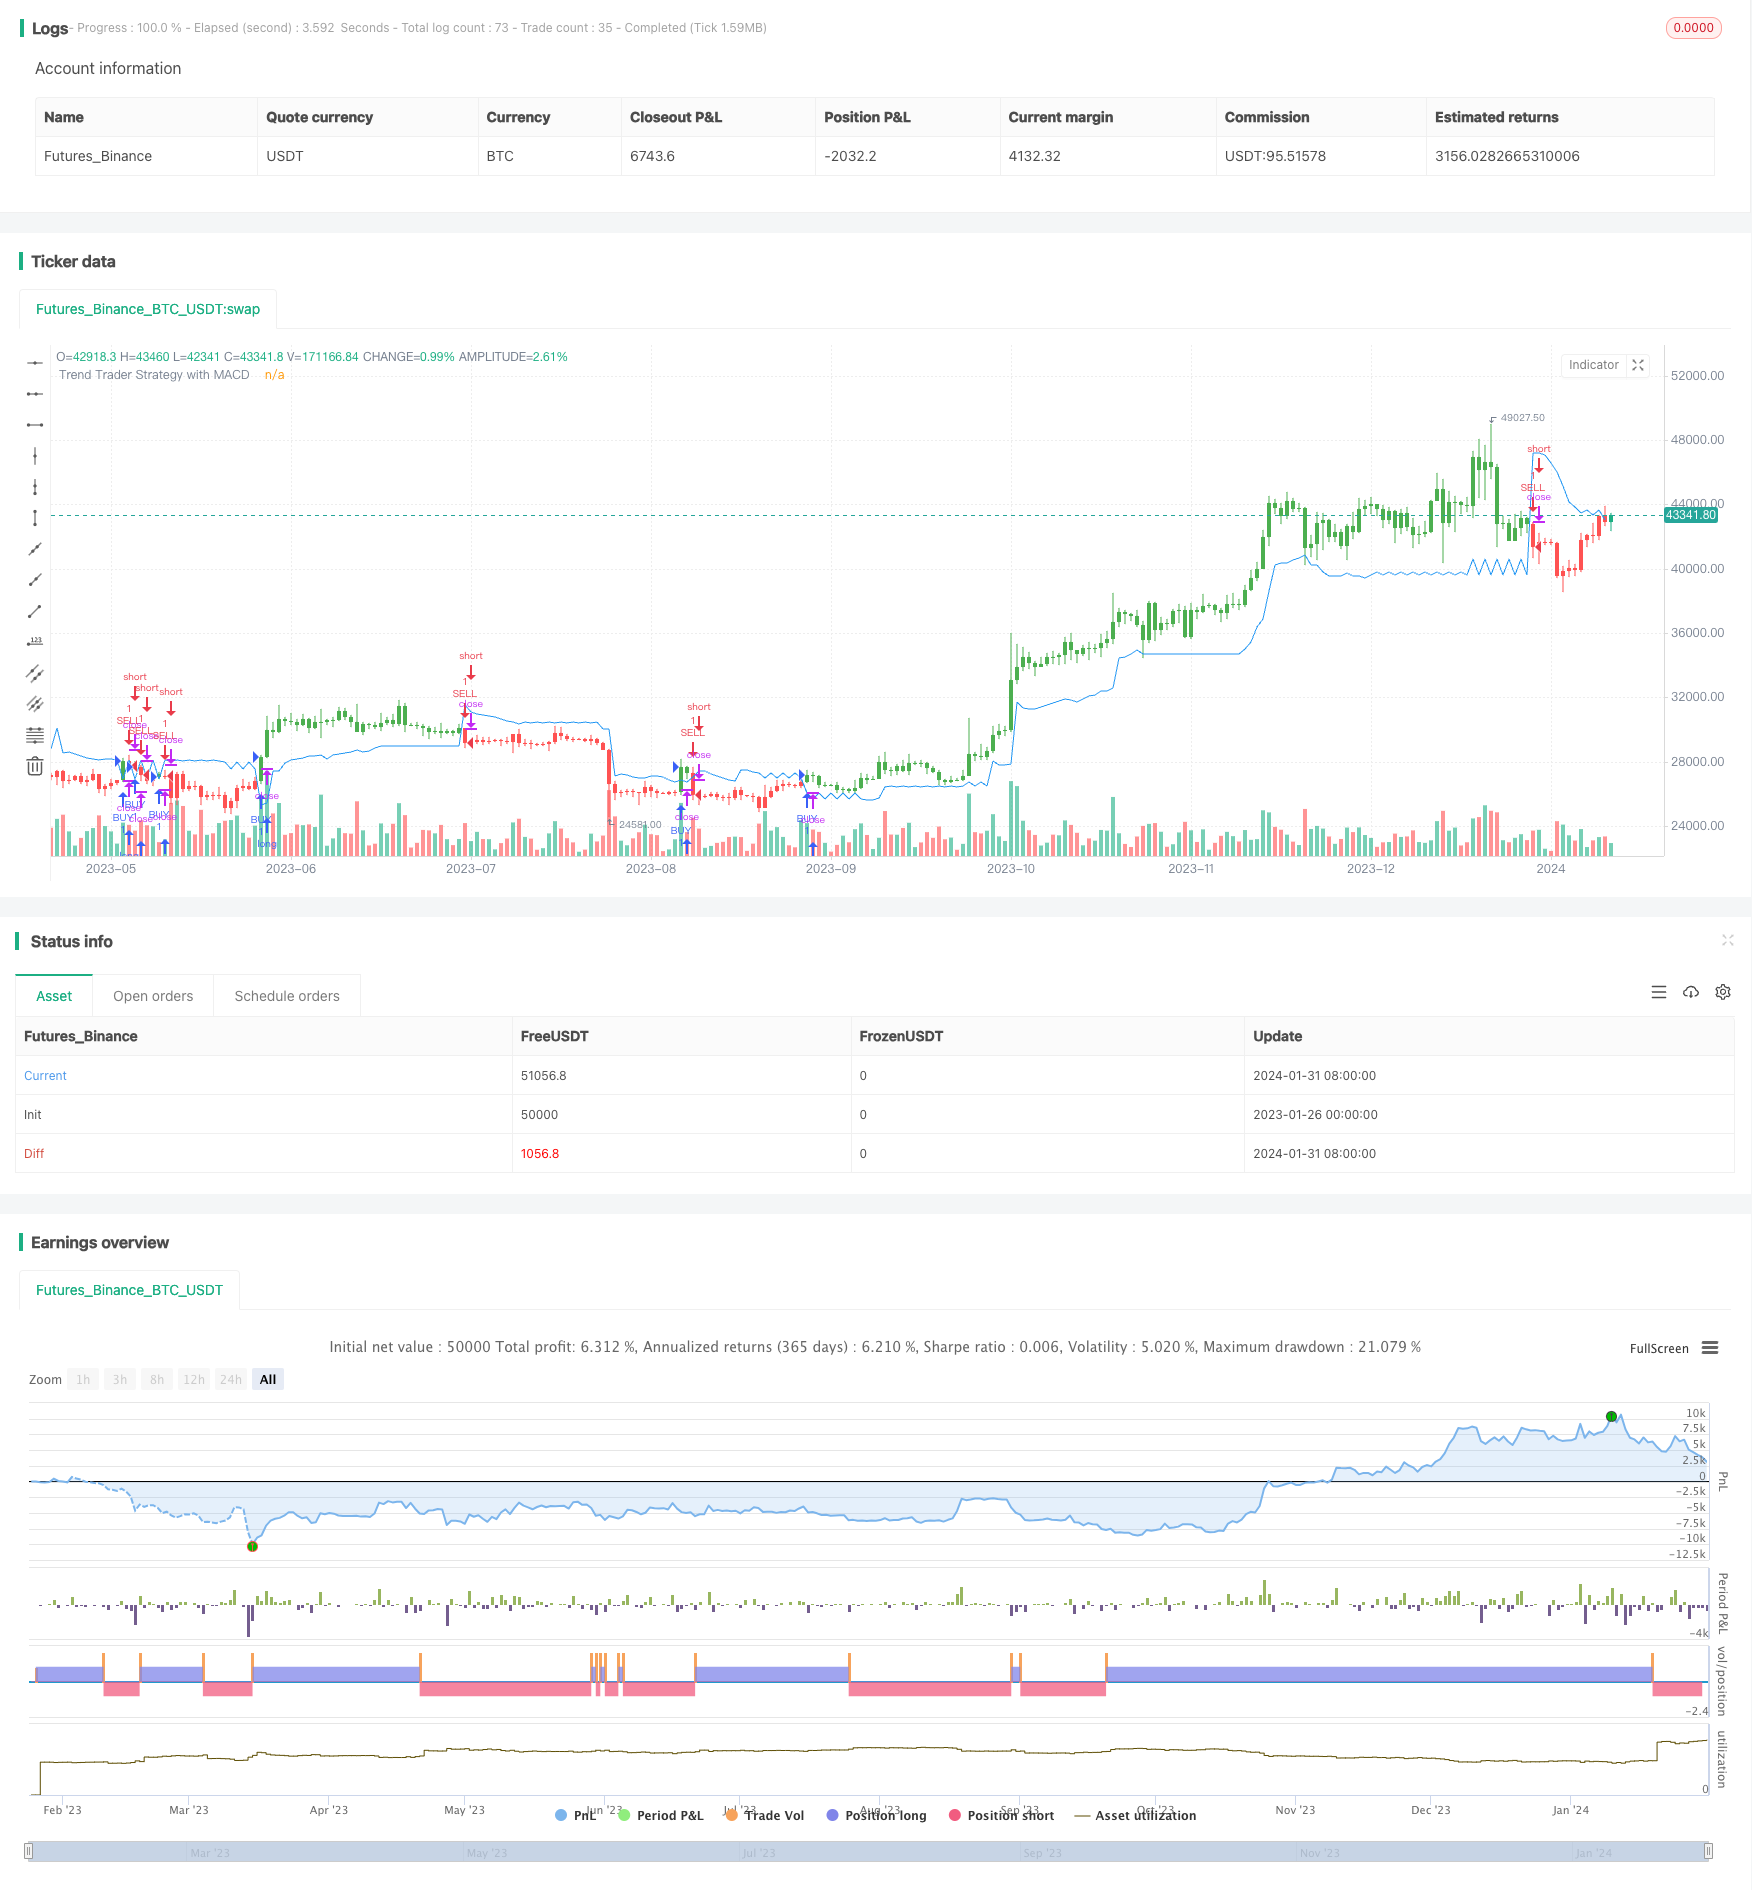
Overview
The core of this strategy is based on the indicator developed in the article "Trading the Trend" published by Andrew Abraham in TASC magazine September 1998 issue. The indicator utilizes average true range and price channel to determine market trend direction, combined with MACD indicator for trade signal filtering, aiming to capture medium-long term trends.
Strategy Logic
The strategy first calculates 21-day weighted moving average of average true range (ATR) as a baseline volatility range. Then it calculates highest and lowest prices over the past 21 days. By comparing current close price with upper and lower limits of the baseline range, it judges whether price breaks out of the channel to determine trend direction.
Specifically, the upper channel limit is defined as the highest price over past 21 days minus 3 times baseline ATR, and the lower channel limit is the lowest price over past 21 days plus 3 times baseline ATR. When close price is higher than the upper limit, it signals a bullish trend. When close price is lower than the lower limit, it signals a bearish trend.
While determining trend direction, this strategy also introduces MACD indicator for filtering. It only generates buy signals when MACD histogram is positive to avoid missing buy opportunities.
Advantages
This strategy combines trend determination and indicator filtering, which can effectively identify mid-long term market trend direction without being misguided by short-term fluctuations. The main advantages are:
- Using price channel to determine trends and accurately identify long term direction
- The dynamic baseline volatility range adapts to market changes
- MACD filtering provides additional decision support to avoid missing buy points
- Configurable parameters offer flexibility in adjusting strategy style
Risks
The strategy also has some risks, mainly in the following aspects:
- Risk of price channel being broken
- Risk of MACD signaling errors
- Inadequate parameter setup may cause strategy instability
These risks can be reduced by optimizing parameters, strict position sizing, and timely stop loss.
Optimization Directions
The strategy can be optimized in the following main aspects:
- Test different parameter combinations to find optimum
Test different combinations of Length or Multiplier to find the parameter combination that yields the highest return based on backtest.
- Add filtering with other indicators
Test incorporating RSI, KDJ and other indicators to filter signals and improve profitability.
- Dynamically adjust parameters
Adapt parameters dynamically based on market conditions, such as appropriately widening channel range when trend is strong, or tightening range when market is more range-bound.
Summary
In summary, this is an overall robust trend following strategy. By combining price channel trend determination and MACD filtering, it can effectively identify mid-long term trends and generate steady returns. With parameter optimization, risk management, and appropriate adjustments, this strategy can become an integral part of a trading system.
Parameters
| Name | Default | What it controls |
|---|---|---|
| v_input_1 | 21 | Length |
| v_input_2 | 3 | Multiplier |
| v_input_3 | true | Control 'MACD Histogram is positive?' when Buy condition |
| v_input_4 | true | From Month |
| v_input_5 | true | From Day |
| v_input_6 | 2020 | From Year |
| v_input_7 | true | To Month |
| v_input_8 | true | To Day |
| v_input_9 | 9999 | To Year |
Source Pine Script
/*backtest
start: 2023-01-26 00:00:00
end: 2024-02-01 00:00:00
period: 1d
basePeriod: 1h
exchanges: [{"eid":"Futures_Binance","currency":"BTC_USDT"}]
*/

// This source code is subject to the terms of the Mozilla Public License 2.0 at https://mozilla.org/MPL/2.0/
// © melihtuna

//@version=1
strategy("Trend Trader Strategy with MACD", overlay=true)

// === Trend Trader Strategy ===
Length = input(21),
Multiplier = input(3, minval=1)
MacdControl = input(true, title="Control 'MACD Histogram is positive?' when Buy condition")
avgTR      = wma(atr(1), Length)
highestC   = highest(Length)
lowestC    = lowest(Length)
hiLimit = highestC[1]-(avgTR[1] * Multiplier)
loLimit = lowestC[1]+(avgTR[1] * Multiplier)
ret = iff(close > hiLimit and close > loLimit, hiLimit,
        iff(close < loLimit and close < hiLimit, loLimit, nz(ret[1], 0)))
pos =	iff(close > ret, 1,
	    iff(close < ret, -1, nz(pos[1], 0)))
barcolor(pos == -1 ? red: pos == 1 ? green : blue )
plot(ret, color= blue , title="Trend Trader Strategy with MACD")

// === INPUT BACKTEST RANGE ===
FromMonth = input(defval = 1, title = "From Month", minval = 1, maxval = 12)
FromDay   = input(defval = 1, title = "From Day", minval = 1, maxval = 31)
FromYear  = input(defval = 2020, title = "From Year", minval = 2017)
ToMonth   = input(defval = 1, title = "To Month", minval = 1, maxval = 12)
ToDay     = input(defval = 1, title = "To Day", minval = 1, maxval = 31)
ToYear    = input(defval = 9999, title = "To Year", minval = 2017)

// === FUNCTION EXAMPLE ===
start     = timestamp(FromYear, FromMonth, FromDay, 00, 00)  // backtest start window
finish    = timestamp(ToYear, ToMonth, ToDay, 23, 59)        // backtest finish window
window()  => true

// === MACD ===
[macdLine, signalLine, histLine] = macd(close, 12, 26, 9)
macdCond= MacdControl ? histLine[0] > 0 ? true : false : true

strategy.entry("BUY", strategy.long, when = window() and pos == 1 and macdCond)
strategy.entry("SELL", strategy.short, when = window() and pos == -1)
Published by ChaoZhang on the FMZ strategy square · last modified 2024-02-02. Collected in the Quant Trading Vault. Unvalidated research: re-test with your own data and costs before trusting it.
Build this with AgenKit
A spec is not a trading system. Paste this into your coding agent and AgenKit runs a specialist team — architecture, test-first build, risk gates, review — with paper trading on by default.
/agenkit build a production-grade trading bot with a backtest engine, risk controls and paper trading by default from strategies/Trend-Trading-Strategy-Based-on-MACD-Indicator.md- npx agenkit install engineering-kit in your project
- Paste the command into your agent and approve each phase
- Get tests, backtest, risk controls and a paper-trading switch
Understand it first
Before you run this, read the lesson behind the idea and how to backtest it honestly. Specs like this one are the survivors of an unknown number of trials; deflate their results accordingly.
Related specs
- Adaptive ATR and RSI Trend Following Strategy with Trailing Stop LossPine Script · Trend following · 1h
- Advanced Supertrend Indicator Trading Mechanism Optimization StrategyPine Script · Trend following · 1d
- Bollinger Bands and RSI Trend Following StrategyPine Script · Trend following · 1h
- Dual ATR Channel Trend Following StrategyPine Script · Trend following · 15m
- Dual Indicator Dynamic Trend Trading Strategy Multi dimensional Technical Analysis System Based on RSI and MACDPine Script · Trend following
- Dynamic Dual EMA Crossover Strategy with Adaptive Profit Loss ControlPine Script · Trend following · 1d