Strategy vault / Trend following
Zero Lag MACD Dual Crossover Trading Strategy High Frequency Trading Based on Short Term Trend Capture
This strategy is based on the zero-lag version of the MACD (Moving Average Convergence Divergence) indicator, which captures short-term trends by quickly responding to price changes, enabling high-frequency trading…
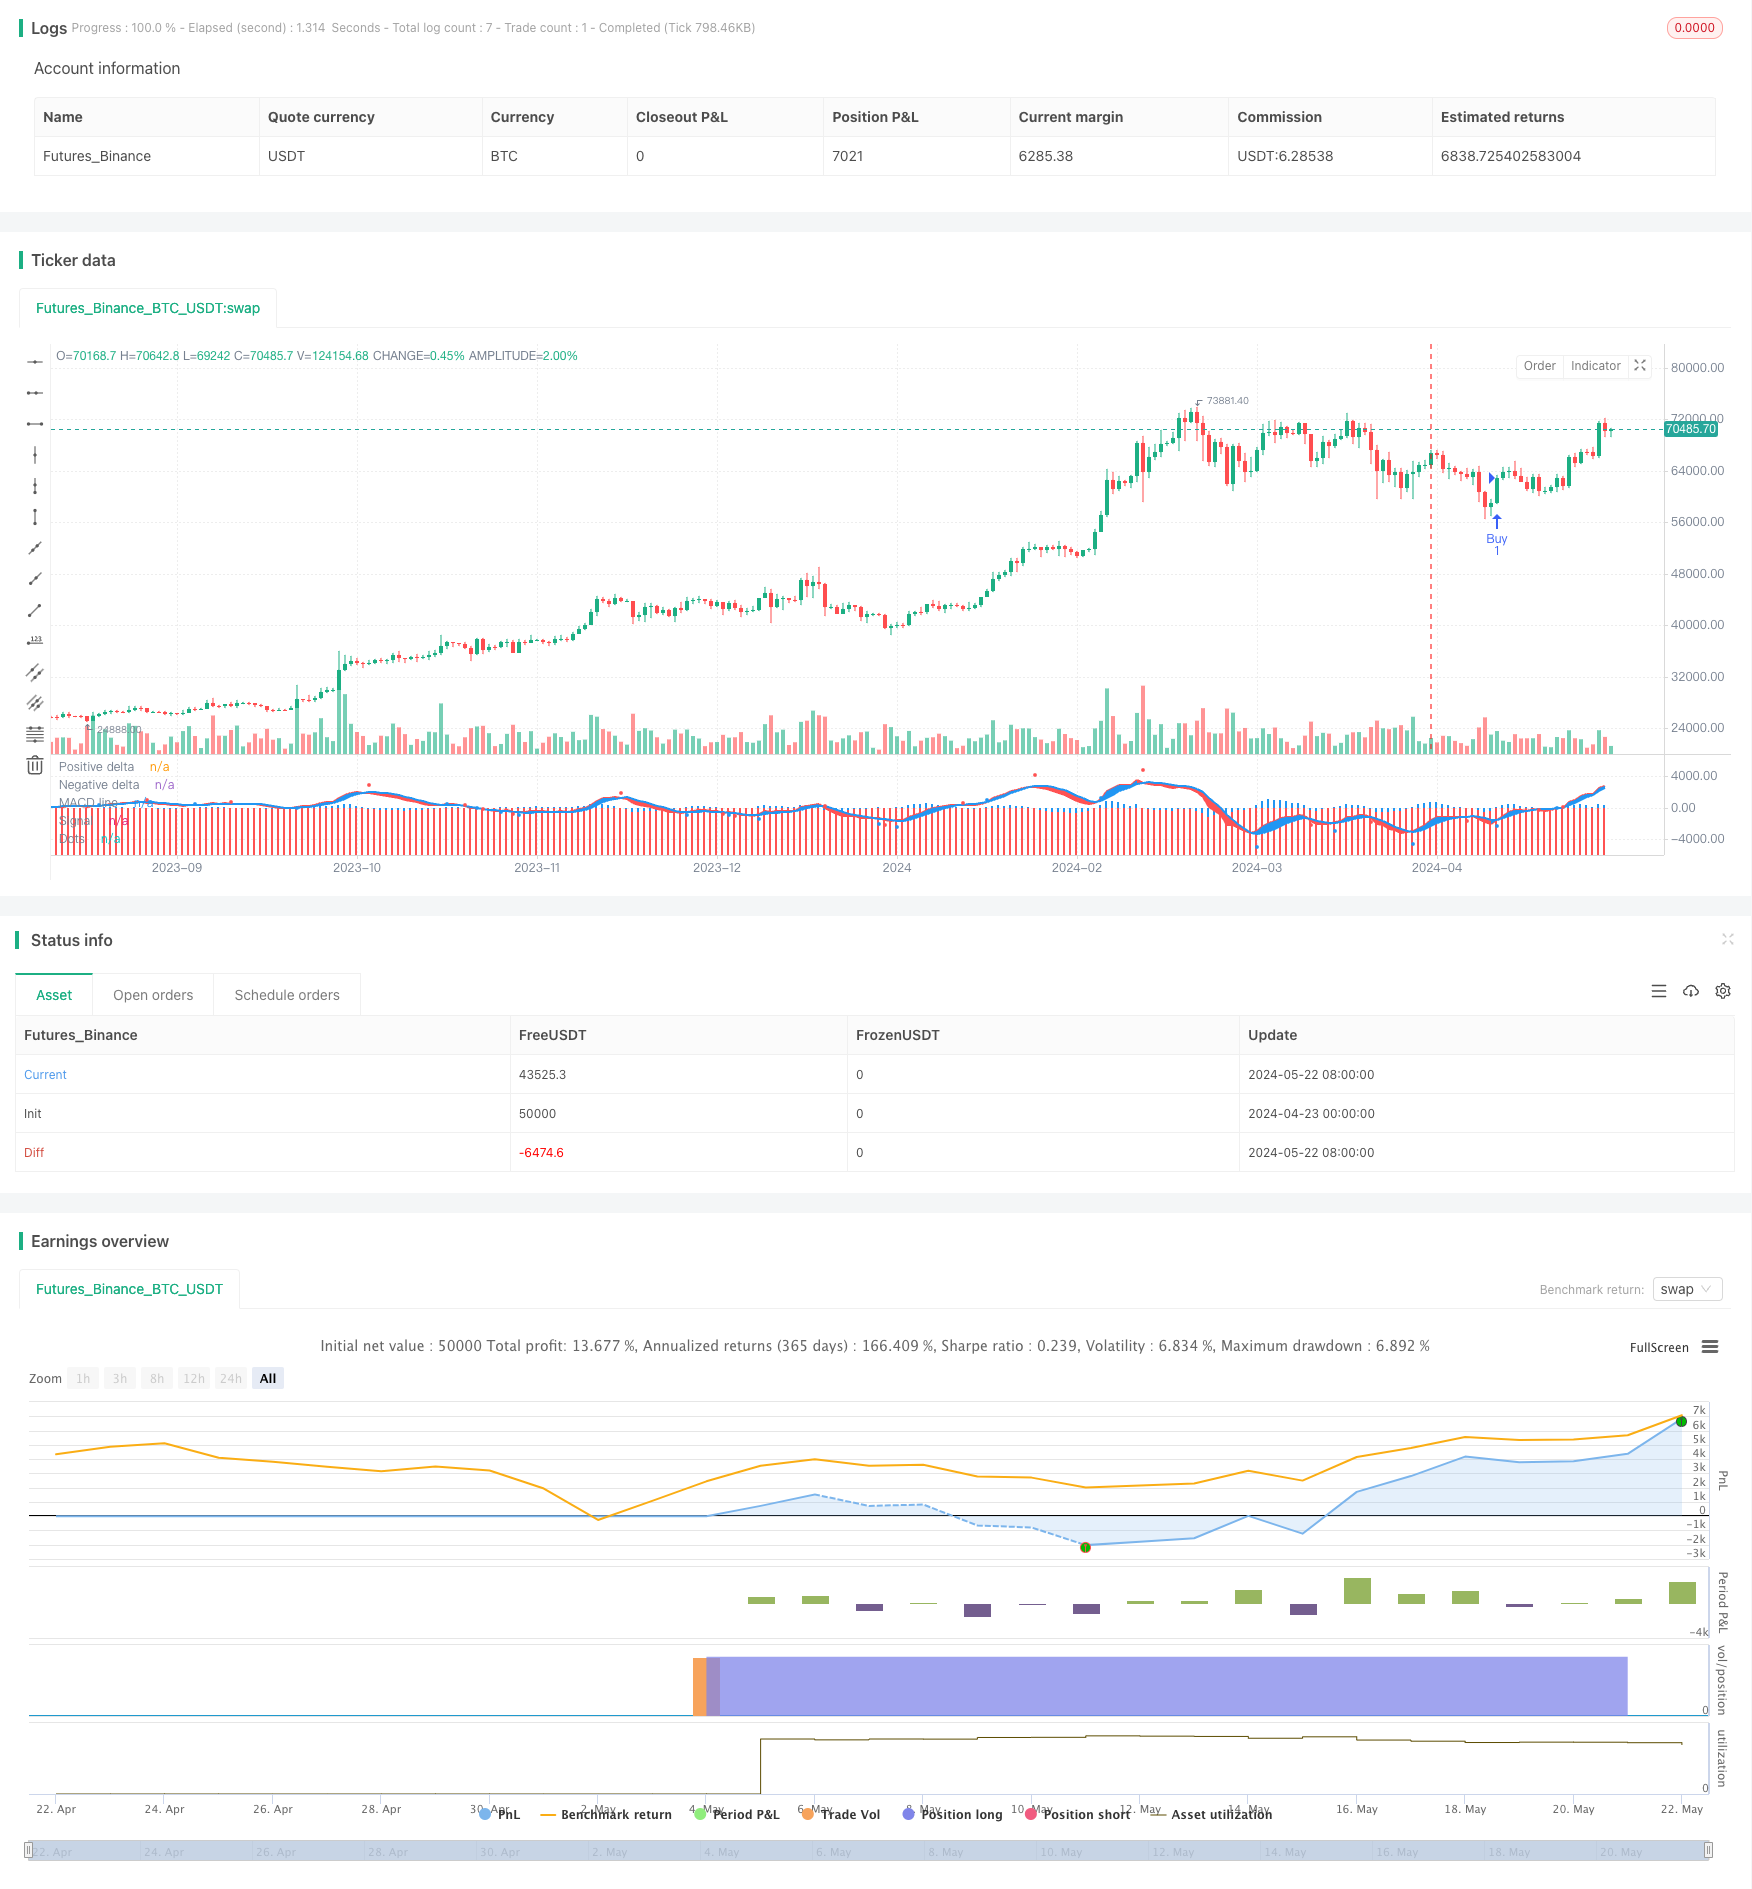
Overview
This strategy is based on the zero-lag version of the MACD (Moving Average Convergence Divergence) indicator, which captures short-term trends by quickly responding to price changes, enabling high-frequency trading. The strategy uses two moving averages with different periods (fast and slow lines) to construct the MACD indicator and introduces a zero-lag algorithm to eliminate the delay between the indicator and the price, improving the timeliness of signals. Additionally, the crossover of the signal line and the MACD line is used as buy and sell signals, and alerts are set up to help traders seize trading opportunities in a timely manner.
Strategy Principle
- Calculate the EMA (Exponential Moving Average) or SMA (Simple Moving Average) of the fast line (default 12 periods) and slow line (default 26 periods).
- Use the zero-lag algorithm to double-smooth the fast and slow lines, eliminating the delay between the indicator and the price.
- The MACD line is formed by the difference between the zero-lag fast line and the zero-lag slow line.
- The signal line is formed by the EMA (default 9 periods) or SMA of the MACD line.
- The MACD histogram is formed by the difference between the MACD line and the signal line, with blue representing positive values and red representing negative values.
- When the MACD line crosses the signal line from below and the crossover point is below the zero axis, a buy signal (blue dot) is generated.
- When the MACD line crosses the signal line from above and the crossover point is above the zero axis, a sell signal (red dot) is generated.
- The strategy automatically places orders based on the buy and sell signals and triggers corresponding alerts.
Advantage Analysis
- The zero-lag algorithm effectively eliminates the delay between the indicator and the price, improving the timeliness and accuracy of signals.
- The design of dual moving averages can better capture market trends and adapt to different market environments.
- The MACD histogram intuitively reflects the comparison of bullish and bearish forces, assisting in trading decisions.
- The automatic order placement and alert functions make it convenient for traders to seize trading opportunities in a timely manner, improving trading efficiency.
Risk Analysis
- In volatile markets, frequent crossover signals may lead to overtrading and losses.
- Improper parameter settings may cause signal distortion and affect strategy performance.
- The strategy relies on historical data for calculations and has poor adaptability to sudden events and black swan events.
Optimization Direction
- Introduce trend confirmation indicators, such as ADX, to filter out false signals in volatile markets.
- Optimize parameters to find the best combination of fast and slow line periods and signal line periods, improving strategy stability.
- Combine other technical indicators or fundamental factors to construct a multi-factor model, improving risk-adjusted returns of the strategy.
- Introduce stop-loss and take-profit mechanisms to control single-trade risk.
Summary
The MACD Dual Crossover Zero Lag Trading Strategy achieves high-frequency trading by quickly responding to price changes and capturing short-term trends. The zero-lag algorithm and dual moving average design improve the timeliness and accuracy of signals. The strategy has certain advantages, such as intuitive signals and convenient operation, but also faces risks such as overtrading and parameter sensitivity. In the future, the strategy can be optimized by introducing trend confirmation indicators, parameter optimization, multi-factor models, etc., to improve the robustness and profitability of the strategy.
Source Pine Script
/*backtest
start: 2024-04-23 00:00:00
end: 2024-05-23 00:00:00
period: 1d
basePeriod: 1h
exchanges: [{"eid":"Futures_Binance","currency":"BTC_USDT"}]
*/

//@version=4
strategy("BNM INTRADAY SETUP MACD 3M - Version 1.2", shorttitle="Zero Lag MACD Enhanced 1.2")
source = close

fastLength = input(12, title="Fast MM period", minval=1)
slowLength = input(26,title="Slow MM period", minval=1)
signalLength =input(9,title="Signal MM period", minval=1)
useEma = input(true, title="Use EMA (otherwise SMA)")
useOldAlgo = input(false, title="Use Glaz algo (otherwise 'real' original zero lag)")
showDots = input(true, title="Show symbols to indicate crossing")
dotsDistance = input(1.5, title="Symbols distance factor", minval=0.1)

// Fast line
ma1 = useEma ? ema(source, fastLength) : sma(source, fastLength)
ma2 = useEma ? ema(ma1, fastLength) : sma(ma1, fastLength)
zerolagEMA = ((2 * ma1) - ma2)

// Slow line
mas1 = useEma ? ema(source, slowLength) : sma(source, slowLength)
mas2 = useEma ? ema(mas1, slowLength) : sma(mas1, slowLength)
zerolagslowMA = ((2 * mas1) - mas2)

// MACD line
ZeroLagMACD = zerolagEMA - zerolagslowMA

// Signal line
emasig1 = ema(ZeroLagMACD, signalLength)
emasig2 = ema(emasig1, signalLength)
signal = useOldAlgo ? sma(ZeroLagMACD, signalLength) : (2 * emasig1) - emasig2

hist = ZeroLagMACD - signal

upHist = (hist > 0) ? hist : 0
downHist = (hist <= 0) ? hist : 0

p1 = plot(upHist, color=color.blue, transp=40, style=plot.style_columns, title='Positive delta')
p2 = plot(downHist, color=color.red, transp=40, style=plot.style_columns, title='Negative delta')

zeroLine = plot(ZeroLagMACD, color=color.red, transp=0, linewidth=2, title='MACD line')
signalLine = plot(signal, color=color.blue, transp=0, linewidth=2, title='Signal')

ribbonDiff = hist > 0 ? color.blue : color.red
fill(zeroLine, signalLine, color=ribbonDiff)

circleYPosition = signal * dotsDistance
ribbonDiff2 = hist > 0 ? color.blue : color.red

// Generate dots for cross signals
plot(showDots and cross(ZeroLagMACD, signal) ? circleYPosition : na, style=plot.style_circles, linewidth=4, color=ribbonDiff2, title='Dots')

// Alerts for buy and sell signals
buySignal = cross(ZeroLagMACD, signal) and (ribbonDiff2 == color.blue) and (ZeroLagMACD < 0)
sellSignal = cross(ZeroLagMACD, signal) and (ribbonDiff2 == color.red) and (ZeroLagMACD > 0)

// Use 'strategy.entry' for placing orders in strategy context
if (buySignal)
    strategy.entry("Buy", strategy.long)
    alert("Buy Signal: Blue dot below zero line", alert.freq_once_per_bar_close)

if (sellSignal)
    strategy.entry("Sell", strategy.short)
    alert("Sell Signal: Red dot above zero line", alert.freq_once_per_bar_close)
Published by ChaoZhang on the FMZ strategy square · last modified 2024-05-24. Collected in the Quant Trading Vault. Unvalidated research: re-test with your own data and costs before trusting it.
Build this with AgenKit
A spec is not a trading system. Paste this into your coding agent and AgenKit runs a specialist team — architecture, test-first build, risk gates, review — with paper trading on by default.
/agenkit build a production-grade trading bot with a backtest engine, risk controls and paper trading by default from strategies/Zero-Lag-MACD-Dual-Crossover-Trading-Strategy-High-Frequency-Trading-Based-on-Short-Term-Trend-Capture.md- npx agenkit install engineering-kit in your project
- Paste the command into your agent and approve each phase
- Get tests, backtest, risk controls and a paper-trading switch
Understand it first
Before you run this, read the lesson behind the idea and how to backtest it honestly. Specs like this one are the survivors of an unknown number of trials; deflate their results accordingly.
Related specs
- Bollinger Bands and RSI Trend Following StrategyPine Script · Trend following · 1h
- Dual ATR Channel Trend Following StrategyPine Script · Trend following · 15m
- Dual MA Crossover Trend Tracking StrategyPine Script · Trend following · 1h
- Dynamic Dual EMA Crossover Strategy with Adaptive Profit Loss ControlPine Script · Trend following · 1d
- EMA SMA Multi Indicator Comprehensive Trend Following StrategyPine Script · Trend following · 1h
- EMA and RSI Trend Trading StrategyPine Script · Trend following · 1d