Strategy vault / Trend following
Adaptive Trend Following Strategy with Dynamic Take Profit Using Multiple Technical Indicators
This strategy is a trend-following trading system that combines Moving Averages (EMA), momentum indicator (MACD), and overbought/oversold indicator (RSI) for signal generation and risk control. The strategy employs a…
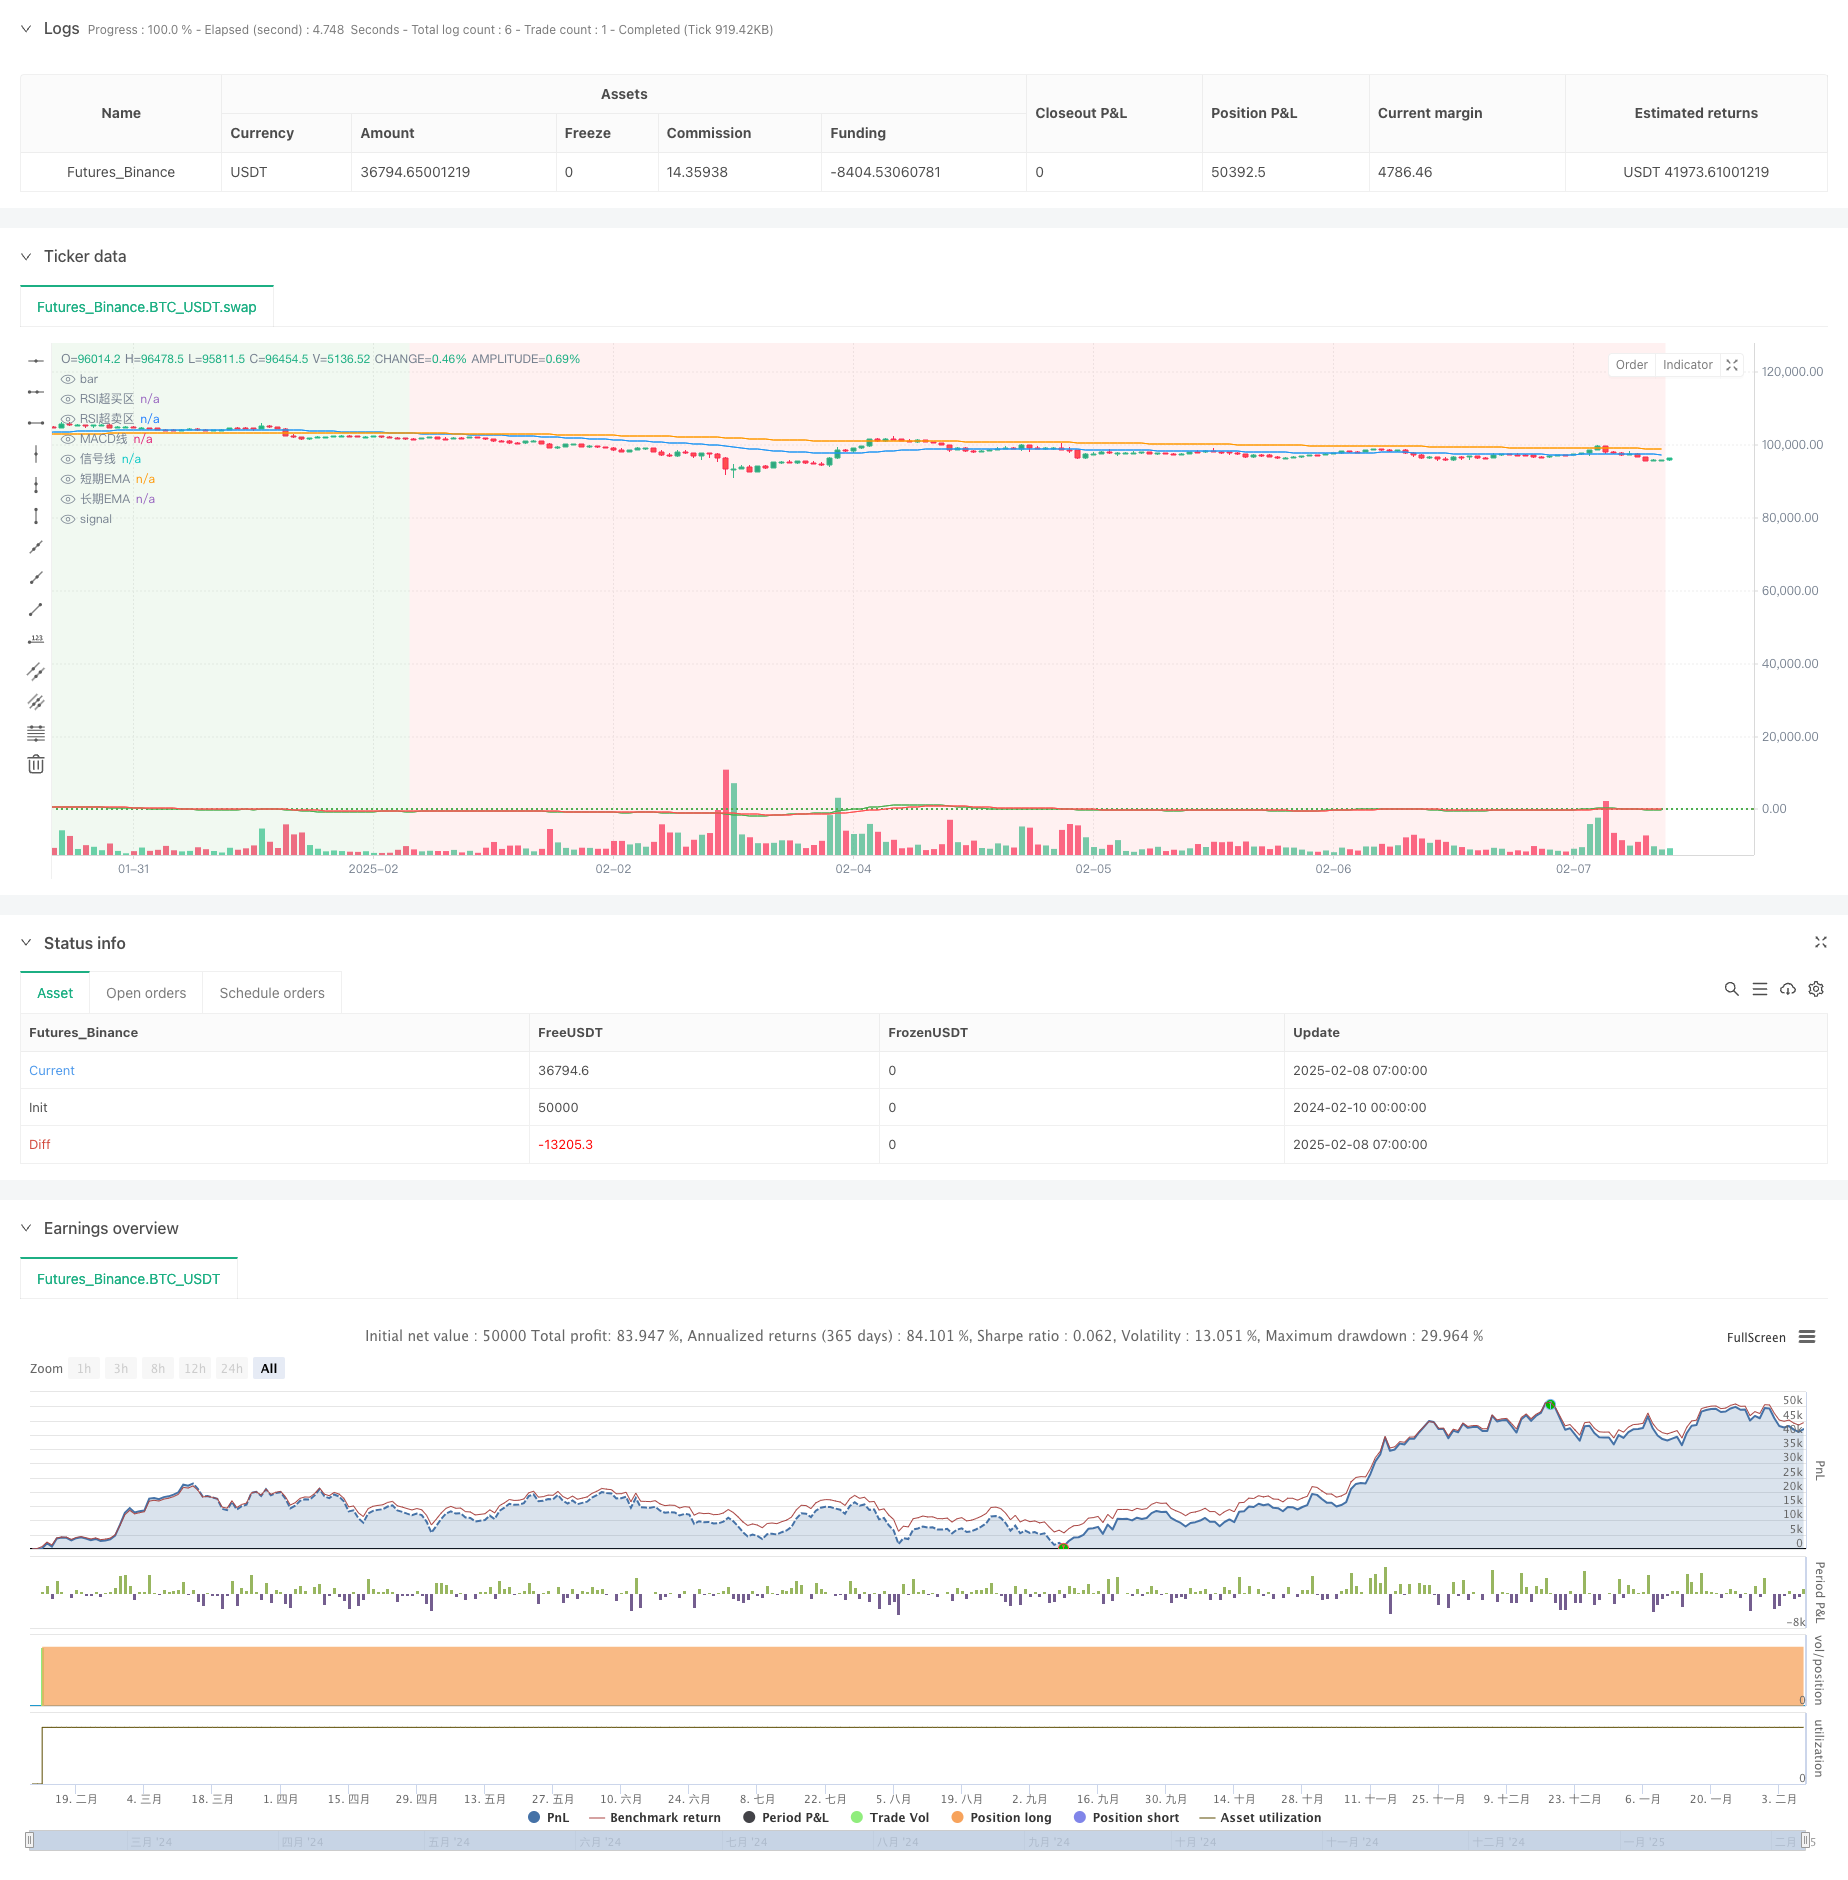
Overview
This strategy is a trend-following trading system that combines Moving Averages (EMA), momentum indicator (MACD), and overbought/oversold indicator (RSI) for signal generation and risk control. The strategy employs a dynamic take-profit mechanism, utilizing multiple technical indicators to assess market conditions and effectively capture trends. It also implements a fixed stop-loss for risk control, creating a balanced and robust trading system.
Strategy Principles
The core logic of the strategy is based on the following aspects:
- Trend Identification: Uses 50-period and 200-period EMA system to determine market trend, with bullish trend confirmed when short-term EMA is above long-term EMA.
- Entry Signals: Combines trend confirmation with MACD golden cross (12,26,9) and RSI(14) not in overbought territory (<70) as long entry conditions.
- Dynamic Take-Profit: Monitors multiple market state indicators for exit timing:
- Trend Reversal: Short-term EMA crosses below long-term EMA or price drops below short-term EMA
- MACD Death Cross: MACD line crosses below signal line
- RSI Overbought Pullback: RSI exceeds 70 and starts declining
- Risk Control: Implements fixed stop-loss at 1.5% below entry price.
Strategy Advantages
- Multi-dimensional Signal Confirmation: Combines trend, momentum, and overbought/oversold indicators to enhance signal reliability.
- Flexible Take-Profit Mechanism: Dynamic take-profit avoids premature exits associated with fixed take-profit levels, better capturing trending markets.
- Clear Risk Control: Fixed stop-loss percentage ensures controlled risk for each trade.
- Clear Strategy Logic: Each indicator's role is well-defined, facilitating understanding and optimization.
- High Adaptability: Core logic can be adapted to different trading instruments and timeframes through parameter adjustment.
Strategy Risks
- Choppy Market Risk: Moving average system may generate excessive false signals in ranging markets.
- Lag Risk: Technical indicators have inherent lag, potentially missing optimal entry/exit points in fast-moving markets.
- Parameter Sensitivity: Multiple indicator parameters affect strategy performance, requiring thorough testing.
- Market Environment Dependency: Strategy performs better in trending markets but may underperform in other market conditions.
Strategy Optimization Directions
- Incorporate Volume-Price Indicators: Consider adding volume and money flow indicators to enhance signal reliability.
- Dynamic Parameter Optimization: Dynamically adjust indicator parameters based on market volatility to improve adaptability.
- Enhance Take-Profit Mechanism: Implement multi-level take-profit with different exit conditions at various price levels.
- Add Market Environment Filters: Include volatility and trend strength indicators to assess strategy suitability.
- Optimize Stop-Loss Mechanism: Consider implementing trailing stops or ATR-based dynamic stops for more flexible risk control.
Summary
The strategy combines multiple technical indicators to create a trading system that balances trend following with risk control. The dynamic take-profit mechanism demonstrates deep market understanding, while clear stop-loss settings ensure controlled risk. The strategy framework offers good extensibility, with potential for improved trading performance through further optimization and refinement.
Source Pine Script
/*backtest
start: 2024-02-10 00:00:00
end: 2025-02-08 08:00:00
period: 1h
basePeriod: 1h
exchanges: [{"eid":"Futures_Binance","currency":"BTC_USDT"}]
*/

//@version=5
strategy("BTC 15Minute dynamic take-profit strategy", overlay=true)

// === Parameter Settings ===
// EMA Parameters
ema_short_length = input.int(50, title="Short termEMALength", minval=1)
ema_long_length = input.int(200, title="Long termEMALength", minval=1)

// MACD Parameters
macd_fast_length = input.int(12, title="MACDfast line length", minval=1)
macd_slow_length = input.int(26, title="MACDSlow line length", minval=1)
macd_signal_length = input.int(9, title="MACDsignal line length", minval=1)

// RSI Parameters
rsi_length = input.int(14, title="RSILength", minval=1)
rsi_overbought = input.int(70, title="RSIoverbought area", minval=1, maxval=100)
rsi_oversold = input.int(30, title="RSIoversold area", minval=1, maxval=100)

// Stop loss parameters
stop_loss_pct = input.float(1.5, title="Stop Loss Percentage", minval=0.1)

// === Indicator calculation ===
// moving average
ema_short = ta.ema(close, ema_short_length)
ema_long = ta.ema(close, ema_long_length)

// MACD
[macd_line, signal_line, _] = ta.macd(close, macd_fast_length, macd_slow_length, macd_signal_length)

// RSI
rsi = ta.rsi(close, rsi_length)

// === Trend filtering ===
bullish_trend = ema_short > ema_long  // Bull trend: short-term moving average is above long-term moving average
bearish_trend = ema_short < ema_long  // Bear trend: short-term moving average is below long-term moving average

// === Buying conditions ===
// 1. EMA Show Bull Trend
// 2. MACD golden cross(MACD Line breaks above the signal line)
// 3. RSI Not in Overbought Area
buy_signal = bullish_trend and ta.crossover(macd_line, signal_line) and rsi < rsi_overbought

// === Warning signal (dynamic take-profit condition)) ===
// 1. Trend reversal: The short-term moving average breaks below the long-term moving average, or the price falls below the short-term moving average
// 2. MACD death cross:MACD Line falls below the signal line
// 3. RSI:RSI Overbought and starting to retreat
danger_signal = bearish_trend or close < ema_short or ta.crossunder(macd_line, signal_line) or (rsi > rsi_overbought and ta.falling(rsi, 2))  // Check RSI Recent2Is the Period Falling

// === Strategy execution ===
if (buy_signal)
    strategy.entry("Buy", strategy.long)

// Dynamic take profit and stop loss
if (strategy.position_size > 0)
    stop_price = strategy.position_avg_price * (1 - stop_loss_pct / 100)  // Fixed stop loss
    strategy.exit("Exit", from_entry="Buy", stop=stop_price, when=danger_signal)

// === Draw charts ===
// EMA Draw
plot(ema_short, color=color.blue, title="Short termEMA")
plot(ema_long, color=color.orange, title="Long termEMA")

// MACD Draw
plot(macd_line, color=color.green, title="MACDLine")
plot(signal_line, color=color.red, title="Signal Line")

// RSI Overbought/Oversold area
hline(rsi_overbought, "RSIoverbought area", color=color.red, linestyle=hline.style_dotted)
hline(rsi_oversold, "RSIoversold area", color=color.green, linestyle=hline.style_dotted)

// Background color: show trend
bgcolor(bullish_trend ? color.new(color.green, 90) : color.new(color.red, 90), title="Trend background")Published by ChaoZhang on the FMZ strategy square · last modified 2025-02-10. Collected in the Quant Trading Vault. Unvalidated research: re-test with your own data and costs before trusting it.
Build this with AgenKit
A spec is not a trading system. Paste this into your coding agent and AgenKit runs a specialist team — architecture, test-first build, risk gates, review — with paper trading on by default.
/agenkit build a production-grade trading bot with a backtest engine, risk controls and paper trading by default from strategies/Adaptive-Trend-Following-Strategy-with-Dynamic-Take-Profit-Using-Multiple-Technical-Indicators.md- npx agenkit install engineering-kit in your project
- Paste the command into your agent and approve each phase
- Get tests, backtest, risk controls and a paper-trading switch
Understand it first
Before you run this, read the lesson behind the idea and how to backtest it honestly. Specs like this one are the survivors of an unknown number of trials; deflate their results accordingly.
Related specs
- Adaptive ATR and RSI Trend Following Strategy with Trailing Stop LossPine Script · Trend following · 1h
- Advanced Multi Indicator Multi Dimensional Trend Cross Quantitative StrategyPine Script · Trend following · 3h
- Bollinger Bands and RSI Trend Following StrategyPine Script · Trend following · 1h
- Dual ATR Channel Trend Following StrategyPine Script · Trend following · 15m
- Dynamic Dual EMA Crossover Strategy with Adaptive Profit Loss ControlPine Script · Trend following · 1d
- EMA SMA Multi Indicator Comprehensive Trend Following StrategyPine Script · Trend following · 1h