Strategy vault / Trend following
Demigod Candlestick MACD Divergence Trend Following Strategy
This strategy calculates the MACD indicator and its MACD histogram to detect divergence signals between the MACD histogram and price movement, thereby generating trading signals. When a new high in price but no new…
Overview
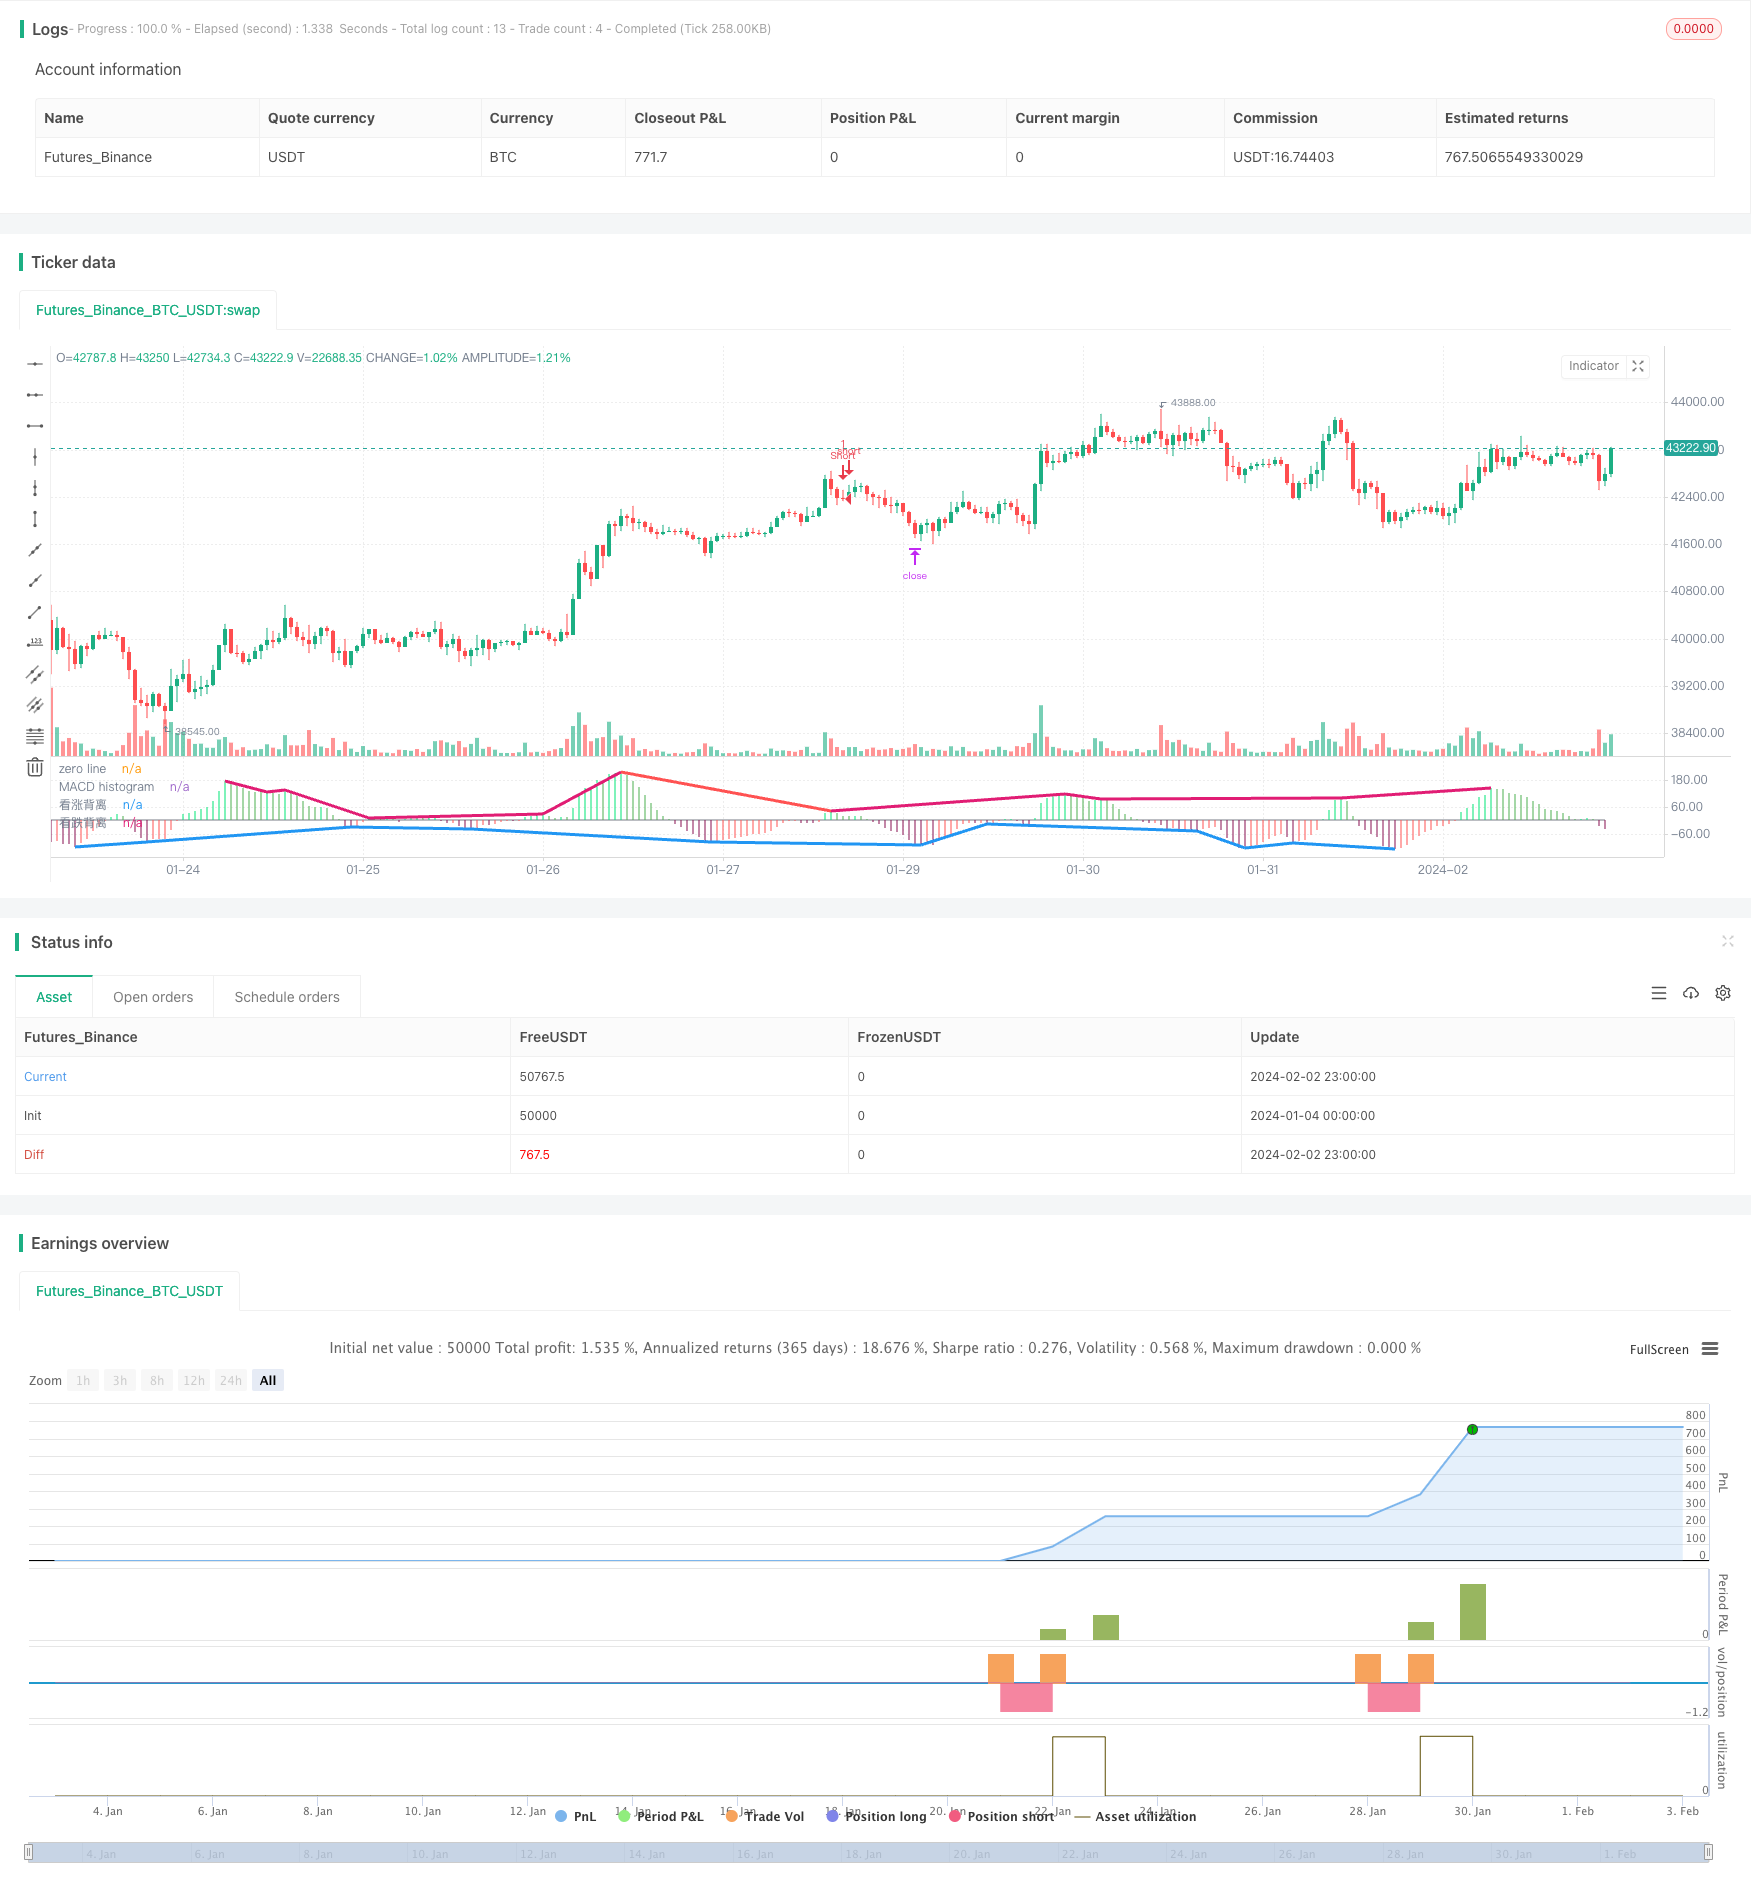
This strategy calculates the MACD indicator and its MACD histogram to detect divergence signals between the MACD histogram and price movement, thereby generating trading signals. When a new high in price but no new high in MACD histogram is detected, a bearish divergence signal is generated. When a new low in price but no new low in MACD histogram is detected, a bullish divergence signal is generated. Combined with ATR indicator for stop loss and take profit, it carries out trend following trades.
Strategy Logic
The core principle of this strategy is to utilize the MACD indicator and its MACD histogram to reflect changes in price trends, and detect divergence signals between the MACD histogram and price as the trigger condition for trading signals.
Specifically, the strategy first calculates the MACD line, Signal line and MACD histogram. Then by defining the fractal function to detect peaks and valleys of the MACD histogram to extract local maximums and minimums. Combined with the highest price and lowest price, it determines whether there is a divergence between the MACD histogram and price.
When price reaches a new high but MACD histogram does not reach a new high, a regular_bearish_div bearish divergence signal is generated. When price drops to a new low but MACD histogram does not drop to a new low, a regular_bullish_div bullish divergence signal is generated.
Finally, when bearish and bullish divergence signals are generated, the strategy issues short and long orders respectively, and exits positions with ATR stop loss and take profit.
Advantage Analysis
This strategy has the following advantages:
By utilizing the divergence feature between MACD histogram and price, it can capture turns in price trends early.
The ATR stop loss and take profit settings are reasonable to effectively control maximum loss per trade.
Using trend following method can maximize locked profit.
Reasonable parameter settings filter out some noisy trading signals.
The strategy logic is clear and easy to understand, easy to validate in live trading.
Risk Analysis
This strategy also has some risks:
MACD divergence does not necessarily lead to price reversal, there are some false signal risks.
Unreasonable stop loss and take profit settings may lead to excessive losses or insufficient profits.
Divergence signals with short cycles may be caused by noise and should be filtered properly.
Incompatible trading products and parameter settings will also affect strategy performance.
Corresponding solutions:
Increase the length and magnitude requirements of divergence to filter false signals.
Use ATR as stop loss and take profit benchmark, adjust ATR multiples to control risks per trade.
Select different parameters for different trading products. Perform parameter optimization to find optimum parameter combinations.
Optimization Directions
This strategy can also be optimized in the following directions:
More complex divergence confirmation, such as volume divergence confirmation.
Optimize MACD parameters to find the best parameter combination.
Optimize the multiples of ATR stop loss and take profit.
Add machine learning algorithms to assist in judging reliability of divergence signals.
Add model prediction to determine probability of price reversal.
Dynamically adjust strategy parameters according to market condition changes.
Summary
In summary, this Demigod Candlestick MACD Divergence Trend Following Strategy utilizes the divergence between MACD histogram and price to capture trends. The reasonable ATR stop loss and take profit settings can control risks per trade. The strategy logic is clear and easy to understand, worth validating in live trading. Follow up optimizations can be made in many aspects to obtain better results.
Parameters
| Name | Default | What it controls |
|---|---|---|
| v_input_int_1 | 13 | (?CDMA)fast Length |
| v_input_int_2 | 34 | slow Length |
| v_input_source_1_close | 0 | source: close | high | low | open | hl2 | hlc3 | hlcc4 | ohlc4 |
| v_input_int_3 | 9 | ma Length |
| v_input_int_4 | 5 | (?Divergence)Divergenc Length |
| v_input_float_1 | 2 | Divergenc Strength |
| v_input_int_5 | 13 | (?ATR)ATR Length |
| v_input_float_2 | true | ATR multyple |
| v_input_color_1 | teal | upper color |
| v_input_color_2 | red | under color |
Source Pine Script
/*backtest
start: 2024-01-04 00:00:00
end: 2024-02-03 00:00:00
period: 1h
basePeriod: 15m
exchanges: [{"eid":"Futures_Binance","currency":"BTC_USDT"}]
*/

// This Pine Script™ code is subject to the terms of the Mozilla Public License 2.0 at https://mozilla.org/MPL/2.0/
// © bigwin_sun
// copyright: Tradingvue Limited

//@version = 5
strategy(title = "Demigod : CDMA histogram Divergence strategy", shorttitle = "Demigod strategy", overlay = false, pyramiding = 100)

//macd input
fastMA = input.int(13, title = "fast Length", minval = 1,     group = "CDMA")
slowMA = input.int(34, title = "slow Length", minval = 1,     group = "CDMA")
src          = input.source(title = "source", defval = close, group = "CDMA")
signalSmooth = input.int(9, title="ma Length", minval = 1,    group = "CDMA")
//Divergenc
divLength    = input.int(title = "Divergenc Length",   defval = 5, minval = 1,   maxval = 50,  inline = "ATRLength",  group = "Divergence")
divStren     = input.float(title="Divergenc Strength", defval = 2, minval = 1.0, maxval = 5.0, inline = "ATRLength",  group = "Divergence")

//atr input
atrLength = input.int(13, title = "ATR Length", minval = 1,   inline = "ATRLength", group = "ATR")
m         = input.float(1.0,  "ATR multyple",   minval = 0.5, inline = "ATRLength", group = "ATR", step = 0.5)
collong   = input.color(color.teal, title = "upper color",  inline = "ATRDisplay", group = "ATR")
colshort  = input.color(color.red,  title = "under color",  inline = "ATRDisplay", group = "ATR")

// MACD---------------------------------------------------------------------------------------------------------------------------------
DivOffset = -2
macdLine   = ta.ema(src, fastMA) - ta.ema(src, slowMA)
signalLine = ta.ema(macdLine, signalSmooth)
histogram  = macdLine - signalLine

histogramColor = if histogram > 0
    histogram > histogram[1] ? color.lime : color.green
else
    histogram < histogram[1] ? color.maroon : color.red

// cdma histogram
plot(histogram, title = "MACD histogram", linewidth = 2, style = plot.style_histogram, color = histogramColor)
plot(0,         title = "zero line",      linewidth = 1,                               color = color.gray)

// Divergenc calculation-------------------------------------------------------------------------------------------------------------------------------------------------------------------------------
//peak / valley fundation
f_top_fractal(_src)=>_src[4] < _src[2] and _src[3] < _src[2] and _src[2] > _src[1] and _src[2] > _src[0] and _src > 0
f_bot_fractal(_src)=>_src[4] > _src[2] and _src[3] > _src[2] and _src[2] < _src[1] and _src[2] < _src[0] and _src < 0
f_fractalize(_src)=>f_top_fractal(_src) ? 1 : f_bot_fractal(_src) ? -1 : 0

//peak / valley value
fractal_top1 = f_fractalize(histogram) > 0 ? true : false //histogram[2] : na
fractal_bot1 = f_fractalize(histogram) < 0 ? true : false //histogram[2] : na

//previouse peak or valley
high_prev1  = ta.valuewhen(fractal_top1, histogram[2], 0)[2]
high_price1 = ta.valuewhen(fractal_top1, high[2], 0)[2]
low_prev1   = ta.valuewhen(fractal_bot1, histogram[2], 0)[2]
low_price1  = ta.valuewhen(fractal_bot1, low[2], 0)[2]

//Divergenc : cdma histogram against candle value
regular_bearish_div1 = high[2] > high_price1 + divStren and histogram[2] < high_prev1 / divStren and ta.barssince(fractal_top1[1]) > divLength
regular_bullish_div1 = low[2]  < low_price1 - divStren  and histogram[2] > low_prev1 / divStren  and ta.barssince(fractal_bot1[1]) > divLength

//-------------------------cdma Divergenc range------------------------------------------------
//histogramColor
col1 = regular_bearish_div1 ? color.red : na
col2 = regular_bullish_div1 ? #00FF00EB : na
//plot
plot(title='Bearish Divergence', series= fractal_top1 ? histogram[2] : na, color=col1, linewidth=3, offset=DivOffset)
plot(title='Bullish Divergence', series= fractal_bot1 ? histogram[2] : na, color=col2, linewidth=3, offset=DivOffset)

// calculate ATR				--------------------------------------------------------------------------------------------------------------------------------------------------
atr = ta.ema(ta.tr(true), atrLength) * m
up = atr + high
dw = low - atr

//stratety : enrty and exit---------------------------------------------------------------------------------------------------------------------------------------------------------------------------------
if regular_bearish_div1 and fractal_top1
//if regular_bullish_div1 and fractal_bot1
    //label.new(bar_index, histogram[2], text = "Short", textcolor = color.white, color = color.gray,  style = label.style_label_lower_left)
    strategy.entry("Short", strategy.short, qty = 1)
    strategy.exit("exitShort", "Short", stop = up, limit = dw - atr)
if regular_bullish_div1 and fractal_bot1
//if regular_bearish_div1 and fractal_top1
    //label.new(bar_index, histogram[2], text = "Long", textcolor = color.white, color = color.fuchsia, style = label.style_label_upper_left)
	strategy.entry("Long", strategy.long, qty = 1)
    strategy.exit("exitLong", "Long", stop = dw, limit = up + atr)
Published by ChaoZhang on the FMZ strategy square · last modified 2024-02-04. Collected in the Quant Trading Vault. Unvalidated research: re-test with your own data and costs before trusting it.
Build this with AgenKit
A spec is not a trading system. Paste this into your coding agent and AgenKit runs a specialist team — architecture, test-first build, risk gates, review — with paper trading on by default.
/agenkit build a production-grade trading bot with a backtest engine, risk controls and paper trading by default from strategies/Demigod-Candlestick-MACD-Divergence-Trend-Following-Strategy.md- npx agenkit install engineering-kit in your project
- Paste the command into your agent and approve each phase
- Get tests, backtest, risk controls and a paper-trading switch
Understand it first
Before you run this, read the lesson behind the idea and how to backtest it honestly. Specs like this one are the survivors of an unknown number of trials; deflate their results accordingly.
Related specs
- Adaptive ATR and RSI Trend Following Strategy with Trailing Stop LossPine Script · Trend following · 1h
- Bollinger Bands and RSI Trend Following StrategyPine Script · Trend following · 1h
- Dual ATR Channel Trend Following StrategyPine Script · Trend following · 15m
- Dual MA Crossover Trend Tracking StrategyPine Script · Trend following · 1h
- Dynamic Dual EMA Crossover Strategy with Adaptive Profit Loss ControlPine Script · Trend following · 1d
- EMA and RSI Trend Trading StrategyPine Script · Trend following · 1d