Strategy vault / Trend following
Low Scanner Smart Tracking Method
The Low Scanner Smart Tracking Method is a non-repainting Forex trading strategy. It uses a low scanner to locate low points and combines with Hull Moving Average for trade signal judgment, which can achieve a high…
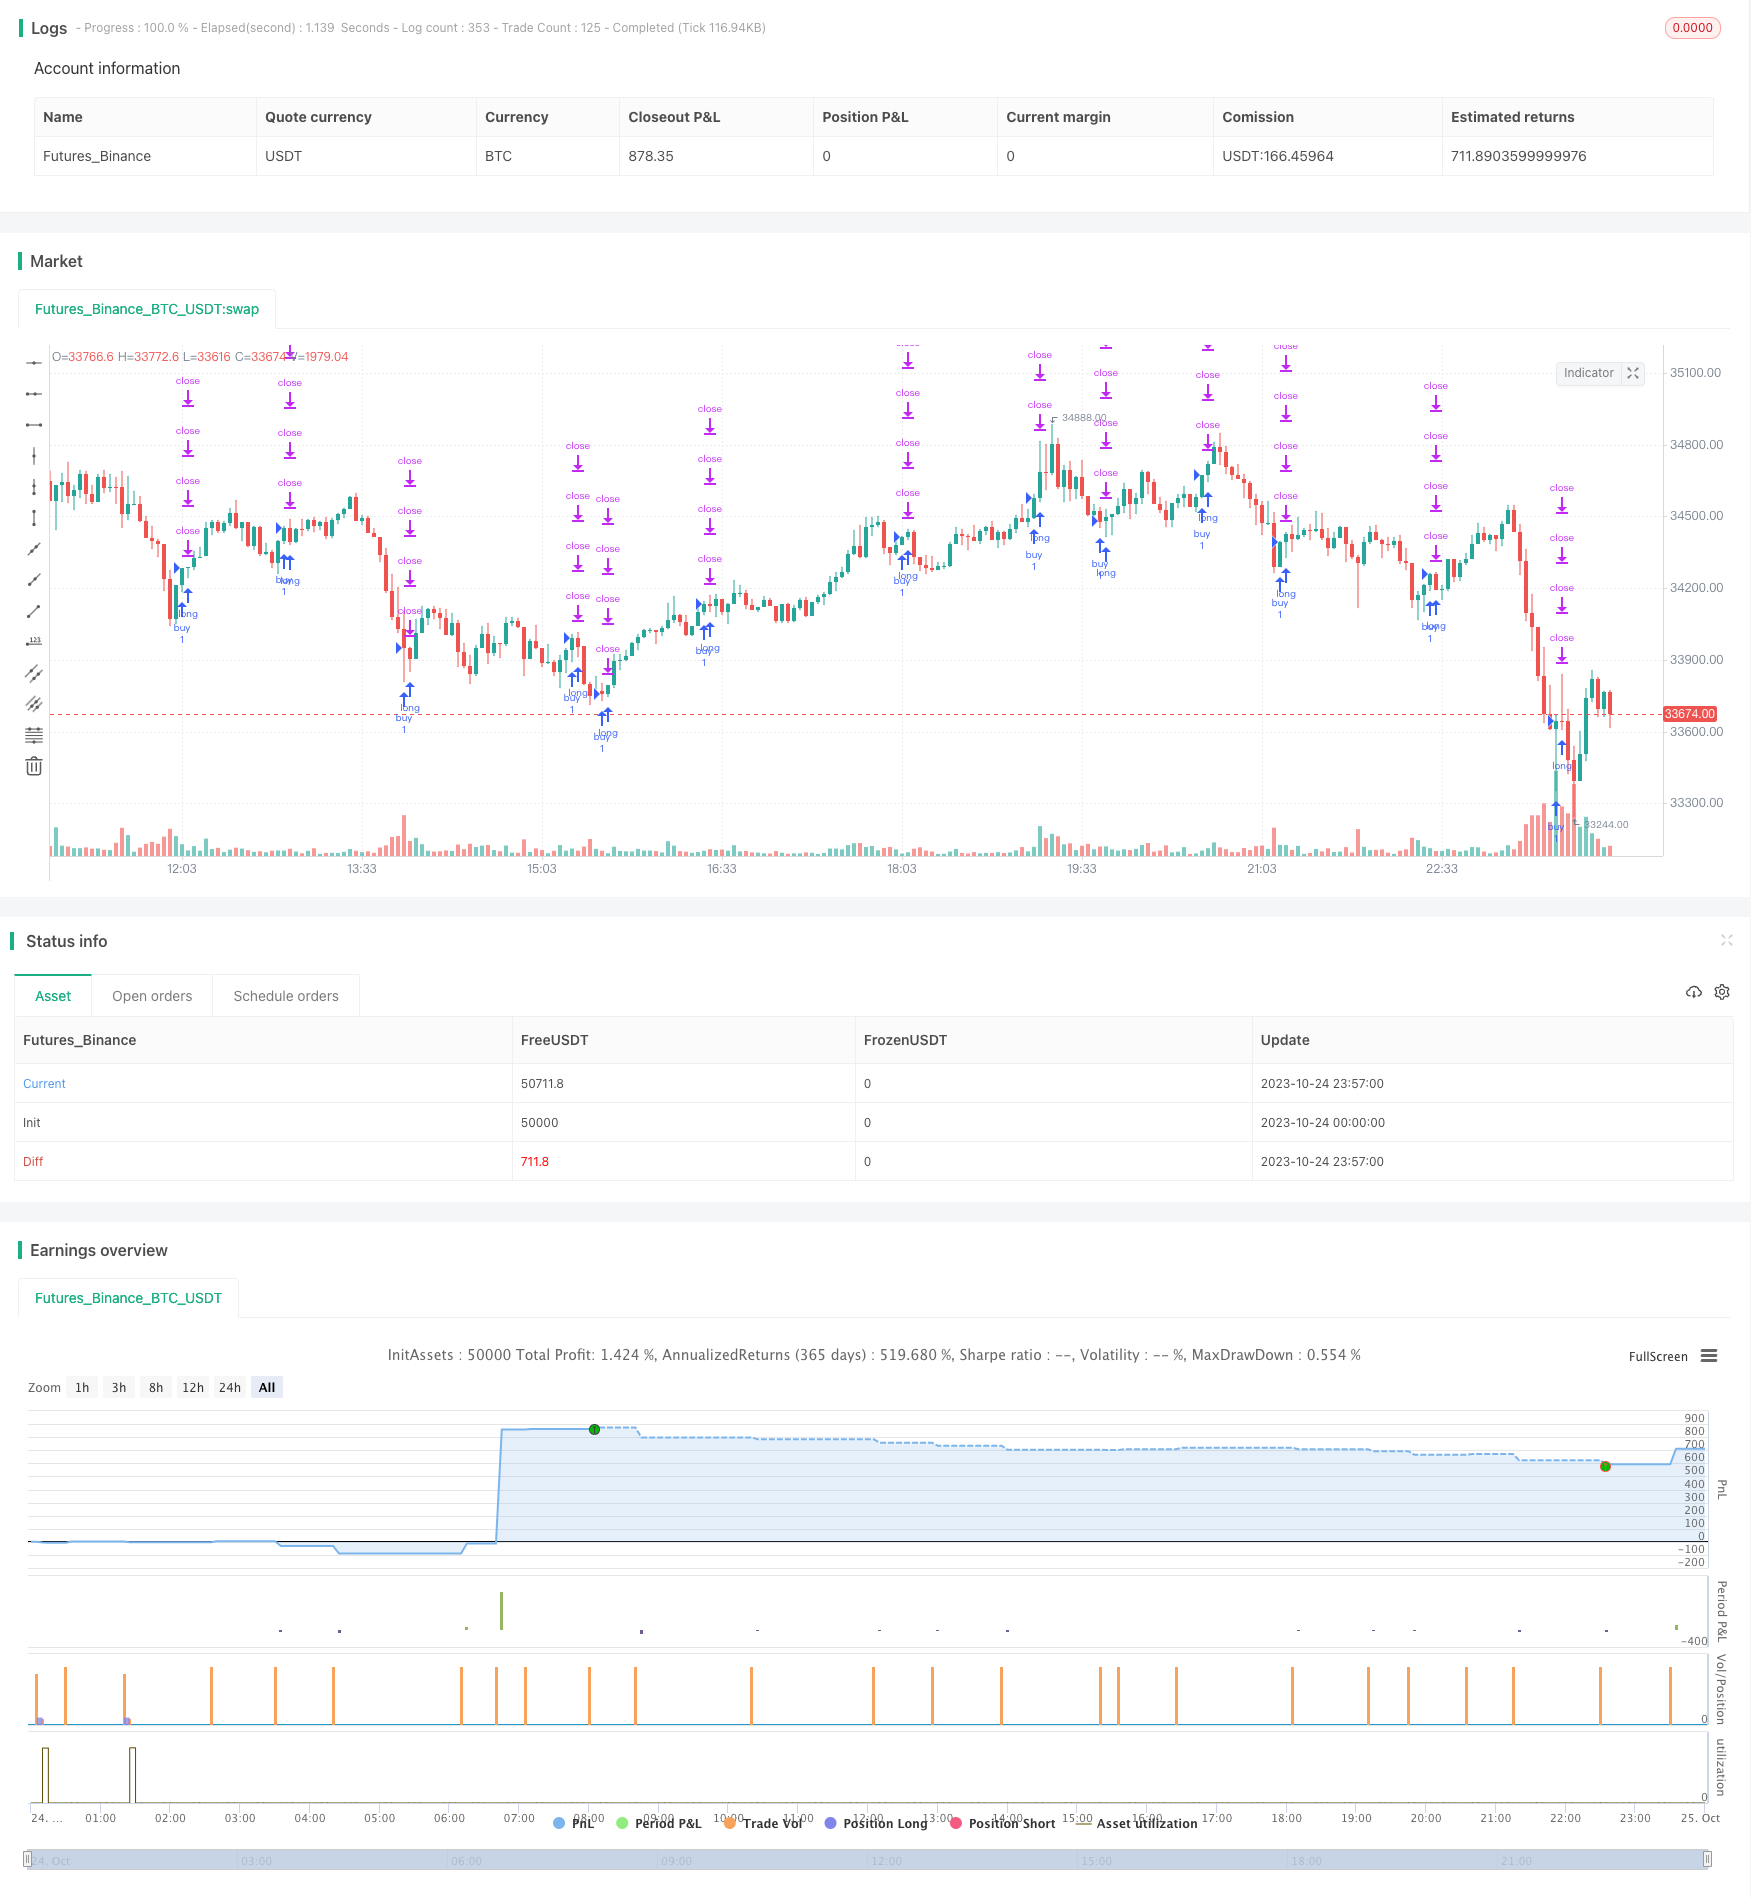
Overview
The Low Scanner Smart Tracking Method is a non-repainting Forex trading strategy. It uses a low scanner to locate low points and combines with Hull Moving Average for trade signal judgment, which can achieve a high winning rate.
Principle Analysis
Firstly, the strategy uses a low scanner to locate low points. The low scanner calculates the RSI values of price and volume, and compares them with the WMA curve to determine low points when RSI is lower than WMA.
Secondly, the strategy uses Hull Moving Average for trade signal judgment. It calculates two Hull MAs with different periods, and goes long when the shorter period Hull MA crosses over the longer period one, and goes short when it crosses under.
Finally, the strategy combines the low point scan signals and Hull MA signals, and only triggers Hull MA signals when the low scanner gives out low point signals, forming the entry strategy.
In this way, by identifying market low points first and then tracking the trend, it can effectively avoid wrong entry timing and improve the winning rate of the trading system.
Advantage Analysis
The main advantages of the Low Scanner Smart Tracking Method are:
Using the low scanner, it can accurately identify market low points and avoid buying at high points.
Hull MA is an excellent trend tracking indicator that can capture larger trends.
Combining low scanner and Hull MA verifies each other and filters out lots of noise and false signals.
Adopting a progressive stop loss exit mechanism can maximize profits and avoid pullbacks.
The strategy uses indicator driven logic and does not manipulate historical data, which is reliable.
Risk Analysis
The main risks of this strategy are:
The low scanner may miss some low points and lose trading opportunities. Parameters can be adjusted to expand the scanning range.
Markets may reverse sharply, causing stop loss to be hit. Stop loss range can be relaxed reasonably and control position sizing.
Improper parameter settings may generate too many or too few trading signals. Parameters should be repeatedly optimized to find the best combination.
This strategy only applies to Forex pairs with obvious trends, not suitable for range-bound or oscillating markets.
Optimization Directions
The strategy can be optimized in the following aspects:
Optimize the parameters of the low scanner to identify low points more accurately.
Optimize the parameters of Hull MA to track trends more precisely.
Add other indicator filters like MACD, KDJ to improve signal reliability.
Add machine learning model predictions to assist trade signal judgment.
Optimize the stop loss mechanism to adjust dynamically based on market volatility.
Optimize the position sizing strategy to adjust position size dynamically based on money management rules.
Conclusion
The Low Scanner Smart Tracking Method is a high winning rate non-repainting Forex trading strategy. It can accurately identify market low points and enter the trend when the trend is clear, locking in profits with progressive stop loss. The strategy has large room for optimization and can be improved in many ways to become a powerful automated trading system.
Parameters
| Name | Default | What it controls |
|---|---|---|
| v_input_1 | 0 | Strategy Direction: long | short | all |
| v_input_2 | 1440 | min |
| v_input_3 | W | tf3 |
| v_input_4 | 60 | min1 |
| v_input_5 | 0 | Timeframe: W | 5 | 15 | 30 | 60 | 120 | 240 | 360 | 720 | D | 1 |
| v_input_6 | 24 | Period |
| v_input_7 | true | Shift |
| v_input_8 | 25 | len |
| v_input_9 | 2016 | BACKTEST START YEAR |
| v_input_10 | 6 | BACKTEST START MONTH |
| v_input_11 | true | BACKTEST START DAY |
| v_input_12 | 2222 | BACKTEST STOP YEAR |
| v_input_13 | 12 | BACKTEST STOP MONTH |
| v_input_14 | 31 | BACKTEST STOP DAY |
| v_input_15 | 25 | stop loss |
| v_input_16 | 25 | qty_percent1 |
| v_input_17 | 25 | qty_percent2 |
| v_input_18 | 25 | qty_percent3 |
| v_input_19 | 0.5 | Take profit1 |
| v_input_20 | true | Take profit2 |
| v_input_21 | 1.5 | Take profit3 |
| v_input_22 | 2 | Take profit4 |
Source Pine Script
/*backtest
start: 2023-10-24 00:00:00
end: 2023-10-25 00:00:00
period: 3m
basePeriod: 1m
exchanges: [{"eid":"Futures_Binance","currency":"BTC_USDT"}]
*/

// © theCrypster 2020

//@version=4
// strategy(title = "Low Scanner Forex strategy", overlay = false, pyramiding=1,initial_capital = 1000, default_qty_type= strategy.percent_of_equity, default_qty_value = 100, calc_on_order_fills=false, slippage=0,commission_type=strategy.commission.percent,commission_value=0)
strat_dir_input = input(title="Strategy Direction", defval="long", options=["long", "short", "all"])
strat_dir_value = strat_dir_input == "long" ? strategy.direction.long : strat_dir_input == "short" ? strategy.direction.short : strategy.direction.all
strategy.risk.allow_entry_in(strat_dir_value)
leng=1
p1=close[1]
min=input(1440)
len55 = timeframe.isintraday and timeframe.multiplier >= 1 ?
   min / timeframe.multiplier * 7 :
   timeframe.isintraday and timeframe.multiplier < 60 ?
   60 / timeframe.multiplier * 24 * 7 : 7
//taken from https://www.tradingview.com/script/Ql1FjjfX-security-free-MTF-example-JD/
tf3 = input("W", type=input.resolution)
ti = change( time(tf3) ) != 0
T_c = fixnan( ti ? close : na )

vrsi = rsi(cum(change(T_c) * volume), leng)
pp=wma(vrsi,len55)

d=(vrsi[1]-pp[1])
min1 =input(60)
len100 = timeframe.isintraday and timeframe.multiplier >= 1 ?
   min1 / timeframe.multiplier * 7 :
   timeframe.isintraday and timeframe.multiplier < 60 ?
   60 / timeframe.multiplier * 24 * 7 : 7
x=ema(d,len100)
//
zx=x/-1
col=zx > 0? color.lime : color.orange
plot(zx,color=col,linewidth=1)
//

tf10 = input("W", title = "Timeframe", type = input.resolution, options = ["1", "5", "15", "30", "60","120", "240","360","720", "D", "W"])

length = input(24, title = "Period", type = input.integer)
shift = input(1, title = "Shift", type = input.integer)

hma(_src, _length)=>
    wma((2 * wma(_src, _length / 2)) - wma(_src, _length), round(sqrt(_length)))

hma3(_src, _length)=>
    p = length/2
    wma(wma(close,p/3)*3 - wma(close,p/2) - wma(close,p),p)


a = security(syminfo.tickerid, tf10, hma(close, length))
b =security(syminfo.tickerid, tf10, hma3(close[1], length)[shift])
//plot(a,color=color.gray)
//plot(b,color=color.yellow)
close_price = close[0]
len = input(25)

linear_reg = linreg(close_price, len, 0)


//plot(linear_reg, color=color.blue, title="LR", linewidth=3)

buy=crossover(linear_reg, b)
sell=crossunder(linear_reg, b)
//
// Time period input
testStartYear = input(2016, "BACKTEST START YEAR", minval = 1980, maxval = 2222)
testStartMonth = input(06, "BACKTEST START MONTH", minval = 1, maxval = 12)
testStartDay = input(01, "BACKTEST START DAY", minval = 1, maxval = 31)
testPeriodStart = timestamp(testStartYear,testStartMonth,testStartDay,0,0)
testStopYear = input(2222, "BACKTEST STOP YEAR", minval=1980, maxval = 2222)
testStopMonth = input(12, "BACKTEST STOP MONTH", minval=1, maxval=12)
testStopDay = input(31, "BACKTEST STOP DAY", minval=1, maxval=31)
testPeriodStop = timestamp(testStopYear, testStopMonth, testStopDay, 0, 0)
testPeriod = time >= testPeriodStart and time <= testPeriodStop ? true : false
l = crossover(zx,0) or buy

if l and testPeriod
    strategy.entry("buy", strategy.long)

per(pcnt) =>
    strategy.position_size != 0 ? round(pcnt / 100 * strategy.position_avg_price / syminfo.mintick) : float(na)
stoploss=input(title=" stop loss", defval=25, minval=0.01)
los = per(stoploss)
q1=input(title=" qty_percent1", defval=25, minval=1)
q2=input(title=" qty_percent2", defval=25, minval=1)
q3=input(title=" qty_percent3", defval=25, minval=1)
tp1=input(title=" Take profit1", defval=0.5, minval=0.01)
tp2=input(title=" Take profit2", defval=1, minval=0.01)
tp3=input(title=" Take profit3", defval=1.5, minval=0.01)
tp4=input(title=" Take profit4", defval=2, minval=0.01)
strategy.exit("x1", qty_percent = q1, profit = per(tp1), loss = los)
strategy.exit("x2", qty_percent = q2, profit = per(tp2), loss = los)
strategy.exit("x3", qty_percent = q3, profit = per(tp3), loss = los)
strategy.exit("x4", profit = per(tp4), loss = los)
Published by ChaoZhang on the FMZ strategy square · last modified 2023-11-01. Collected in the Quant Trading Vault. Unvalidated research: re-test with your own data and costs before trusting it.
Build this with AgenKit
A spec is not a trading system. Paste this into your coding agent and AgenKit runs a specialist team — architecture, test-first build, risk gates, review — with paper trading on by default.
/agenkit build a production-grade trading bot with a backtest engine, risk controls and paper trading by default from strategies/Low-Scanner-Smart-Tracking-Method.md- npx agenkit install engineering-kit in your project
- Paste the command into your agent and approve each phase
- Get tests, backtest, risk controls and a paper-trading switch
Understand it first
Before you run this, read the lesson behind the idea and how to backtest it honestly. Specs like this one are the survivors of an unknown number of trials; deflate their results accordingly.
Related specs
- Adaptive ATR and RSI Trend Following Strategy with Trailing Stop LossPine Script · Trend following · 1h
- Advanced Multi Indicator Multi Dimensional Trend Cross Quantitative StrategyPine Script · Trend following · 3h
- Bollinger Bands and RSI Trend Following StrategyPine Script · Trend following · 1h
- Dual ATR Channel Trend Following StrategyPine Script · Trend following · 15m
- Dynamic Dual EMA Crossover Strategy with Adaptive Profit Loss ControlPine Script · Trend following · 1d
- EMA SMA Multi Indicator Comprehensive Trend Following StrategyPine Script · Trend following · 1h