Strategy vault / Trend following
Multi Moving Average Crossover Trend Following Strategy
This strategy is a trend-following trading system based on the Tillson T3 indicator. It uses multiple exponential moving average (EMA) crossovers to generate buy and sell signals, and is backtested on the TradingView…
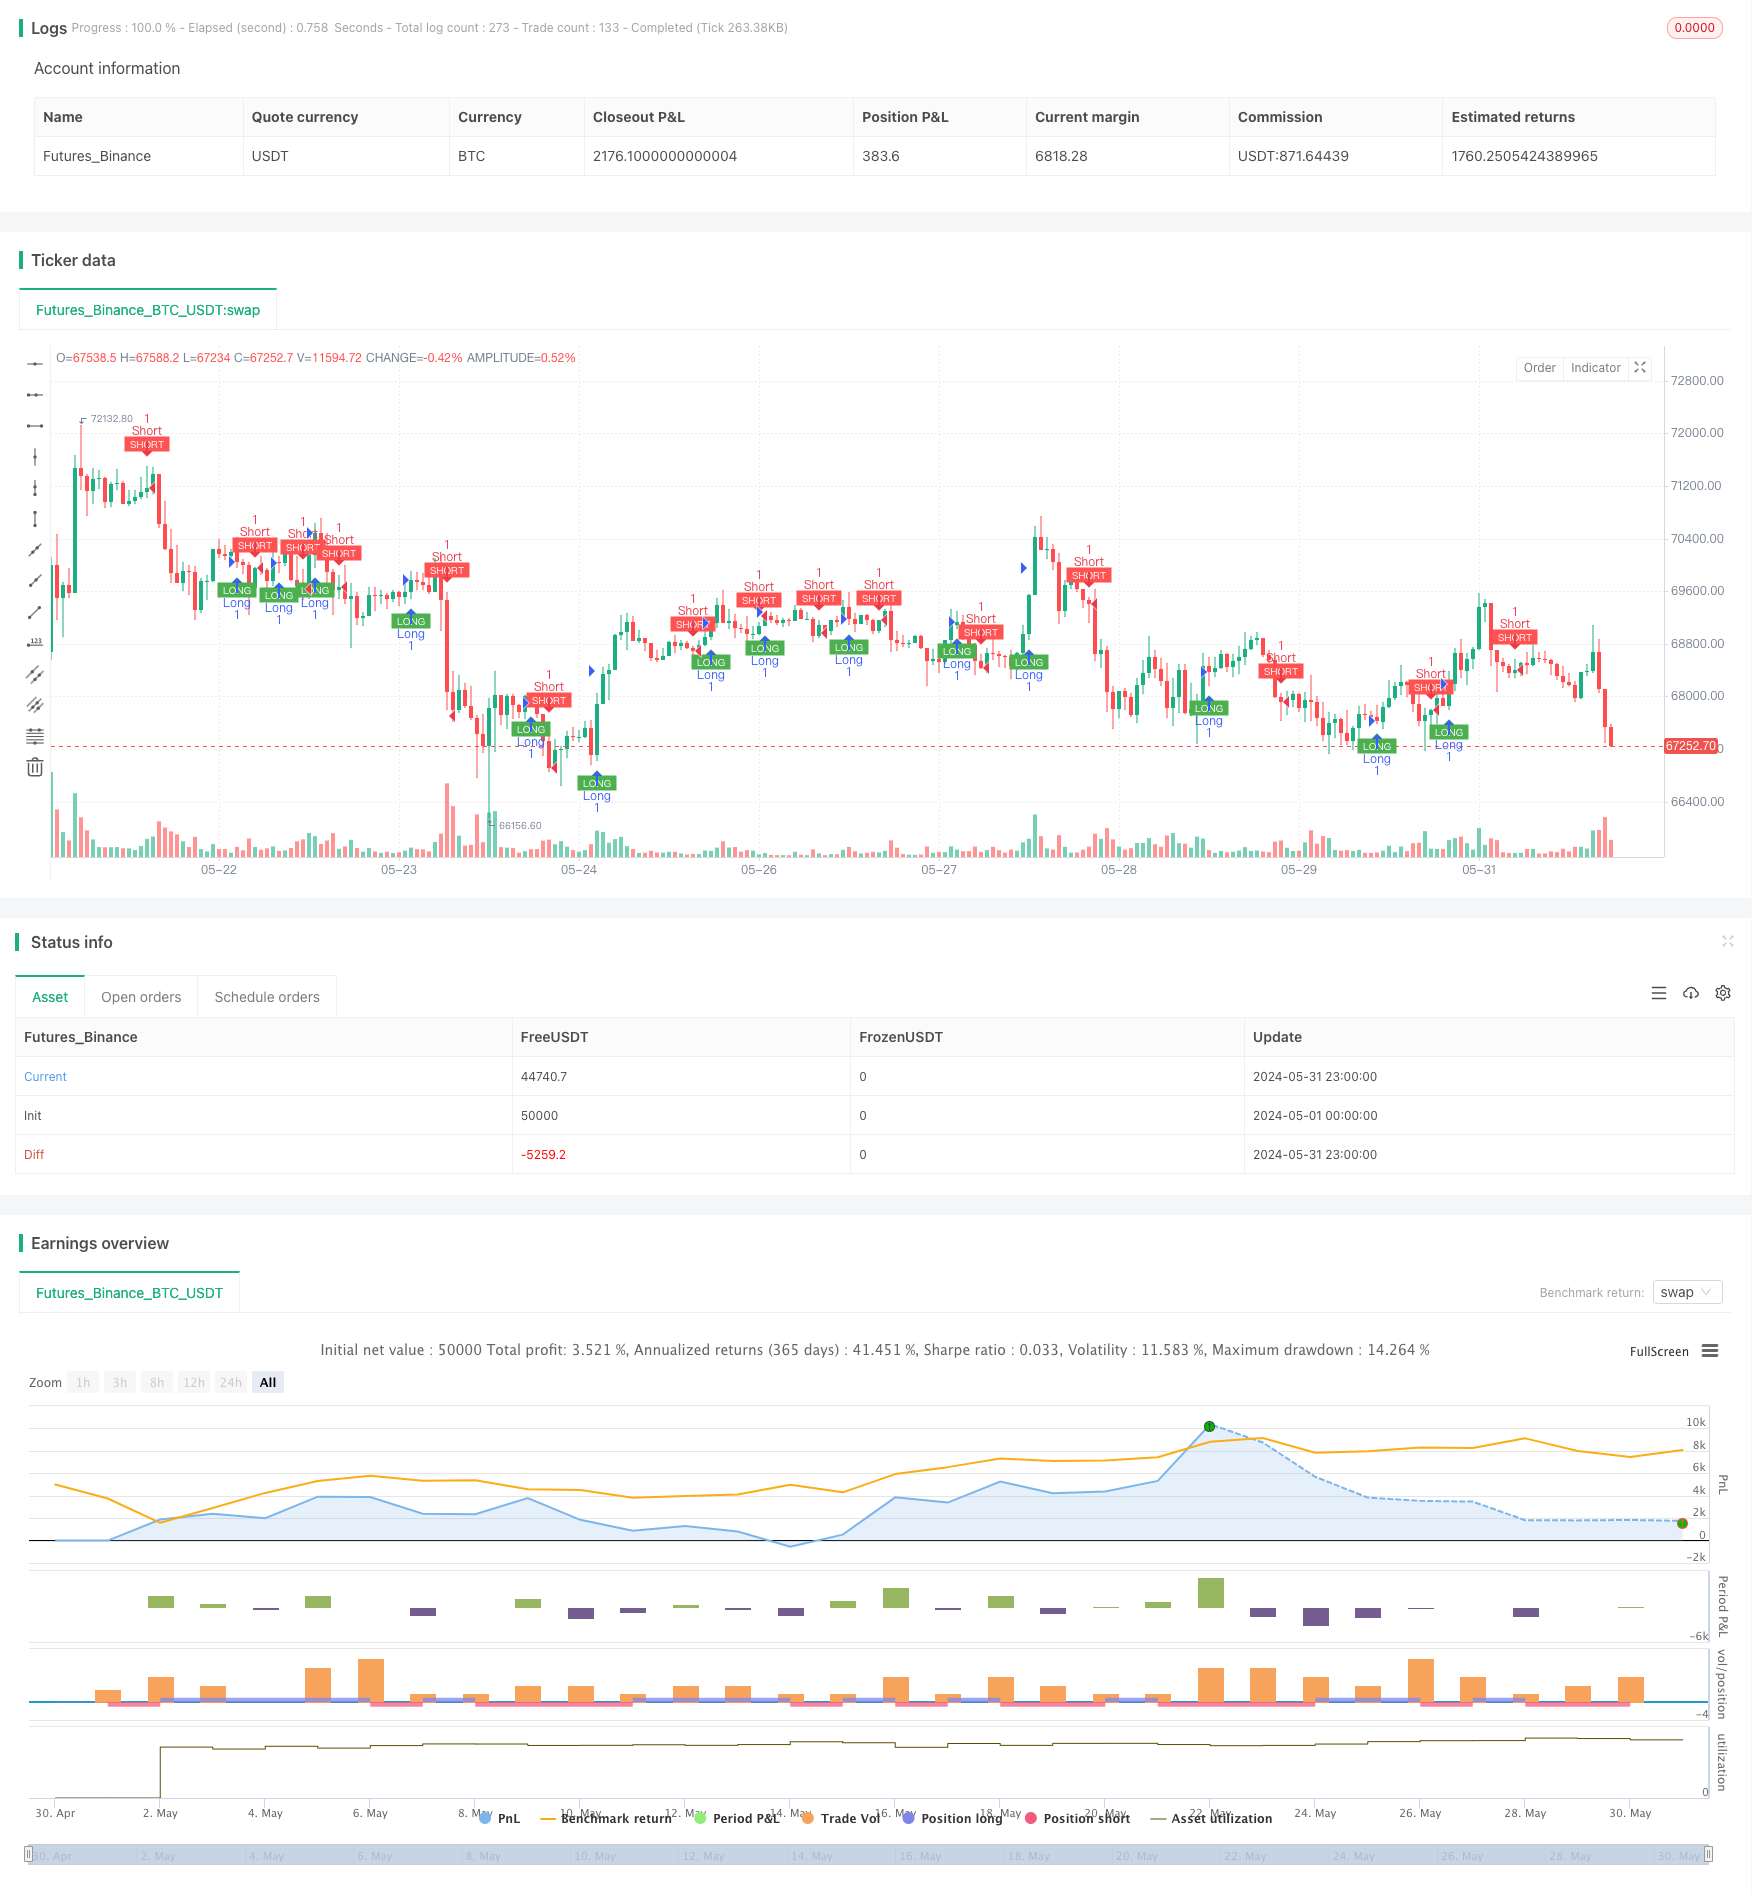
Overview
This strategy is a trend-following trading system based on the Tillson T3 indicator. It uses multiple exponential moving average (EMA) crossovers to generate buy and sell signals, and is backtested on the TradingView platform. The core idea of the strategy is to capture market trends through the Tillson T3 indicator, opening long positions in uptrends and short positions in downtrends to achieve profits.
Strategy Principles
Tillson T3 Indicator Calculation:
- First, calculate the EMA of (High + Low + 2 * Close) / 4
- Then calculate EMA 5 consecutive times to get e1 to e6
- Finally, calculate T3 value based on specific coefficients
Signal Generation:
- Long signal: When T3 value crosses above its previous value
- Short signal: When T3 value crosses below its previous value
Trade Execution:
- Open a long position when a long signal appears
- Open a short position when a short signal appears
Visualization:
- Long signal: Green up arrow below the chart
- Short signal: Red down arrow above the chart
Strategy Advantages
Trend Following: The Tillson T3 indicator effectively captures market trends, reducing false breakouts.
Flexibility: Can adapt to different market environments by adjusting length and volume factor.
Visual Feedback: Clear graphical signals aid in trading decisions.
Automation: Can be implemented for automated trading on the TradingView platform.
Risk Management: Uses percentage of equity for position sizing.
Strategy Risks
Trend Reversal: May produce frequent false signals in choppy markets.
Lag: As a lagging indicator, may miss opportunities at the beginning of trends.
Overtrading: Frequent signals may lead to overtrading, increasing costs.
Parameter Sensitivity: Performance highly depends on parameter settings.
Single Indicator: Relying solely on Tillson T3 may overlook other important market information.
Strategy Optimization Directions
Multi-Indicator Combination: Introduce indicators like RSI, MACD for signal confirmation.
Stop Loss Optimization: Add dynamic stop loss, such as trailing stops, to improve risk management.
Timeframe Analysis: Combine multiple timeframe analysis to improve signal reliability.
Volatility Adjustment: Adjust position size based on market volatility to optimize risk-reward ratio.
Market State Recognition: Add market state judgment logic to adopt different strategies in different market environments.
Conclusion
The Multi-Moving Average Crossover Trend Following Strategy is an automated trading system based on the Tillson T3 indicator. It generates trading signals by capturing market trends, with strong trend-following capabilities and clear operational simplicity as its advantages. However, the strategy also faces risks such as frequent false signals in choppy markets and signal lag. By combining multiple indicators, optimizing stop-loss strategies, introducing multi-timeframe analysis, and other methods, the stability and profitability of the strategy can be further improved. Overall, this is a strategy framework with a good foundation, which through continuous optimization and live testing, has the potential to become a reliable automated trading system.
Source Pine Script
/*backtest
start: 2024-05-01 00:00:00
end: 2024-05-31 23:59:59
period: 1h
basePeriod: 15m
exchanges: [{"eid":"Futures_Binance","currency":"BTC_USDT"}]
*/

//@version=4
strategy("Hashtag Signals and Backtest", overlay=true)

// Input parameters for indicators
length1 = input(8, "T3 Length")
a1 = input(0.7, "Volume Factor")

// Tillson T3 Calculation
e1 = ema((high + low + 2 * close) / 4, length1)
e2 = ema(e1, length1)
e3 = ema(e2, length1)
e4 = ema(e3, length1)
e5 = ema(e4, length1)
e6 = ema(e5, length1)
c1 = -a1 * a1 * a1
c2 = 3 * a1 * a1 + 3 * a1 * a1 * a1
c3 = -6 * a1 * a1 - 3 * a1 - 3 * a1 * a1 * a1
c4 = 1 + 3 * a1 + a1 * a1 * a1 + 3 * a1 * a1
T3 = c1 * e6 + c2 * e5 + c3 * e4 + c4 * e3

// Signal conditions
longSignal = crossover(T3, T3[1])
shortSignal = crossunder(T3, T3[1])

// Plotting signals
plotshape(series=longSignal, title="Long Signal", location=location.belowbar, color=color.green, style=shape.labelup, text="LONG", textcolor=color.white, size=size.tiny)
plotshape(series=shortSignal, title="Short Signal", location=location.abovebar, color=color.red, style=shape.labeldown, text="SHORT", textcolor=color.white, size=size.tiny)

// Strategy Entries for Backtest
if (longSignal)
    strategy.entry("Long", strategy.long)

if (shortSignal)
    strategy.entry("Short", strategy.short)

// Alerts
alertcondition(longSignal, title="BUY", message="BUY!")
alertcondition(shortSignal, title="SELL", message="SELL!")
Published by ChaoZhang on the FMZ strategy square · last modified 2024-06-28. Collected in the Quant Trading Vault. Unvalidated research: re-test with your own data and costs before trusting it.
Build this with AgenKit
A spec is not a trading system. Paste this into your coding agent and AgenKit runs a specialist team — architecture, test-first build, risk gates, review — with paper trading on by default.
/agenkit build a production-grade trading bot with a backtest engine, risk controls and paper trading by default from strategies/Multi-Moving-Average-Crossover-Trend-Following-Strategy.md- npx agenkit install engineering-kit in your project
- Paste the command into your agent and approve each phase
- Get tests, backtest, risk controls and a paper-trading switch
Understand it first
Before you run this, read the lesson behind the idea and how to backtest it honestly. Specs like this one are the survivors of an unknown number of trials; deflate their results accordingly.
Related specs
- Adaptive ATR and RSI Trend Following Strategy with Trailing Stop LossPine Script · Trend following · 1h
- Advanced Multi Indicator Multi Dimensional Trend Cross Quantitative StrategyPine Script · Trend following · 3h
- Bollinger Bands and RSI Trend Following StrategyPine Script · Trend following · 1h
- Dual ATR Channel Trend Following StrategyPine Script · Trend following · 15m
- Dynamic Dual EMA Crossover Strategy with Adaptive Profit Loss ControlPine Script · Trend following · 1d
- EMA SMA Multi Indicator Comprehensive Trend Following StrategyPine Script · Trend following · 1h