Strategy vault / Trend following
Trend Following Trading Strategy Based on T3 Indicator
This strategy designs a trend following trading system based on the T3 moving average indicator. It can automatically identify the direction of price trends and take corresponding long or short positions. It goes…
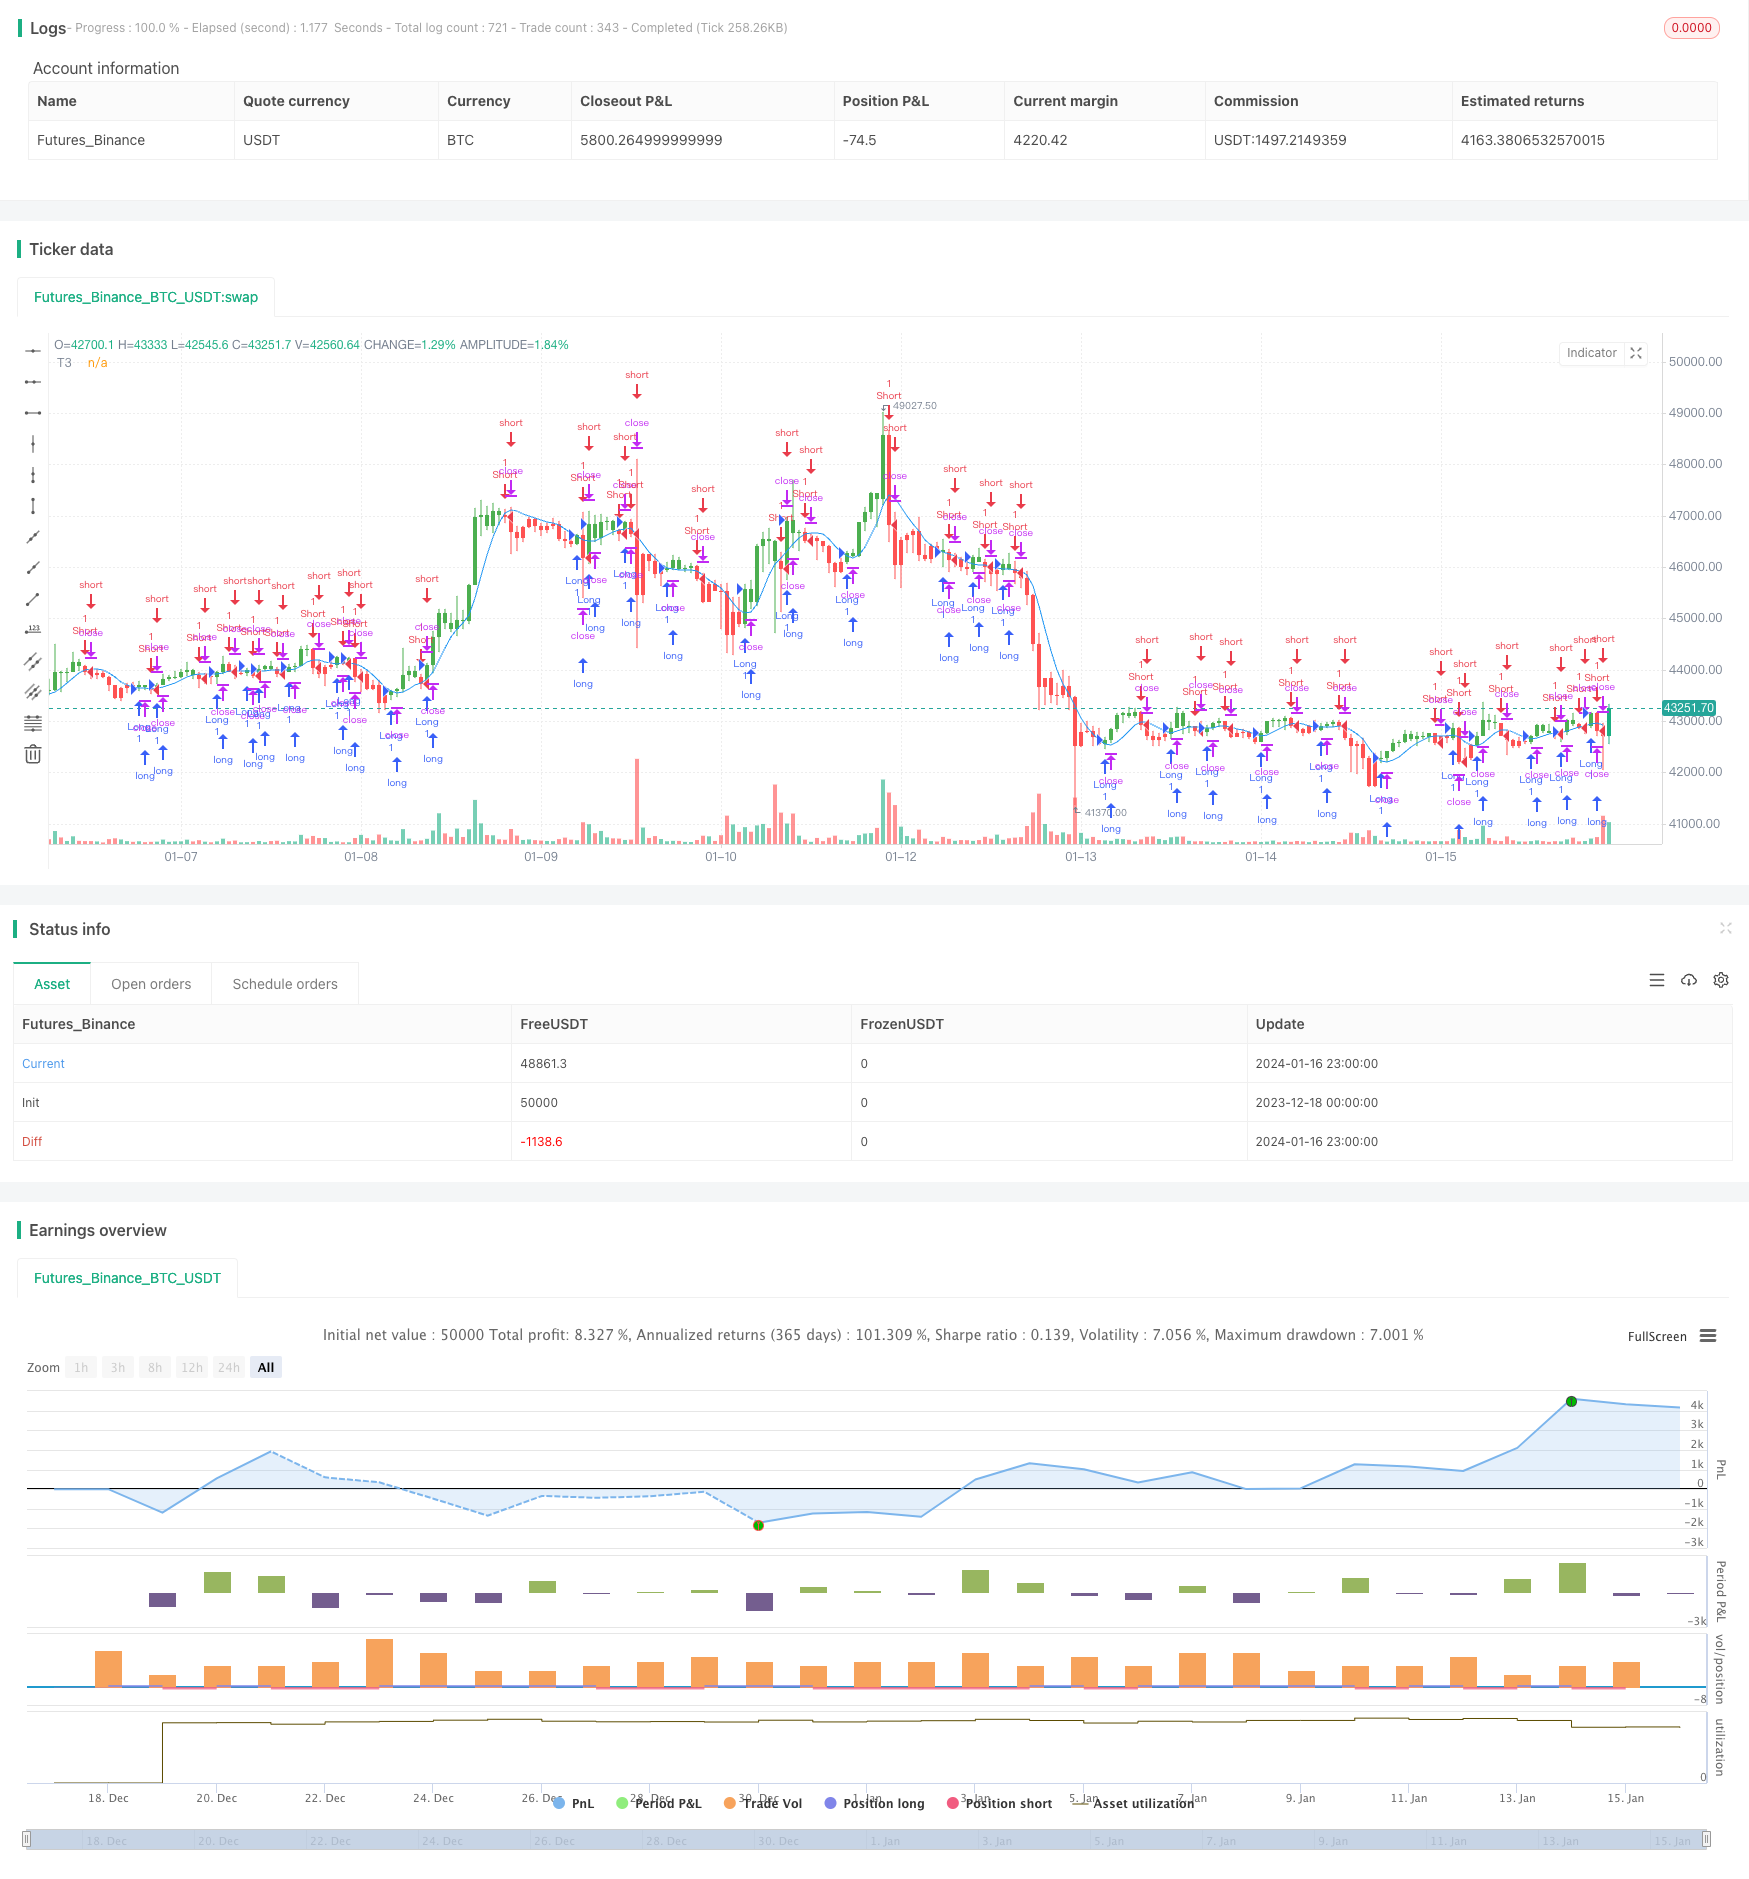
Strategy Overview
This strategy designs a trend following trading system based on the T3 moving average indicator. It can automatically identify the direction of price trends and take corresponding long or short positions. It goes long when prices rise and goes short when prices fall. The system also has the function of reversal trading.
Strategy Logic
The strategy uses the T3 indicator to determine the direction of the price trend. The T3 indicator is an adaptive moving average with higher sensitivity that can respond to price changes faster. Its calculation formula is:
T3(n) = GD(GD(GD(n)))
Where GD represents the generalized DEMA (double exponential moving average), which is calculated as:
GD(n,v) = EMA(n) * (1+v)-EMA(EMA(n)) * v
v is the volume factor, which determines the sensitivity of the moving average's response to linear price trends. When v=0, GD=EMA; when v=1, GD=DEMA. The author suggests setting v=0.7.
The strategy compares the T3 indicator with the price. When T3 crosses above the price, it determines an upward price trend and goes long. When T3 crosses below the price, it determines a downward price trend and goes short.
Advantages
- Uses adaptive moving average T3 indicator, sensitive to price trend changes
- Automatically determines price trend direction, no manual judgment needed
- Configurable reversal trading, flexible to cope with market changes
Risks
- T3 indicator may have difficulty determining trend direction during range-bound consolidation
- Adaptive moving average indicators tend to produce false signals
- Risk control for reversal trading needs to be cautious
This can be mitigated by adjusting T3 parameters or adding other indicators for filtration, as well as setting stop loss to control single loss.
Optimization Directions
- Add other indicators for filtration, such as MACD, RSI etc for combination
- Add trend judgment rules to avoid false operations during sideways markets
- Optimize parameters, adjust v value for better parameter combination
- Add stop loss logic
Summary
The strategy automatically determines the price trend direction through the T3 indicator, without the need for manual judgment, and can automatically go long or short. It can also be configured for reversal trading to cope with more complex market situations. There is room for optimizing parameters, trading logic etc. to make the strategy perform even better.
Parameters
| Name | Default | What it controls |
|---|---|---|
| v_input_1 | 5 | Length |
| v_input_2 | 0.7 | b |
| v_input_3 | false | Trade reverse |
Source Pine Script
/*backtest
start: 2023-12-18 00:00:00
end: 2024-01-17 00:00:00
period: 1h
basePeriod: 15m
exchanges: [{"eid":"Futures_Binance","currency":"BTC_USDT"}]
*/

//@version=2
////////////////////////////////////////////////////////////
//  Copyright by HPotter v1.00 29/11/2017
// This indicator plots the moving average described in the January, 1998 issue
// of S&C, p.57, "Smoothing Techniques for More Accurate Signals", by Tim Tillson.
// This indicator plots T3 moving average presented in Figure 4 in the article.
// T3 indicator is a moving average which is calculated according to formula:
//     T3(n) = GD(GD(GD(n))),
// where GD - generalized DEMA (Double EMA) and calculating according to this:
//     GD(n,v) = EMA(n) * (1+v)-EMA(EMA(n)) * v,
// where "v" is volume factor, which determines how hot the moving average's response
// to linear trends will be. The author advises to use v=0.7.
// When v = 0, GD = EMA, and when v = 1, GD = DEMA. In between, GD is a less aggressive
// version of DEMA. By using a value for v less than1, trader cure the multiple DEMA
// overshoot problem but at the cost of accepting some additional phase delay.
// In filter theory terminology, T3 is a six-pole nonlinear Kalman filter. Kalman
// filters are ones that use the error - in this case, (time series - EMA(n)) -
// to correct themselves. In the realm of technical analysis, these are called adaptive
// moving averages; they track the time series more aggres-sively when it is making large
// moves. Tim Tillson is a software project manager at Hewlett-Packard, with degrees in
// mathematics and computer science. He has privately traded options and equities for 15 years.
//
// You can change long to short in the Input Settings
// WARNING:
// - For purpose educate only
// - This script to change bars colors.
////////////////////////////////////////////////////////////
strategy(title="T3 Averages", shorttitle="T3", overlay = true)
Length = input(5, minval=1)
b = input(0.7, minval=0.01,step=0.01)
reverse = input(false, title="Trade reverse")
xPrice = close
xe1 = ema(xPrice, Length)
xe2 = ema(xe1, Length)
xe3 = ema(xe2, Length)
xe4 = ema(xe3, Length)
xe5 = ema(xe4, Length)
xe6 = ema(xe5, Length)
c1 = -b*b*b
c2 = 3*b*b+3*b*b*b
c3 = -6*b*b-3*b-3*b*b*b
c4 = 1+3*b+b*b*b+3*b*b
nT3Average = c1 * xe6 + c2 * xe5 + c3 * xe4 + c4 * xe3
pos = iff(nT3Average > close, -1,
       iff(nT3Average < close, 1, nz(pos[1], 0)))
possig = iff(reverse and pos == 1, -1,
          iff(reverse and pos == -1, 1, pos))
if (possig == 1)
    strategy.entry("Long", strategy.long)
if (possig == -1)
    strategy.entry("Short", strategy.short)
barcolor(possig == -1 ? red: possig == 1 ? green : blue )
plot(nT3Average, color=blue, title="T3")Published by ChaoZhang on the FMZ strategy square · last modified 2024-01-18. Collected in the Quant Trading Vault. Unvalidated research: re-test with your own data and costs before trusting it.
Build this with AgenKit
A spec is not a trading system. Paste this into your coding agent and AgenKit runs a specialist team — architecture, test-first build, risk gates, review — with paper trading on by default.
/agenkit build a production-grade trading bot with a backtest engine, risk controls and paper trading by default from strategies/Trend-Following-Trading-Strategy-Based-on-T3-Indicator.md- npx agenkit install engineering-kit in your project
- Paste the command into your agent and approve each phase
- Get tests, backtest, risk controls and a paper-trading switch
Understand it first
Before you run this, read the lesson behind the idea and how to backtest it honestly. Specs like this one are the survivors of an unknown number of trials; deflate their results accordingly.
Related specs
- Adaptive ATR and RSI Trend Following Strategy with Trailing Stop LossPine Script · Trend following · 1h
- Advanced Multi Indicator Multi Dimensional Trend Cross Quantitative StrategyPine Script · Trend following · 3h
- Bollinger Bands and RSI Trend Following StrategyPine Script · Trend following · 1h
- Dual ATR Channel Trend Following StrategyPine Script · Trend following · 15m
- Dynamic Dual EMA Crossover Strategy with Adaptive Profit Loss ControlPine Script · Trend following · 1d
- EMA SMA Multi Indicator Comprehensive Trend Following StrategyPine Script · Trend following · 1h