Strategy vault / Trend following
Crossover EMA Short term Trading Strategy
This is a short-term trading strategy that utilizes golden cross of moving average lines to generate buy and sell signals. It employs two exponential moving average (EMA) lines with different periods as trading…
Overview
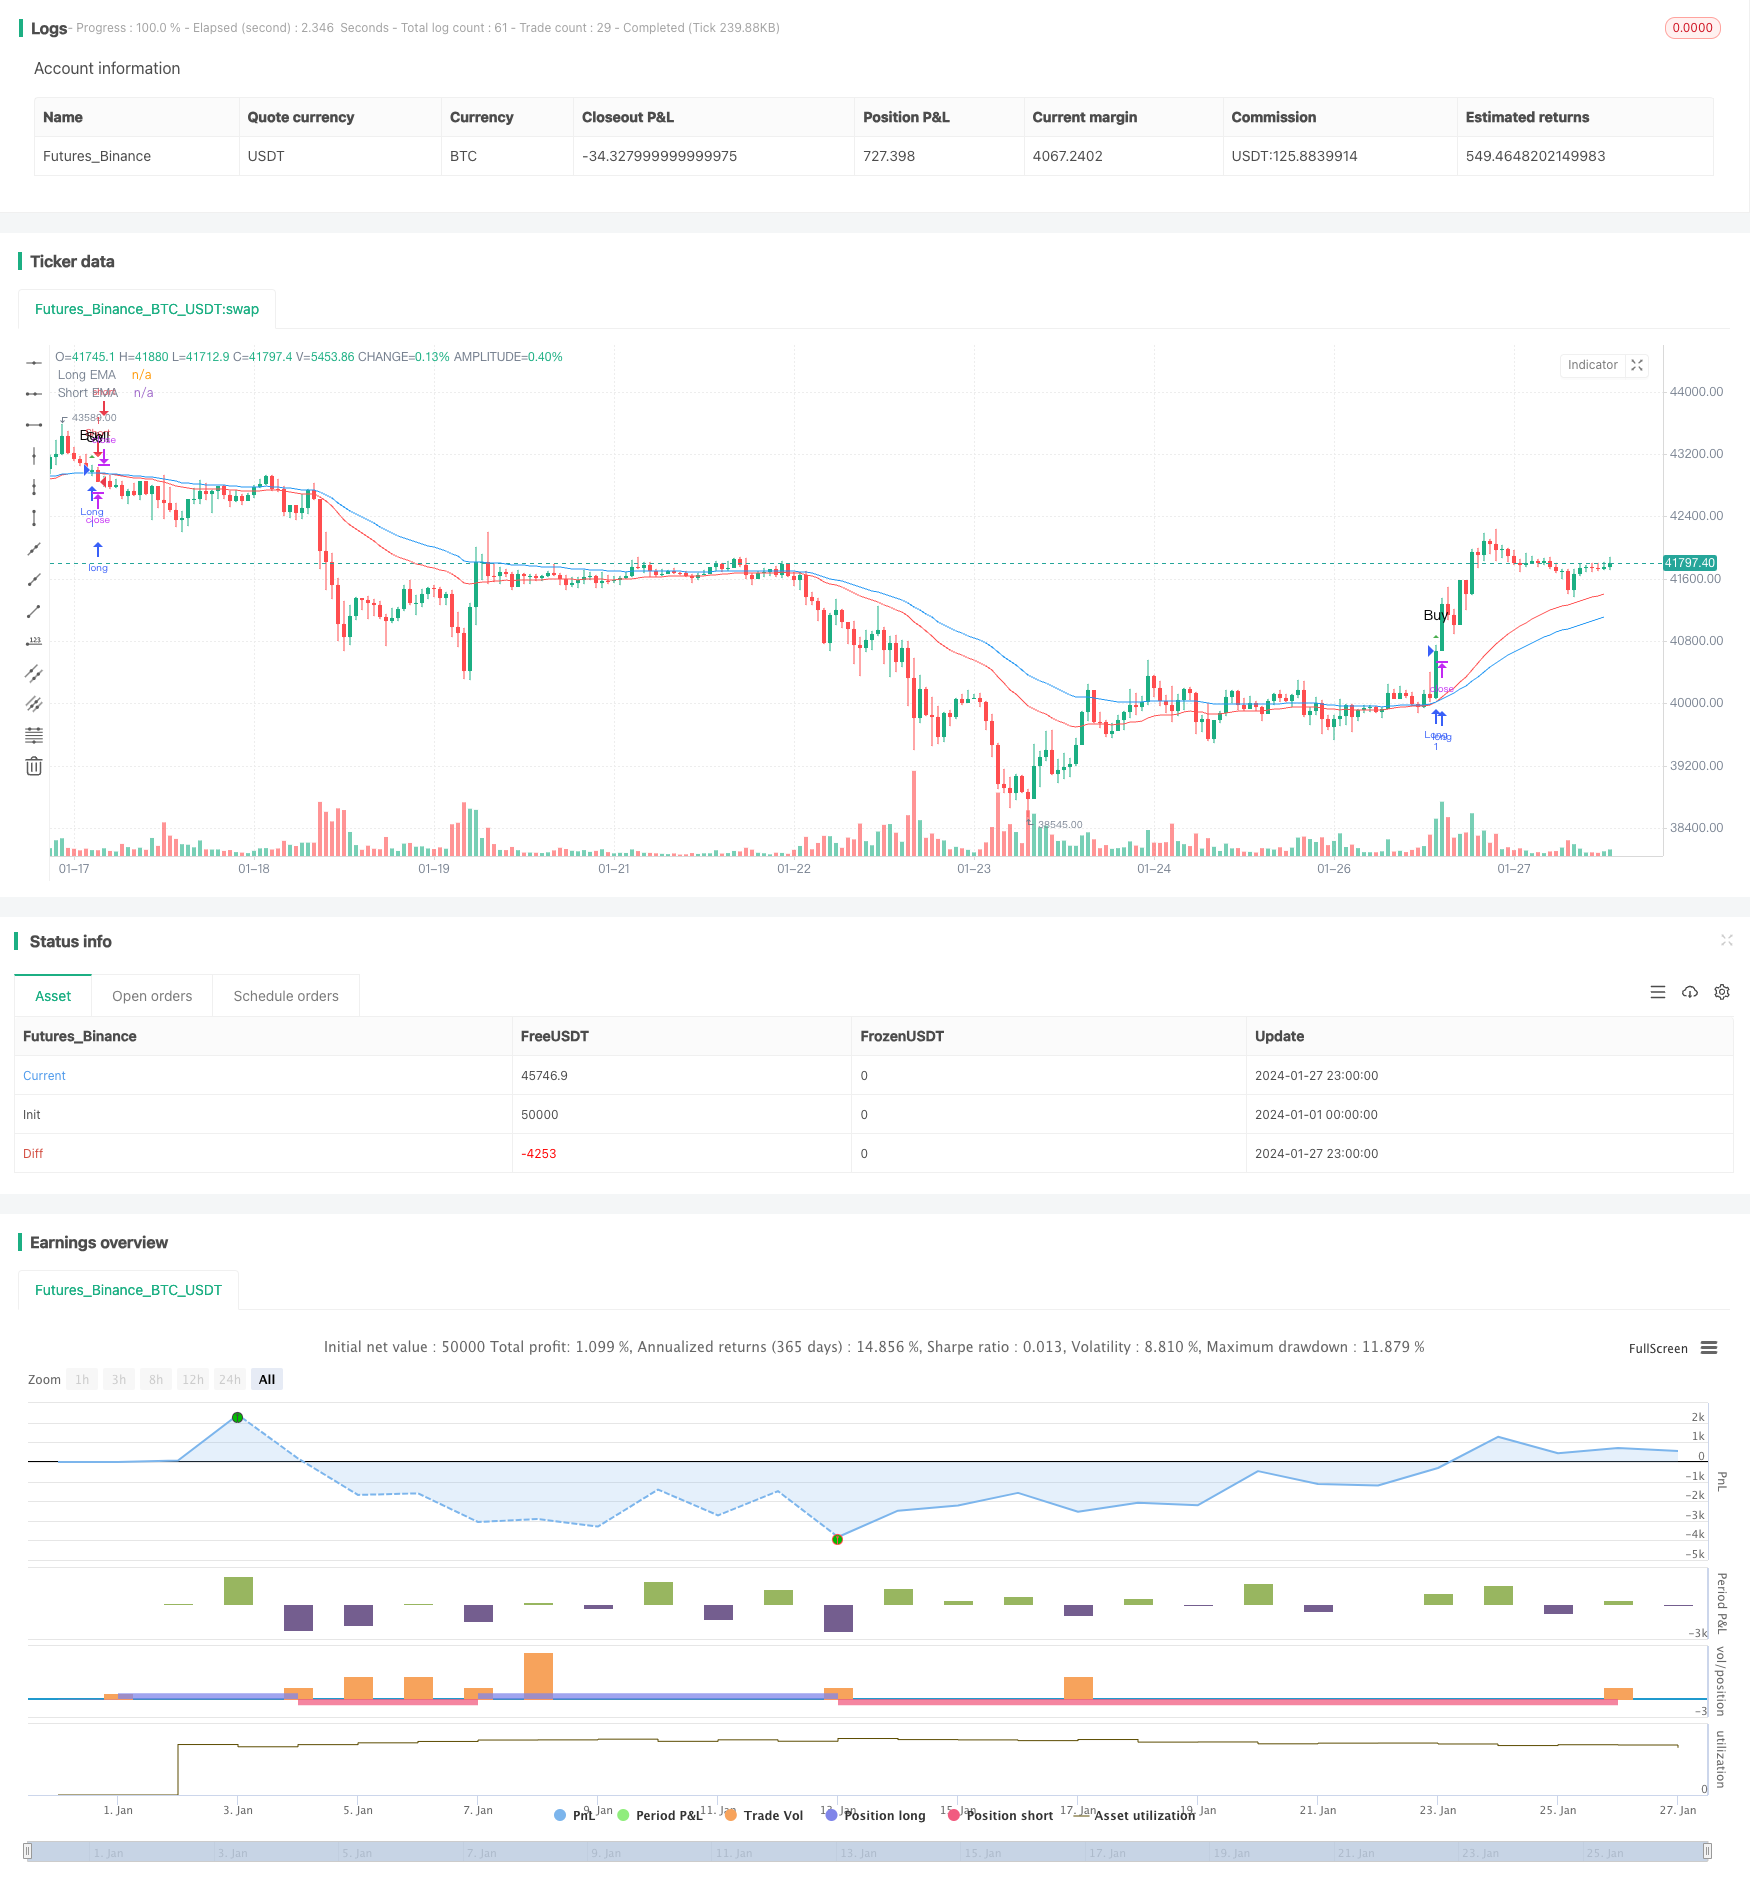
This is a short-term trading strategy that utilizes golden cross of moving average lines to generate buy and sell signals. It employs two exponential moving average (EMA) lines with different periods as trading signals. When the short period EMA line crosses above the long period EMA line, a golden cross is formed and a buy signal is triggered. When the short period EMA crosses below the long period EMA, a death cross occurs and a sell signal is generated.
Strategy Logic
The core logic of this strategy is to compute two EMA lines, one being a 55-period short term EMA, and the other a 34-period long term EMA. When the short term EMA crosses over the long term EMA, it is believed that the price uptrend has occurred, hence a buy signal is triggered. When the short term EMA crosses below the long term EMA, it is regarded as a price downtrend, so a sell signal is generated.
In the code, two EMA parameters are input first, based on which two EMA lines are calculated. When buy or sell signals occur, corresponding markings are plotted accordingly. Meanwhile, both EMA lines are plotted on the candlestick chart for intuitive trend judgment.
Advantages
- Simple to operate, easy to understand, suitable for beginners;
- Sensitive response, short-term operations, quick profits;
- Using EMA can effectively filter abnormal price fluctuations and generate reliable signals;
- Customizable EMA parameters, optimizable strategy;
- Applicable in various products.
Risks and Solutions
- Frequent trading is likely to increase costs and slippage risks. Tuning EMA cycle parameters properly helps filter overly frequent signals.
- Certain time lags exist, possibly missing early opportunities. Other indicators like BOLL can aid in complementing the judgment.
- Improper EMA parameter settings may lead to incorrect trading signals. Adequate backtesting and parameter optimization are necessary.
Optimization
- Incorporate more indicators e.g. BOLL, MACD to establish threshold conditions to avoid false signals.
- Add position sizing module to better control risks.
- Design adaptive EMA tuning mechanism according to different products and cycle differences.
- Employ stop loss strategies to effectively limit per trade loss.
Summary
In general, this is a very simple and practical short-term trading strategy, especially suitable for beginners to learn and adopt for its ease of use and considerable efficacy. As long as parameters are continuously optimized with complement from other judgment tools, the strategy will become increasingly robust. The underlying idea possesses high value and deserves further research going forward.
Parameters
| Name | Default | What it controls |
|---|---|---|
| v_input_1 | 55 | Short EMA Length |
| v_input_2 | 34 | Long EMA Length |
Source Pine Script
/*backtest
start: 2024-01-01 00:00:00
end: 2024-01-28 00:00:00
period: 1h
basePeriod: 15m
exchanges: [{"eid":"Futures_Binance","currency":"BTC_USDT"}]
*/

//@version=5
strategy("mohammad tork strategy", overlay=true)

// Input parameters
lengthShortEMA = input(55, title="Short EMA Length")
lengthLongEMA = input(34, title="Long EMA Length")

// Calculate EMAs
emaShort = ta.ema(close, lengthShortEMA)
emaLong = ta.ema(close, lengthLongEMA)

// Conditions for Long Signal
longCondition = ta.crossover(emaLong, emaShort)

// Conditions for Short Signal
shortCondition = ta.crossunder(emaLong, emaShort)

// Execute Long Signal
strategy.entry("Long", strategy.long, when = longCondition)

// Execute Short Signal
strategy.entry("Short", strategy.short, when = shortCondition)

// Plot EMAs on the chart
plot(emaShort, color=color.blue, title="Short EMA")
plot(emaLong, color=color.red, title="Long EMA")

// Plot Long Signal Icon with Buy Label
plotshape(series=longCondition, title="Long Signal", color=color.green, style=shape.triangleup, location=location.abovebar, size=size.small, text="Buy")

// Plot Short Signal Icon with Sell Label
plotshape(series=shortCondition, title="Short Signal", color=color.red, style=shape.triangledown, location=location.abovebar, size=size.small, text="Sell")
Published by ChaoZhang on the FMZ strategy square · last modified 2024-01-29. Collected in the Quant Trading Vault. Unvalidated research: re-test with your own data and costs before trusting it.
Build this with AgenKit
A spec is not a trading system. Paste this into your coding agent and AgenKit runs a specialist team — architecture, test-first build, risk gates, review — with paper trading on by default.
/agenkit build a production-grade trading bot with a backtest engine, risk controls and paper trading by default from strategies/Crossover-EMA-Short-term-Trading-Strategy.md- npx agenkit install engineering-kit in your project
- Paste the command into your agent and approve each phase
- Get tests, backtest, risk controls and a paper-trading switch
Understand it first
Before you run this, read the lesson behind the idea and how to backtest it honestly. Specs like this one are the survivors of an unknown number of trials; deflate their results accordingly.
Related specs
- Adaptive ATR and RSI Trend Following Strategy with Trailing Stop LossPine Script · Trend following · 1h
- Advanced Multi Indicator Multi Dimensional Trend Cross Quantitative StrategyPine Script · Trend following · 3h
- Bollinger Bands and RSI Trend Following StrategyPine Script · Trend following · 1h
- Dual ATR Channel Trend Following StrategyPine Script · Trend following · 15m
- Dual EMA Crossover Oscillation Tracking StrategyPine Script · Trend following · 5m
- Dual MA Crossover Trend Tracking StrategyPine Script · Trend following · 1h