Strategy vault / Trend following
Dual EMA Golden Cross Strategy
This strategy generates trading signals based on the crossovers between fast EMA line and slow EMA line. When the fast EMA line crosses above the slow EMA line, a buy signal is generated. When the fast EMA line…
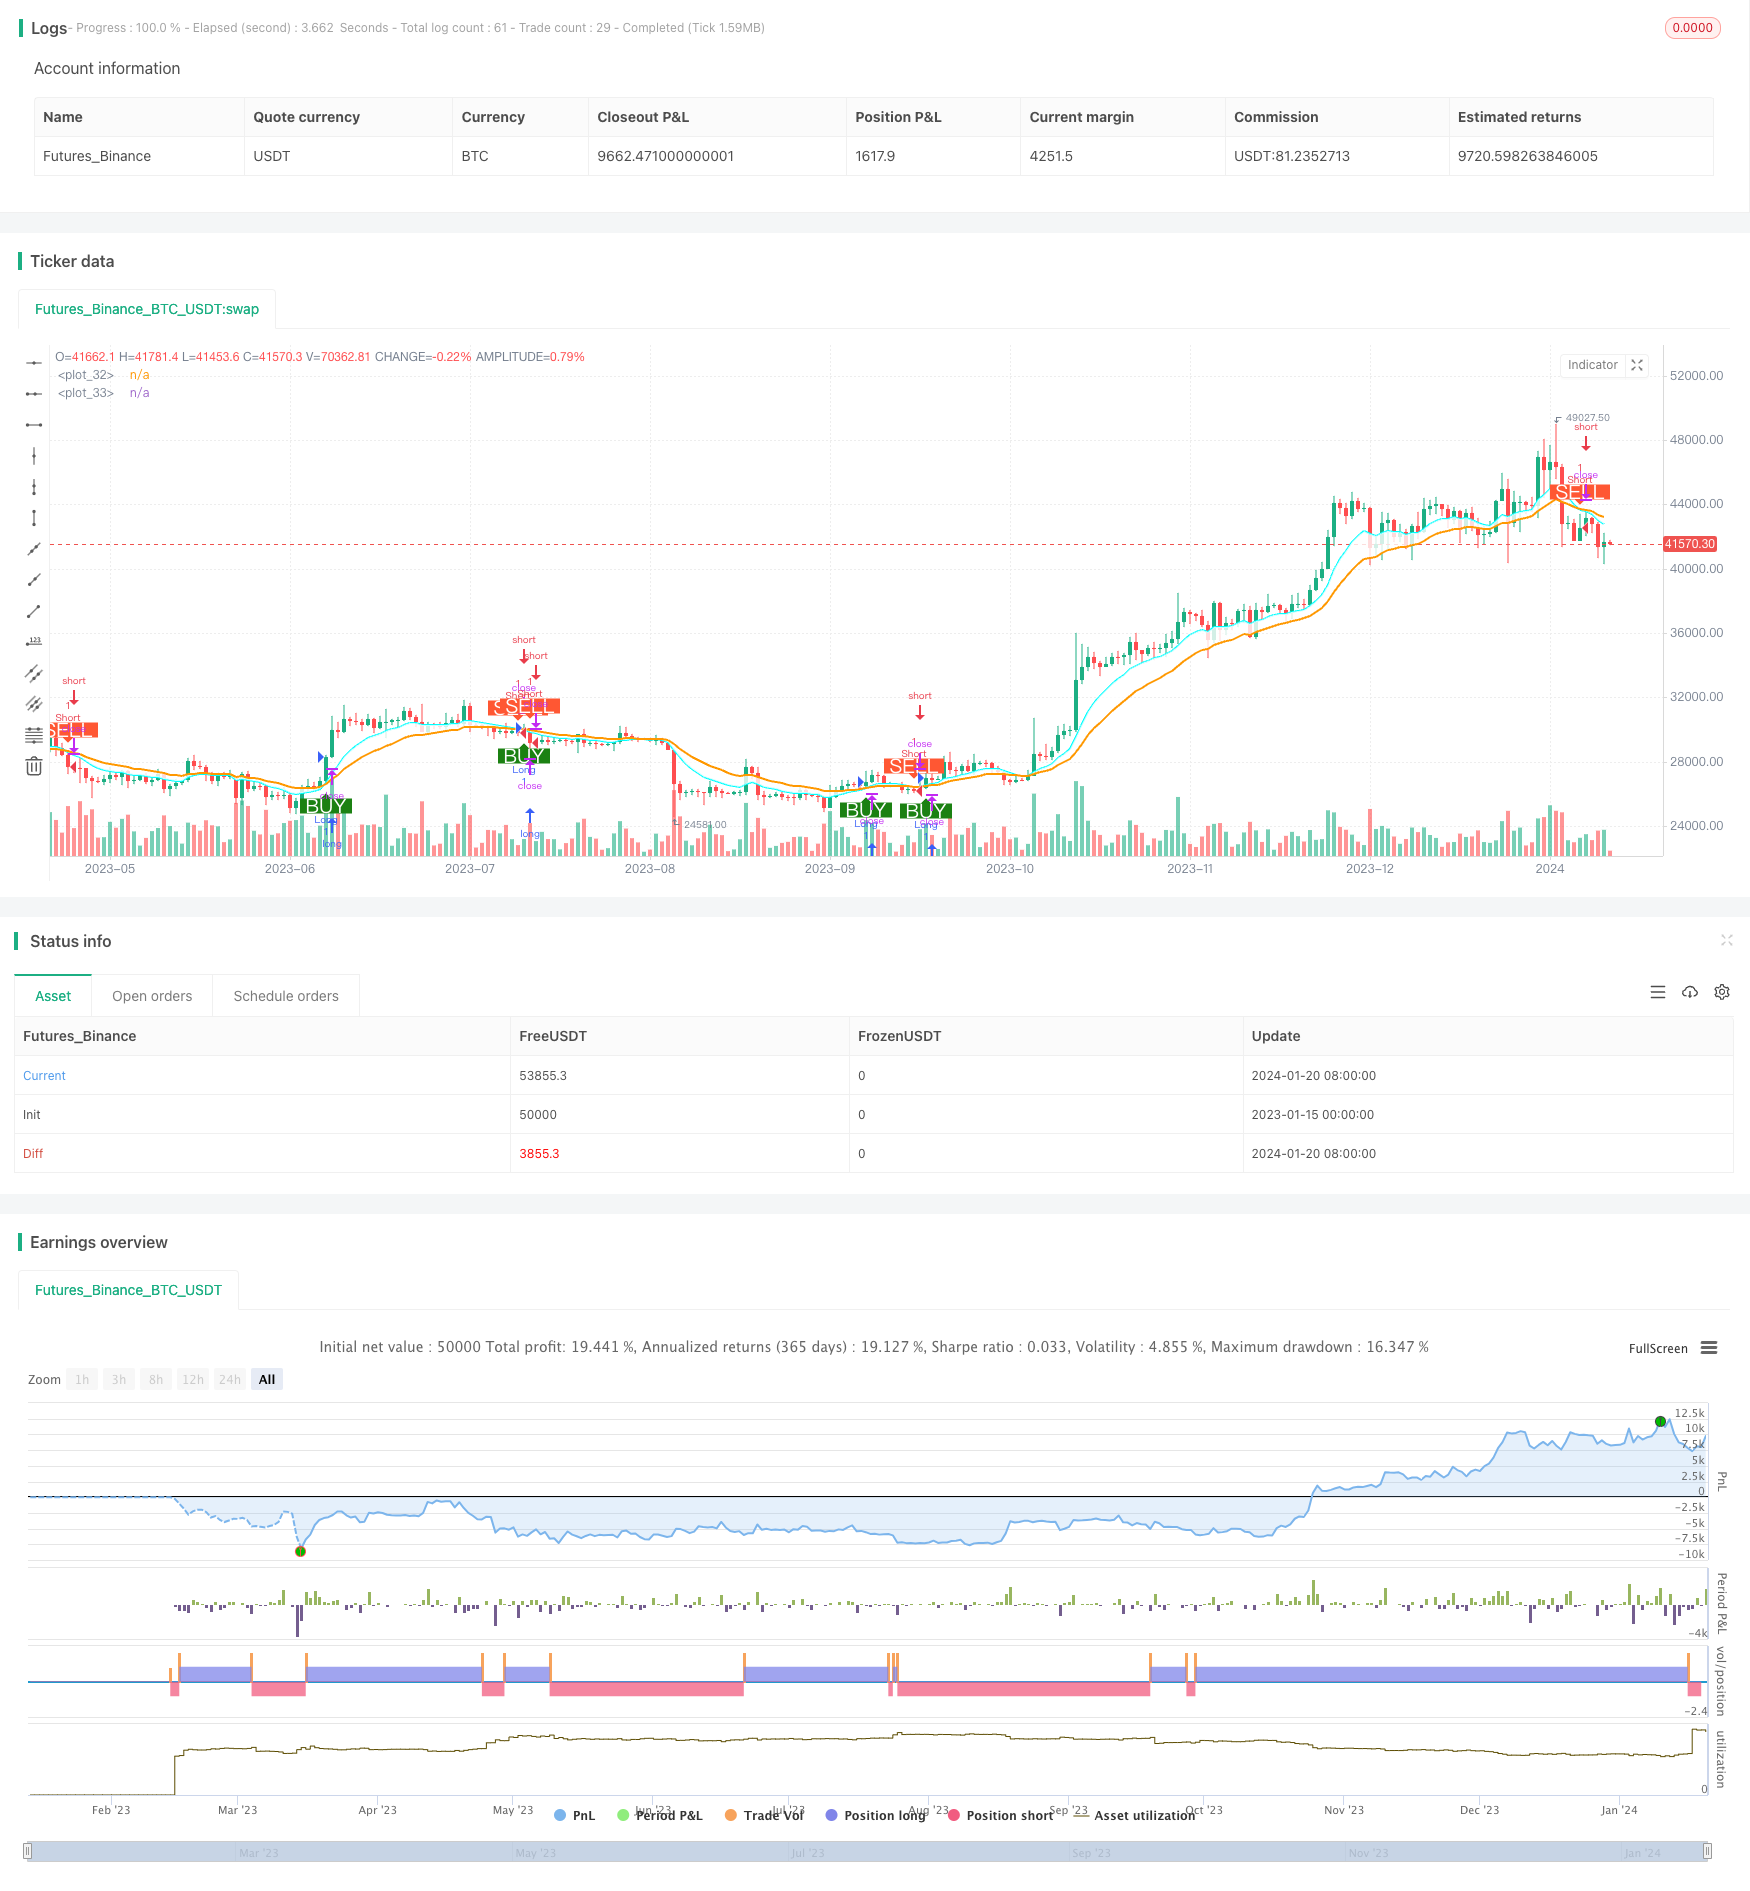
Overview
This strategy generates trading signals based on the crossovers between fast EMA line and slow EMA line. When the fast EMA line crosses above the slow EMA line, a buy signal is generated. When the fast EMA line crosses below the slow EMA line, a sell signal is generated. This strategy utilizes the advantage of moving average to effectively track market trend and generate trading signals during trend initiation.
Strategy Logic
The core indicators of this strategy are fast EMA line and slow EMA line. The strategy sets up two EMA lines with different parameters, with 10 for fast EMA and 20 for slow EMA. The 10-day EMA line responds faster to price changes, while the 20-day line responds more slowly. When the short-term EMA line crosses above the long-term EMA line, it means the short-term average line starts leading the long-term line upwards, implying the market may switch to bull state. At this point, a buy signal is generated. On the contrary, when the short EMA falls below the long EMA, it means the short EMA starts to lose its leading power ahead of the long EMA, implying the market may switch to bear state. Accordingly, a sell signal is generated.
By leveraging the crossover logic between fast and slow EMA lines, this strategy captures the switching points of market trend timely and generates trading signals accordingly. Meanwhile, the EMA itself has the capability to filter out false signals, avoiding excessive trading during market consolidation. This allows the strategy to capture market turning points while reducing wrong trades, leading to superior profitability.
Advantage Analysis
- Captures market turning points via EMA crossover rules for strong profitability
- Utilizes both fast and slow EMA lines for their respective merits
- Inherent noise filtering capability of EMA reduces wrong trades
- Simple to understand, optimize and extend
- High extendibility to incorporate other assisting indicators
Risk Analysis
- Frequent false signals may occur during range-bound markets
- Improper EMA parameter setting may cause missing major turns
- Lagging issue may result in missing short-term trading chances
- Unable to adapt to drastic market turbulence
To address these risks, optimizations can be introduced like adding filtering rules, combining MACD to avoid false signals, using adaptive EMA to accelerate response etc. Also, proper stop loss and profit taking mechanisms are necessary.
Optimization Directions
The potential directions for further optimization include:
- Adding filtering rules on entry signals, e.g. combine trading volume
- Incorporating assisting indicators like MACD for supplementary signals
- Introducing adaptive EMA to tune parameters dynamically
- Applying multi-timeframe analysis to leverage different EMAs
- Optimizing stop loss strategies via trailing stop, percent stop etc.
- Leveraging AI technologies for automatic parameter tuning
Summary
This strategy captures critical market turning points through the crossover logic of dual EMA lines, making it effective for live trading. With additional filters, assisting indicators and stop loss optimizations, the stability of the strategy can be further enhanced. The strategy logic is straight-forward and worth learning for quant traders, with abundant potential for extensions and improvements.
Parameters
| Name | Default | What it controls |
|---|---|---|
| v_input_1 | 100000 | Buy quantity |
| v_input_2 | 2019 | Backtest Start Year |
| v_input_3 | true | Backtest Start Month |
| v_input_4 | true | Backtest Start Day |
| v_input_5 | false | Backtest Start Hour |
| v_input_6 | false | Backtest Start Minute |
| v_input_7 | 2099 | Backtest Stop Year |
| v_input_8 | true | Backtest Stop Month |
| v_input_9 | 30 | Backtest Stop Day |
| v_input_10 | true | Color Background? |
| v_input_11 | 10 | Select EMA 1 |
| v_input_12 | 20 | Select EMA 2 |
Source Pine Script
/*backtest
start: 2023-01-15 00:00:00
end: 2024-01-21 00:00:00
period: 1d
basePeriod: 1h
exchanges: [{"eid":"Futures_Binance","currency":"BTC_USDT"}]
*/

//@version=4
strategy("Backtest single EMA cross", overlay=true)

qty = input(100000, "Buy quantity")

testStartYear = input(2019, "Backtest Start Year")
testStartMonth = input(1, "Backtest Start Month")
testStartDay = input(1, "Backtest Start Day")
testStartHour = input(0, "Backtest Start Hour")
testStartMin = input(0, "Backtest Start Minute")
testPeriodStart = timestamp(testStartYear, testStartMonth, testStartDay, testStartHour, testStartMin)
testStopYear = input(2099, "Backtest Stop Year")
testStopMonth = input(1, "Backtest Stop Month")
testStopDay = input(30, "Backtest Stop Day")
testPeriodStop = timestamp(testStopYear, testStopMonth, testStopDay, 0, 0)
testPeriodBackground = input(title="Color Background?", type=input.bool, defval=true)
testPeriodBackgroundColor = testPeriodBackground and time >= testPeriodStart and time <= testPeriodStop ?
   #00FF00 : na
testPeriod() => true


ema1 = input(10, title="Select EMA 1")
ema2 = input(20, title="Select EMA 2")

expo = ema(close, ema1)
ma = ema(close, ema2)

avg_1 = avg(expo, ma)
s2 = cross(expo, ma) ? avg_1 : na
//plot(s2, style=plot.style_line, linewidth=3, color=color.red, transp=0)

p1 = plot(expo, color=#00FFFF, linewidth=2, transp=0)
p2 = plot(ma, color=color.orange, linewidth=2, transp=0)
fill(p1, p2, color=color.white, transp=80)

longCondition = crossover(expo, ma)

shortCondition = crossunder(expo, ma)


if testPeriod()
    strategy.entry("Long", strategy.long, when=longCondition)
    strategy.entry("Short", strategy.short, when=shortCondition)

plotshape(longCondition, title = "Buy Signal", text ="BUY", textcolor =#FFFFFF , style=shape.labelup, size = size.normal, location=location.belowbar, color = #1B8112, transp = 0)
plotshape(shortCondition, title = "Sell Signal", text ="SELL", textcolor = #FFFFFF, style=shape.labeldown, size = size.normal, location=location.abovebar, color = #FF5733, transp = 0)
Published by ChaoZhang on the FMZ strategy square · last modified 2024-01-22. Collected in the Quant Trading Vault. Unvalidated research: re-test with your own data and costs before trusting it.
Build this with AgenKit
A spec is not a trading system. Paste this into your coding agent and AgenKit runs a specialist team — architecture, test-first build, risk gates, review — with paper trading on by default.
/agenkit build a production-grade trading bot with a backtest engine, risk controls and paper trading by default from strategies/Dual-EMA-Golden-Cross-Strategy.md- npx agenkit install engineering-kit in your project
- Paste the command into your agent and approve each phase
- Get tests, backtest, risk controls and a paper-trading switch
Understand it first
Before you run this, read the lesson behind the idea and how to backtest it honestly. Specs like this one are the survivors of an unknown number of trials; deflate their results accordingly.
Related specs
- Adaptive ATR and RSI Trend Following Strategy with Trailing Stop LossPine Script · Trend following · 1h
- Advanced Multi Indicator Multi Dimensional Trend Cross Quantitative StrategyPine Script · Trend following · 3h
- Bollinger Bands and RSI Trend Following StrategyPine Script · Trend following · 1h
- Crossover EMA Short term Trading StrategyPine Script · Trend following · 1h
- Dual ATR Channel Trend Following StrategyPine Script · Trend following · 15m
- Dual EMA Crossover Oscillation Tracking StrategyPine Script · Trend following · 5m