Strategy vault / Trend following
Dual Exponential Moving Average Crossover Strategy
The Dual Exponential Moving Average Crossover Strategy is a typical trend-following strategy. It uses the golden cross and dead cross of Double Exponential Moving Averages (DEMA) with different parameters to…
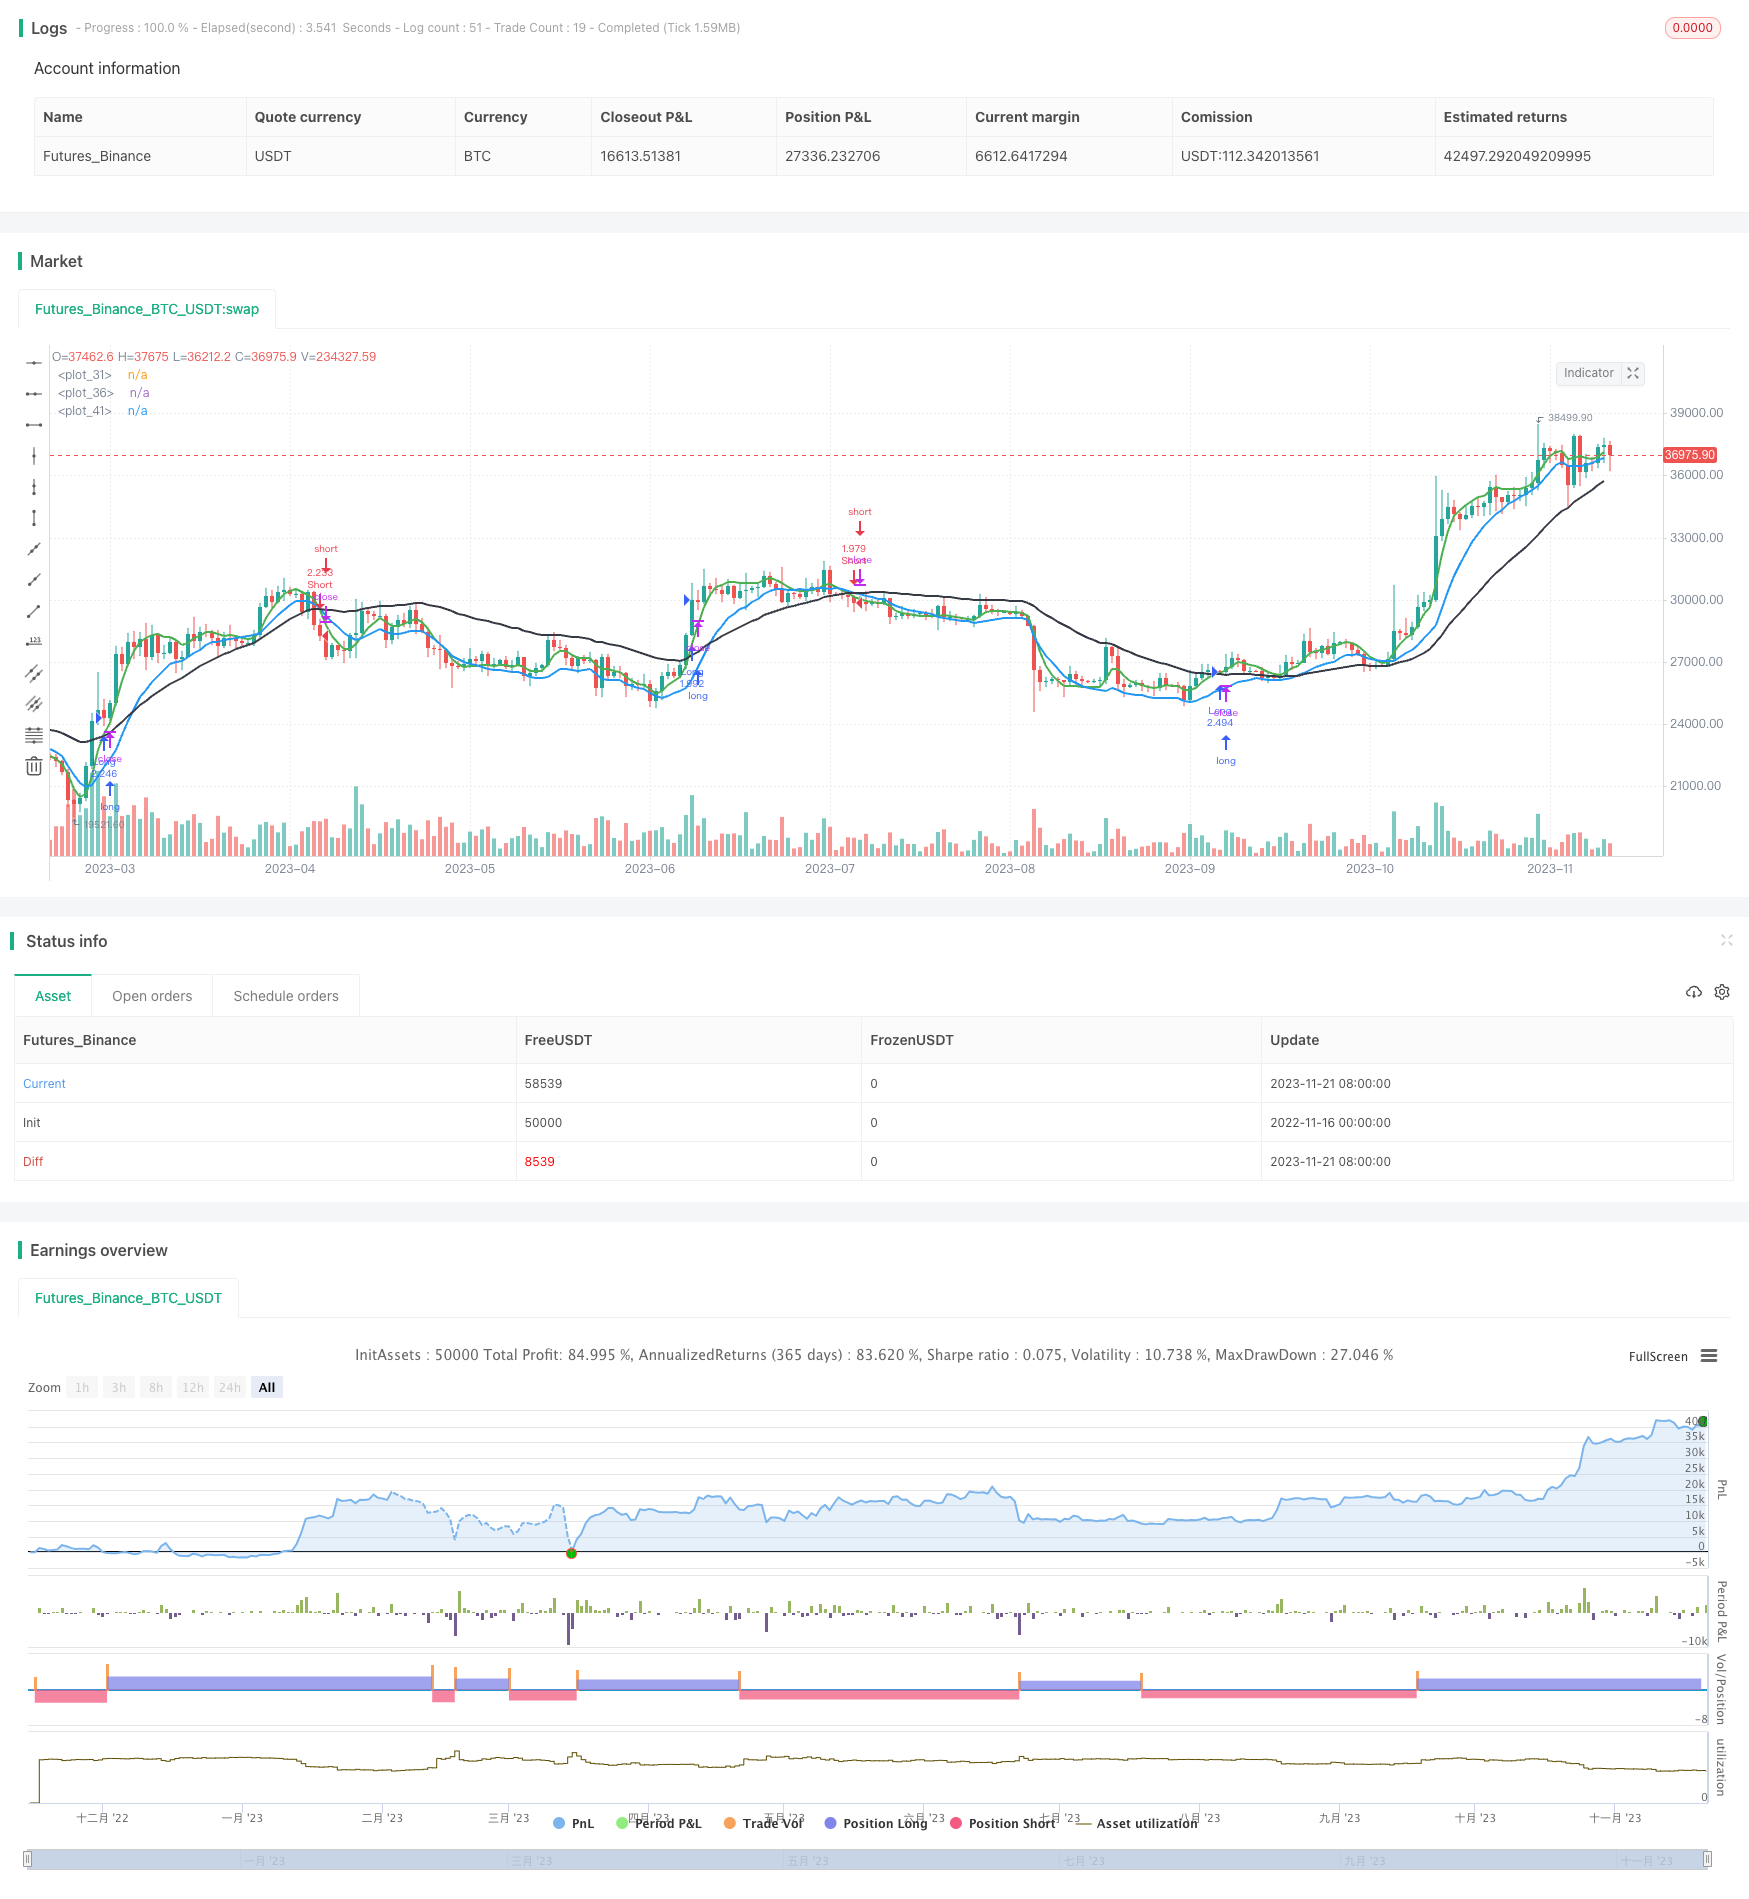
Overview
The Dual Exponential Moving Average Crossover Strategy is a typical trend-following strategy. It uses the golden cross and dead cross of Double Exponential Moving Averages (DEMA) with different parameters to determine market trends and make corresponding long and short positions.
Strategy Logic
The strategy uses 3 DEMAs simultaneously with different parameters: DEMA(8), DEMA(20) and DEMA(63). Among them:
DEMA(8) reacts the fastest to capture short-term trends;
DEMA(20) moves slightly slower to identify medium-term trends;
DEMA(63) reacts the slowest to judge the long-term trend direction.
When the fast line DEMA(8) crosses above the medium line DEMA(20) and the slow line DEMA(63), it indicates that the market turns from bottom to top, long position should be made. When DEMA(8) crosses below DEMA(20) and DEMA(63), it indicates that the market turns from top to bottom, short position should be made.
Advantage Analysis
Compared with single moving average, double exponential moving average is more sensitive to price changes and can detect turning points of trends earlier. This strategy combines multiple timeframes of DEMAs, which can effectively track the market trend direction.
The combination of multi-timeframe DEM lines improves the quality of trading signals and avoids false breakouts. At the same time, the strategy only generates signals when the three lines cross, avoiding excessive frequency of trading.
Risk Analysis
The main risks of this strategy are:
- Fewer cross signals of the three lines may miss some trading opportunities.
- DEM lines crossing delay may fail to respond price change timely when market fluctuates violently.
- It cannot cope with huge non-trending markets effectively.
The risks can be further improved and controlled by optimizing parameters, adding filter conditions etc.
Optimization Directions
The strategy can be optimized from the following aspects:
- Optimize the moving average parameters to make them fit different market characteristics better.
- Add filters like volume, volatility to avoid wrong signals.
- Combine other indicators like MACD, KDJ to filter fake signals.
- Add stop loss strategy to control single loss.
- Optimize position management to make the profit ratio greater than loss ratio.
Summary
The DEMA crossover strategy has a clear overall idea. By combining multi-timeframe DEMAs, it can effectively determine the market trend direction and is a typical trend-following strategy. The strategy can be improved by parameter optimization, adding filters, stop loss management etc. according to actual needs, so as to obtain better strategy results.
Parameters
| Name | Default | What it controls |
|---|---|---|
| v_input_1 | 8 | short |
| v_input_2_ohlc4 | 0 | Source Dema 1: ohlc4 | high | low | open | hl2 | hlc3 | hlcc4 | close |
| v_input_3 | 20 | long |
| v_input_4_low | 0 | Source Dema 2: low | high | close | open | hl2 | hlc3 | hlcc4 | ohlc4 |
| v_input_5 | 63 | long2 |
| v_input_6_close | 0 | Source Dema 3: close | high | low | open | hl2 | hlc3 | hlcc4 | ohlc4 |
Source Pine Script
/*backtest
start: 2022-11-16 00:00:00
end: 2023-11-22 00:00:00
period: 1d
basePeriod: 1h
exchanges: [{"eid":"Futures_Binance","currency":"BTC_USDT"}]
*/

// This source code is subject to the terms of the Mozilla Public License 2.0 at https://mozilla.org/MPL/2.0/
// © Noldo

//@version=4
//Quoted by Author HighProfit

//Lead-In
strategy("Double Exponential Moving Average 8-20-63 Strategy",
         shorttitle="DEMA-8-20-63",
         overlay=true,
         max_bars_back = 5000,
         initial_capital=100000,
         max_bars_back = 5000,
         default_qty_type=strategy.percent_of_equity,
         default_qty_value=100,
         commission_type=strategy.commission.percent,
         commission_value=0.1,
         pyramiding = 0)

short = input(8, minval=1)
srcShort = input(ohlc4, title="Source Dema 1")

long = input(20, minval=1)
srcLong = input(low, title="Source Dema 2")

long2 = input(63, minval=1)
srcLong2 = input(close, title="Source Dema 3")
e1 = ema(srcShort, short)
e2 = ema(e1, short)
dema1 = 2 * e1 - e2
plot(dema1, color=color.green, linewidth=2)

e3 = ema(srcLong, long)
e4 = ema(e3, long)
dema2 = 2 * e3 - e4
plot(dema2, color=color.blue, linewidth=2)

e5 = ema(srcLong2, long2)
e6 = ema(e5, long2)
dema3 = 2 * e5 - e6
plot(dema3, color=color.black, linewidth=2)

longC  = dema1 > dema2 and dema1 > dema3
shortC = dema1 < dema2 and dema1 < dema3

alertlong  = longC and  not longC[1]
alertshort = shortC and not shortC[1]


strategy.entry("Long" , strategy.long , when = longC ,comment="Long")
strategy.entry("Short", strategy.short, when = shortC,comment="Short")

// Alerts

alertcondition(longC  , title='Long' , message=' Buy  Signal ')
alertcondition(shortC , title='Short', message=' Sell Signal ')
Published by ChaoZhang on the FMZ strategy square · last modified 2023-11-23. Collected in the Quant Trading Vault. Unvalidated research: re-test with your own data and costs before trusting it.
Build this with AgenKit
A spec is not a trading system. Paste this into your coding agent and AgenKit runs a specialist team — architecture, test-first build, risk gates, review — with paper trading on by default.
/agenkit build a production-grade trading bot with a backtest engine, risk controls and paper trading by default from strategies/Dual-Exponential-Moving-Average-Crossover-Strategy.md- npx agenkit install engineering-kit in your project
- Paste the command into your agent and approve each phase
- Get tests, backtest, risk controls and a paper-trading switch
Understand it first
Before you run this, read the lesson behind the idea and how to backtest it honestly. Specs like this one are the survivors of an unknown number of trials; deflate their results accordingly.
Related specs
- Adaptive ATR and RSI Trend Following Strategy with Trailing Stop LossPine Script · Trend following · 1h
- Advanced Multi Indicator Multi Dimensional Trend Cross Quantitative StrategyPine Script · Trend following · 3h
- Bollinger Bands and RSI Trend Following StrategyPine Script · Trend following · 1h
- Crossover EMA Short term Trading StrategyPine Script · Trend following · 1h
- Dual ATR Channel Trend Following StrategyPine Script · Trend following · 15m
- Dual EMA Crossover Oscillation Tracking StrategyPine Script · Trend following · 5m