Strategy vault / Trend following
MACD Golden Cross and Death Cross Strategy
This strategy uses the crossover of the DIF line and DEA line in the MACD indicator to generate trading signals. When the DIF line crosses above the DEA line, it generates a long signal; when the DIF line crosses…
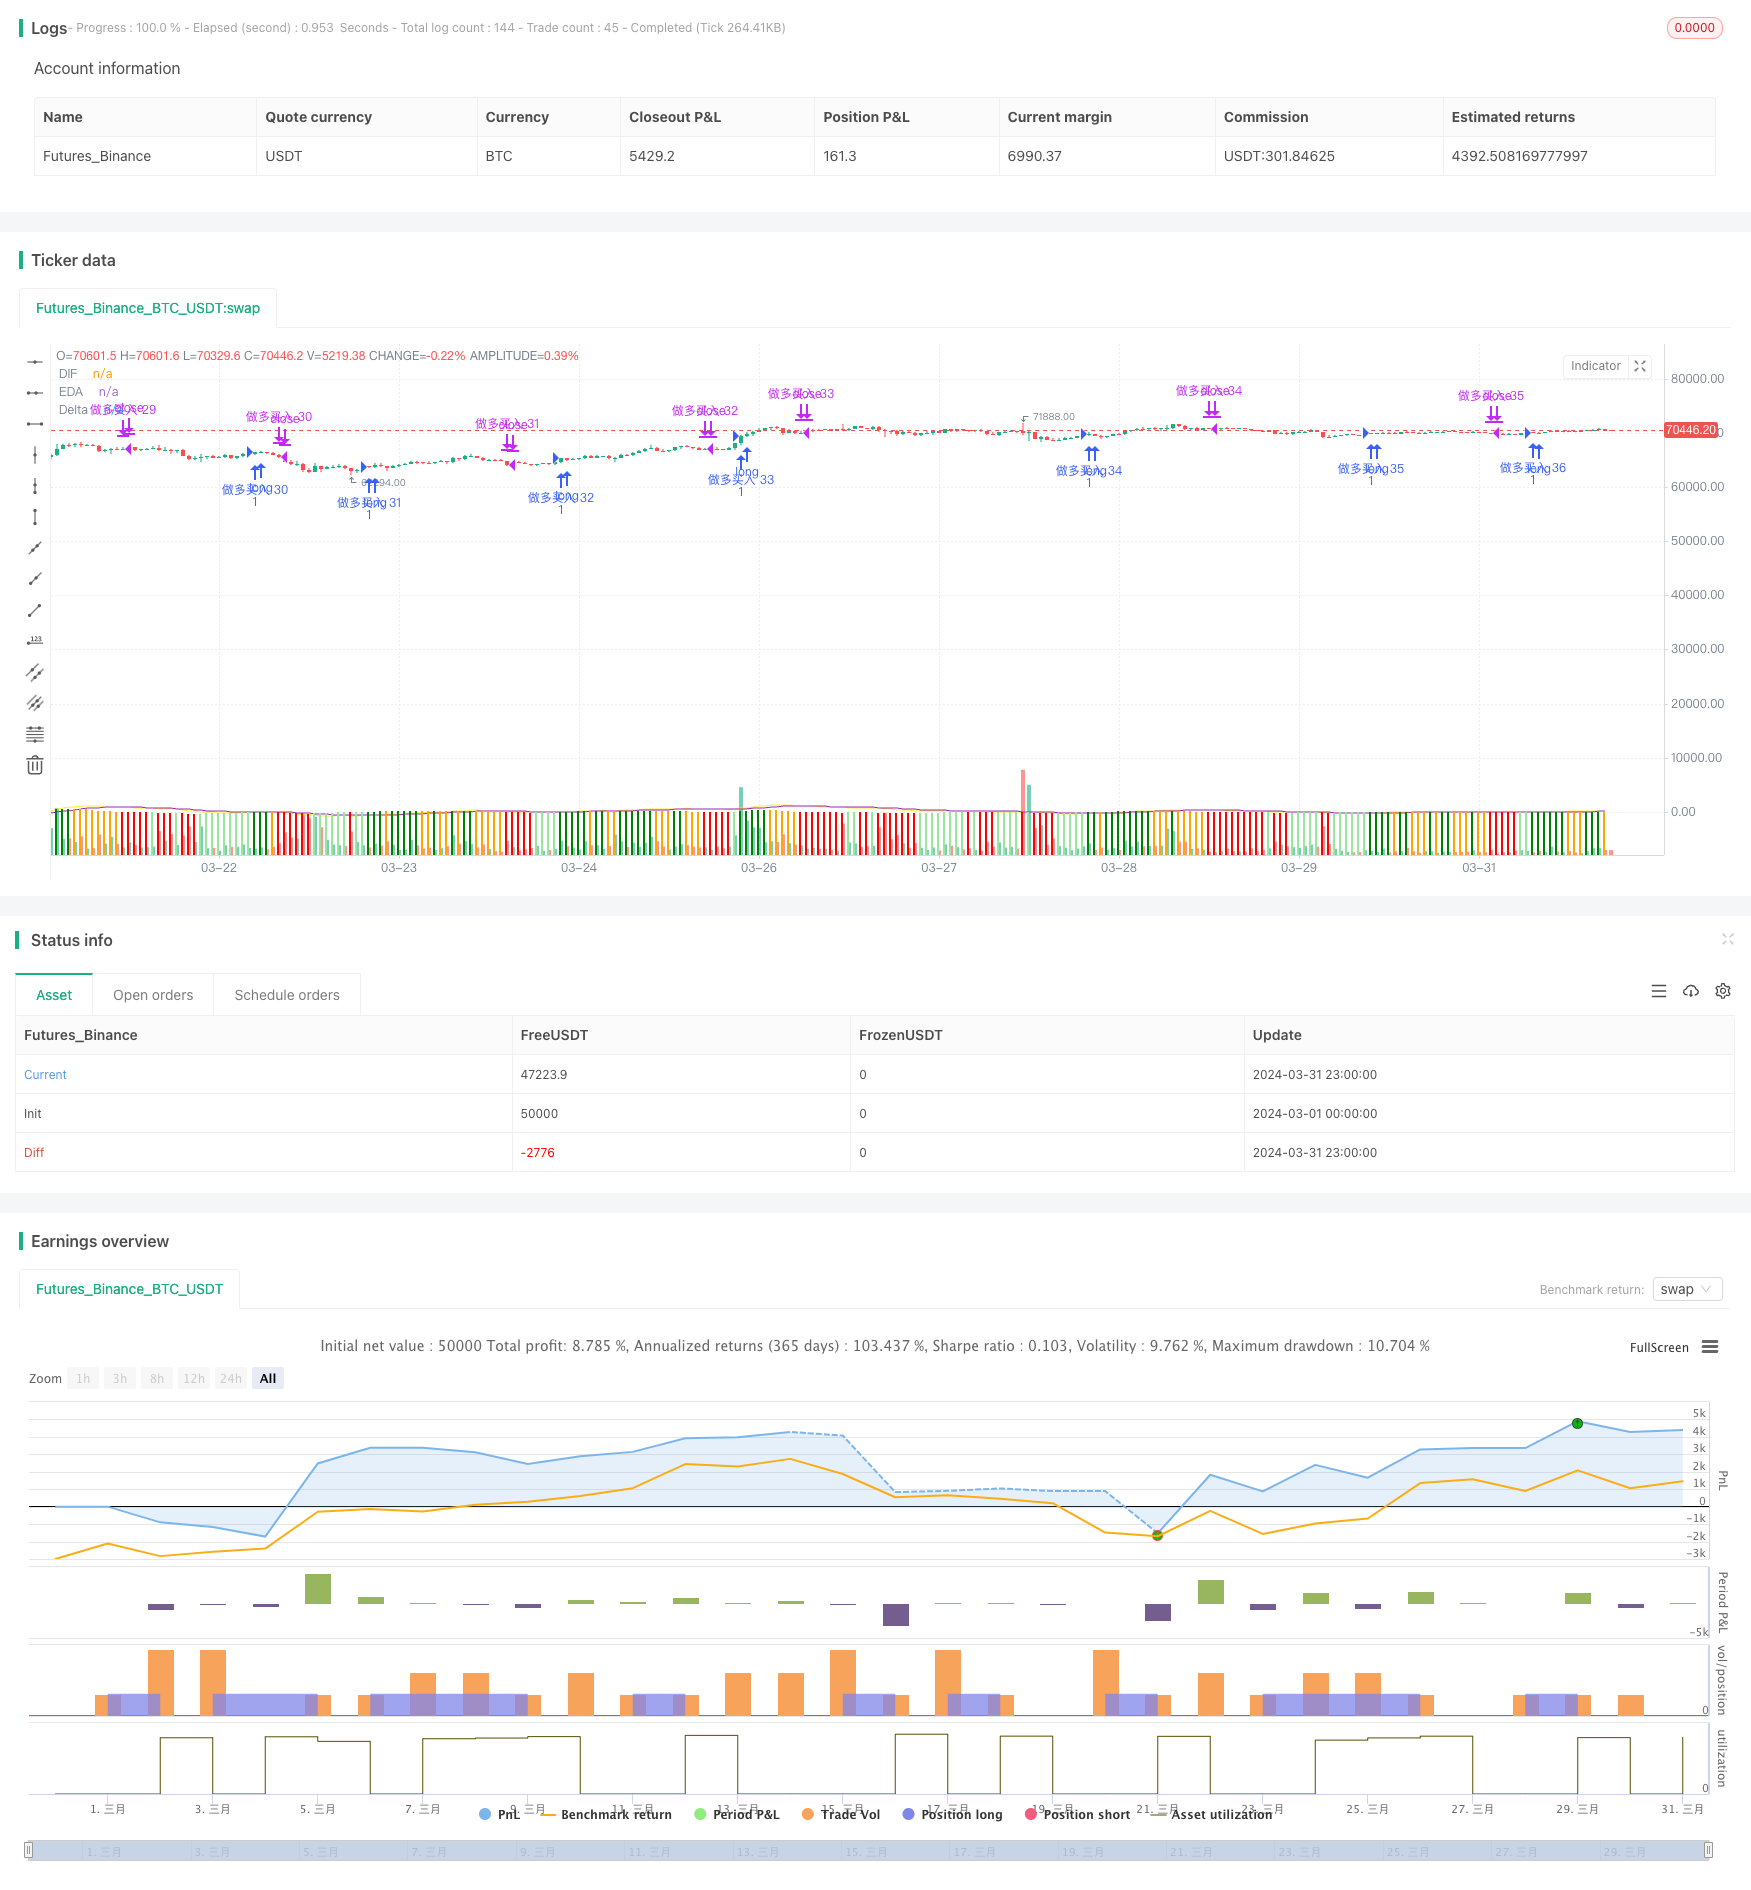
Overview
This strategy uses the crossover of the DIF line and DEA line in the MACD indicator to generate trading signals. When the DIF line crosses above the DEA line, it generates a long signal; when the DIF line crosses below the DEA line, it generates a short signal. The backtesting results of this strategy show that on the BTCUSDT trading pair, the win rate is about 40%, and the annualized return is 1.05. However, it will cause the number of assets held to increase continuously, so it cannot be used as an independent arbitrage strategy.
Strategy Principle
- Calculate the fast exponential moving average (EMA) and slow exponential moving average (EMA).
- Calculate the DIF line, which is the difference between the fast EMA and the slow EMA.
- Calculate the DEA line, which is the EMA of the DIF line.
- Calculate the MACD histogram, which is the difference between the DIF line and the DEA line.
- When the DIF line crosses above the DEA line, generate a long signal and open a long position.
- When the DIF line crosses below the DEA line, generate a short signal, close the long position, and open a short position.
- When the opposite crossover signal appears again, close the current position and open a position in the opposite direction.
Strategy Advantages
- This strategy uses the widely used MACD indicator, which is easy to understand and implement.
- The strategy logic is clear, and the trading signals are explicit.
- It is suitable for trending markets and can track the main trends of the market.
Strategy Risks
- The win rate of this strategy is low, only 40%, which means that 60% of the trades may be losing.
- This strategy will cause the number of assets held to increase continuously, which may bring additional risk exposure.
- In a fluctuating market, this strategy may generate frequent trading signals, leading to high trading costs.
- This strategy does not consider risk management, such as stop-loss and position management, which may lead to significant losses.
Strategy Optimization Directions
- Introduce trend filters, such as long-term moving averages, to avoid trading in fluctuating markets.
- Optimize the parameters of the MACD indicator, such as the period of the fast EMA, slow EMA, and signal line, to adapt to different market conditions.
- Add risk management measures, such as stop-loss and position management, to control potential losses.
- Combine with other technical indicators or fundamental analysis to improve the reliability of trading signals.
Summary
The MACD golden cross and death cross strategy is a simple and easy-to-understand trading strategy that is suitable for trending markets. However, the win rate of this strategy is low, and it lacks risk management measures, so it needs further optimization and improvement. By introducing trend filters, optimizing parameters, adding risk management, and combining with other analysis methods, the performance and reliability of this strategy can be improved. Nevertheless, this strategy still cannot be used as an independent arbitrage strategy and needs to be combined with other strategies to obtain better trading results.
Parameters
| Name | Default | What it controls |
|---|---|---|
| v_input_1 | 12 | Fast Line Length |
| v_input_2 | 26 | Slow Line Length |
| v_input_3 | 9 | MACD Moving Average Length |
| v_input_4 | green | MACD Bar grows above the 0 line |
| v_input_5 | #99e69c | MACD Bar grows below the 0 line |
| v_input_6 | orange | MACD The bar falls above the 0 line |
| v_input_7 | red | MACD The bar falls below the 0 line |
| v_input_8 | true | Whether to display entry and exit signals |
Source Pine Script
/*backtest
start: 2024-03-01 00:00:00
end: 2024-03-31 23:59:59
period: 1h
basePeriod: 15m
exchanges: [{"eid":"Futures_Binance","currency":"BTC_USDT"}]
*/

// @version=5
// @description This Strategy Uses MACD DIF Line and EDA Enter and exit operations when lines generate golden cross and death cross, After backtesting, the winning rate is about 40%, BTCUSDT Annualized Rate of Return 1.05, At the same time, the number of assets held will continue to increase., Cannot be used as an independent arbitrage strategy.

strategy("MACD Golden Cross Strategy", overlay=true)

fastLength = input(12, "Fast Line Length")
slowLength = input(26, "Slow Line Length")
MACDLength = input(9, "MACD Moving Average Length")

deltaIncreaseOver0 = input(color.green,'MACD Bar grows above the 0 line')
deltaIncreaseUnder0 = input(color.rgb(153, 230, 156),'MACD Bar grows below the 0 line')

deltaDecreaseOver0 = input(color.orange,'MACD The bar falls above the 0 line')
deltaDecreaseUnder0 = input(color.red,'MACD The bar falls below the 0 line')

buySellEnabled = input(true, 'Whether to display entry and exit signals')

// @variable Number of Long Trades
var longRound = 0
// @variable Number of Short Trades
var shortRound = 0

DIF = ta.ema(close, fastLength) - ta.ema(close, slowLength) // Difference between fast and slow moving averages
EDA = ta.ema(DIF, MACDLength) // DIF Line's EMA moving average
delta = DIF - EDA // MACD Column height

// plot(0, 'Zero', color.black)
plot(DIF,'DIF', color.yellow)
plot(EDA, "EDA", color.purple)

isDeltaIncreasing = delta[1] < delta
isDeltaOver0 = delta > 0
deltaColor = isDeltaIncreasing ? (isDeltaOver0? deltaIncreaseOver0: deltaIncreaseUnder0) :( isDeltaOver0? deltaDecreaseOver0: deltaDecreaseUnder0)
plot(delta, "Delta", deltaColor, style = plot.style_columns)

isDeltaV = delta > delta[1] and delta[2] > delta[1]
isDeltaA = delta < delta[1] and delta[2] < delta[1]

longBuy(round) =>
	entry = str.format("Long Buy {0}",round)
	// log.info(str.format("{0} {1}",entry,close))
	strategy.entry(entry, strategy.long, comment=entry)

longSell(round) =>
	entry = str.format("Long Buy {0}",round)
	exit = str.format("Long Sell {0}",round)
	// log.info(str.format("{0} {1}",exit,close))
	strategy.close(entry, comment=exit)

shortSell(round) =>
	entry = str.format("Short Sell {0}",round)
	// log.info(str.format("{0} {1}",entry,close))
	strategy.entry(entry, strategy.short, comment= entry)

shortBuy(round) =>
	entry = str.format("Short Sell {0}",round)
	exit = str.format("Short Buy {0}",round)
	// log.info(str.format("{0} {1}",exit,close))
	strategy.close(entry, comment=exit)

if (buySellEnabled)
	if (ta.crossunder(DIF, EDA))
		longSell(longRound)
	if (ta.crossover(DIF, EDA))
		longRound := longRound + 1
		longBuy(longRound)
Published by ChaoZhang on the FMZ strategy square · last modified 2024-04-26. Collected in the Quant Trading Vault. Unvalidated research: re-test with your own data and costs before trusting it.
Build this with AgenKit
A spec is not a trading system. Paste this into your coding agent and AgenKit runs a specialist team — architecture, test-first build, risk gates, review — with paper trading on by default.
/agenkit build a production-grade trading bot with a backtest engine, risk controls and paper trading by default from strategies/MACD-Golden-Cross-and-Death-Cross-Strategy.md- npx agenkit install engineering-kit in your project
- Paste the command into your agent and approve each phase
- Get tests, backtest, risk controls and a paper-trading switch
Understand it first
Before you run this, read the lesson behind the idea and how to backtest it honestly. Specs like this one are the survivors of an unknown number of trials; deflate their results accordingly.
Related specs
- Adaptive ATR and RSI Trend Following Strategy with Trailing Stop LossPine Script · Trend following · 1h
- Advanced Multi Indicator Multi Dimensional Trend Cross Quantitative StrategyPine Script · Trend following · 3h
- Bollinger Bands and RSI Trend Following StrategyPine Script · Trend following · 1h
- Crossover EMA Short term Trading StrategyPine Script · Trend following · 1h
- Dual ATR Channel Trend Following StrategyPine Script · Trend following · 15m
- Dual EMA Crossover Oscillation Tracking StrategyPine Script · Trend following · 5m