Strategy vault / Trend following
MACD Trend Following Strategy 446542
The MACD Trend Following Strategy is a quantitative trading strategy based on the MACD indicator. The main idea of this strategy is to use the golden cross and death cross signals of the MACD indicator to determine…
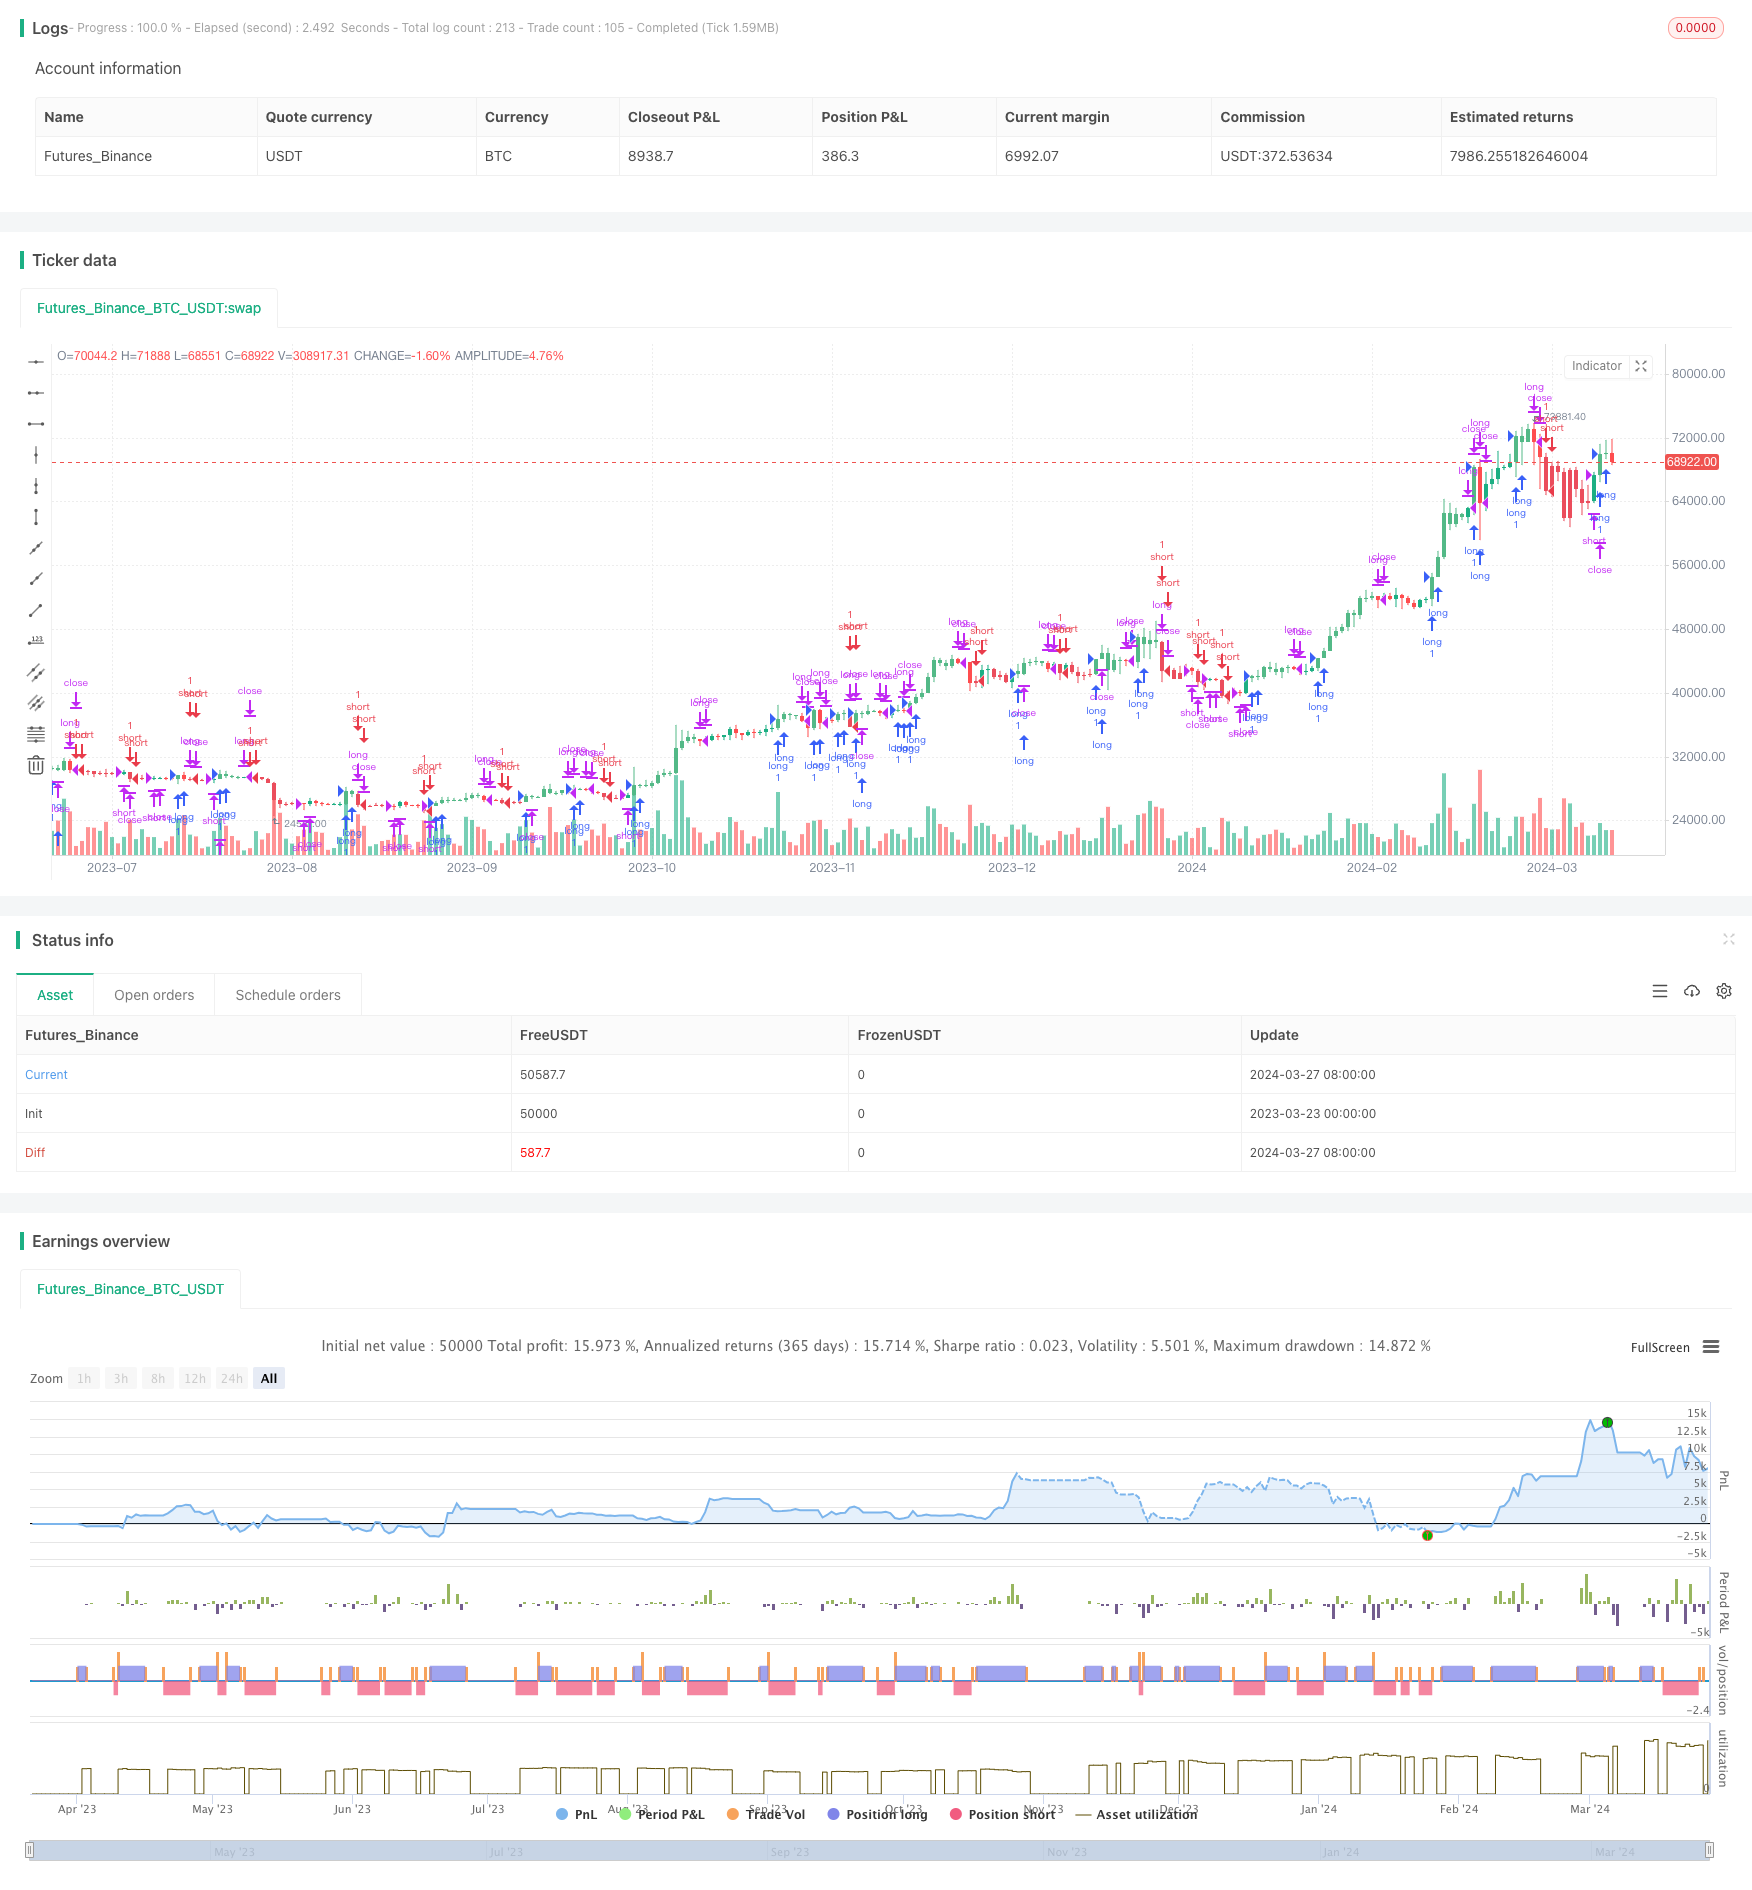
Overview
The MACD Trend Following Strategy is a quantitative trading strategy based on the MACD indicator. The main idea of this strategy is to use the golden cross and death cross signals of the MACD indicator to determine the direction of the trend and establish long or short positions at appropriate times. When the MACD line crosses above the signal line and above the zero axis, a long position is opened; when the MACD line crosses below the signal line and below the zero axis, a short position is opened. The strategy uses the most recent low point as the stop loss for long positions and the most recent high point as the stop loss for short positions. The closing condition is when the MACD line crosses the signal line in the opposite direction.
Strategy Principle
The core principle of the MACD Trend Following Strategy is to use the MACD indicator to capture the formation and reversal of trends. The MACD indicator consists of the difference between two moving averages (fast and slow) and is used in conjunction with a signal line to generate trading signals. When the MACD line crosses above the signal line and above the zero axis, it indicates an upward trend is forming, and a long position is opened. When the MACD line crosses below the signal line and below the zero axis, it indicates a downward trend is forming, and a short position is opened. The strategy uses the most recent significant low point as the stop loss for long positions and the most recent significant high point as the stop loss for short positions to control risk. When the MACD line crosses the signal line in the opposite direction, the current position is closed.
Strategy Advantages
The MACD Trend Following Strategy can effectively capture trending opportunities by establishing positions at the beginning of trend formation, fully utilizing the momentum of the trend.
The strategy uses both the MACD golden/death cross and the zero axis as filtering conditions, which can better filter out false signals in a oscillating market.
The strategy uses the most recent significant high and low points as stop loss levels, which can control the risk exposure of a single trade.
The strategy logic is clear, easy to understand and implement, making it suitable for beginners to learn.
Strategy Risks
The MACD indicator is essentially a lagging indicator, which may experience significant drawdowns at the beginning of trend reversals.
The strategy may generate frequent trades in a oscillating market, leading to high transaction costs.
The setting of stop loss levels depends on the most recent significant high and low points, which may result in premature or delayed stop losses in certain situations.
The strategy does not consider position sizing and money management, which need to be optimized based on specific circumstances in practical applications.
Strategy Optimization Directions
Consider introducing other technical indicators or price behavior patterns as filtering conditions to improve the reliability and accuracy of signals.
Optimize the method of setting stop loss levels, such as using ATR or percentage-based stop losses, to better control risk.
Introduce position sizing and money management mechanisms to dynamically adjust position sizes based on market volatility and account equity.
Optimize and adjust parameters for different markets and trading instruments to find the most suitable parameter combinations.
Summary
The MACD Trend Following Strategy is a simple and effective quantitative trading strategy that captures trending opportunities by leveraging the characteristics of the MACD indicator. The strategy has a clear logic, is easy to understand and implement, making it suitable for beginners to learn. However, in practical applications, attention needs to be paid to risk control, and it should be combined with other methods for optimization and improvement to achieve more robust trading performance.
Parameters
| Name | Default | What it controls |
|---|---|---|
| v_input_1 | 3 | MACD fast moving average |
| v_input_2 | 9 | MACD slow moving average |
| v_input_3 | 5 | MACD signal line moving average |
| v_input_4 | true | length |
| v_input_5 | true | From Month |
| v_input_6 | true | From Day |
| v_input_7 | 2002 | From Year |
| v_input_8 | 3 | To Month |
| v_input_9 | true | To Day |
| v_input_10 | 2029 | To Year |
Source Pine Script
/*backtest
start: 2023-03-23 00:00:00
end: 2024-03-28 00:00:00
period: 1d
basePeriod: 1h
exchanges: [{"eid":"Futures_Binance","currency":"BTC_USDT"}]
*/

//@version=4
strategy("MACD trendfollow", shorttitle="MACD TF", overlay=true)
// switch = input(true, title="Enable MACD Bar Color")
// X001TK MACD trendfollow Strategy
//
//
// This strategy combines the non standart approach in MACD strategy to buy once to buy when the MACD value goes above Signal line and a zero line, to sell on the opposite condition.
//
//
// This strategy goes long if the MACD (3,9,5) goes above its Signal and above zero
//
// You can set Stop loss on the recent lowest low when long position is opened and recent highest hugh in short
//
//
// Exit rule is simple. We close the LONG position once MACD goes below Signal line and close SHORT on the opposite condition
//
//
//
//
// Input
fastMAlen = input(3, minval=1, title="MACD fast moving average")
slowMAlen = input(9,minval=1, title="MACD slow moving average")
signalMACDlen = input(5,minval=1, title="MACD signal line moving average")
// switch = input(true, title="Enable MACD Bar Color")
length = input(1, minval=1)


// === INPUT BACKTEST RANGE ===
FromMonth = input(defval = 1, title = "From Month", minval = 1, maxval = 12)
FromDay   = input(defval = 1, title = "From Day", minval = 1, maxval = 31)
FromYear  = input(defval = 2002, title = "From Year", minval = 2000)
ToMonth   = input(defval = 3, title = "To Month", minval = 1, maxval = 12)
ToDay     = input(defval = 1, title = "To Day", minval = 1, maxval = 31)
ToYear    = input(defval = 2029, title = "To Year", minval = 2017)


// === FUNCTION EXAMPLE ===
start     = timestamp(FromYear, FromMonth, FromDay, 00, 00)  // backtest start window
finish    = timestamp(ToYear, ToMonth, ToDay, 00, 00)        // backtest finish window
window()  => true // create function "within window of time"

// MACD Calculation
MACD = ema(close, fastMAlen) - ema(close, slowMAlen)
signalMACD = ema(MACD, signalMACDlen)
delta = MACD - signalMACD
fastMA = ema(close,fastMAlen)
slowMA = ema(close,slowMAlen)


// Colors
//bartrendcolor = MACD > signalMACD and MACD > 0? green : MACD < signalMACD and MACD < 0? red : MACD < signalMACD? gray :  gray
//barcolor(switch?bartrendcolor:na)

barcolour=(MACD > signalMACD and MACD > 0)?#53B987:(MACD < signalMACD and MACD < 0)?#EB4D5C:na
barcolor(color=barcolour)


// === STRATEGY ===
// conditions

longCond =  MACD > signalMACD and MACD > 0
XlongCond = MACD < signalMACD
ShortCond = MACD < signalMACD and MACD < 0
XShortCond = MACD > signalMACD


strategy.entry("long", strategy.long, when=longCond==true and window()==true )
//strategy.exit(id="Close Long", stop=longStop)//, limit=longTake)
strategy.close("long", when=XlongCond==true and window()==true)
strategy.entry("short", strategy.short,  when=ShortCond==true and window()==true )
//strategy.exit(id="Close Short", stop=shortStop)//, limit=shortTake)
strategy.close("short", when=XShortCond==true and window()==true)

// === /STRATEGY ===Published by ChaoZhang on the FMZ strategy square · last modified 2024-03-29. Collected in the Quant Trading Vault. Unvalidated research: re-test with your own data and costs before trusting it.
Build this with AgenKit
A spec is not a trading system. Paste this into your coding agent and AgenKit runs a specialist team — architecture, test-first build, risk gates, review — with paper trading on by default.
/agenkit build a production-grade trading bot with a backtest engine, risk controls and paper trading by default from strategies/MACD-Trend-Following-Strategy-446542.md- npx agenkit install engineering-kit in your project
- Paste the command into your agent and approve each phase
- Get tests, backtest, risk controls and a paper-trading switch
Understand it first
Before you run this, read the lesson behind the idea and how to backtest it honestly. Specs like this one are the survivors of an unknown number of trials; deflate their results accordingly.
Related specs
- Adaptive ATR and RSI Trend Following Strategy with Trailing Stop LossPine Script · Trend following · 1h
- Advanced Multi Indicator Multi Dimensional Trend Cross Quantitative StrategyPine Script · Trend following · 3h
- Bollinger Bands and RSI Trend Following StrategyPine Script · Trend following · 1h
- Crossover EMA Short term Trading StrategyPine Script · Trend following · 1h
- Dual ATR Channel Trend Following StrategyPine Script · Trend following · 15m
- Dual EMA Crossover Oscillation Tracking StrategyPine Script · Trend following · 5m