Strategy vault / Trend following
Moving Stop Loss Strategy Based on Points Take Profit and Stop Loss
The core idea of this strategy is to use the crossover of EMA and WMA as entry signals, and incorporate take profit and stop loss based on points calculation for trading. Its biggest advantage is that it can very…
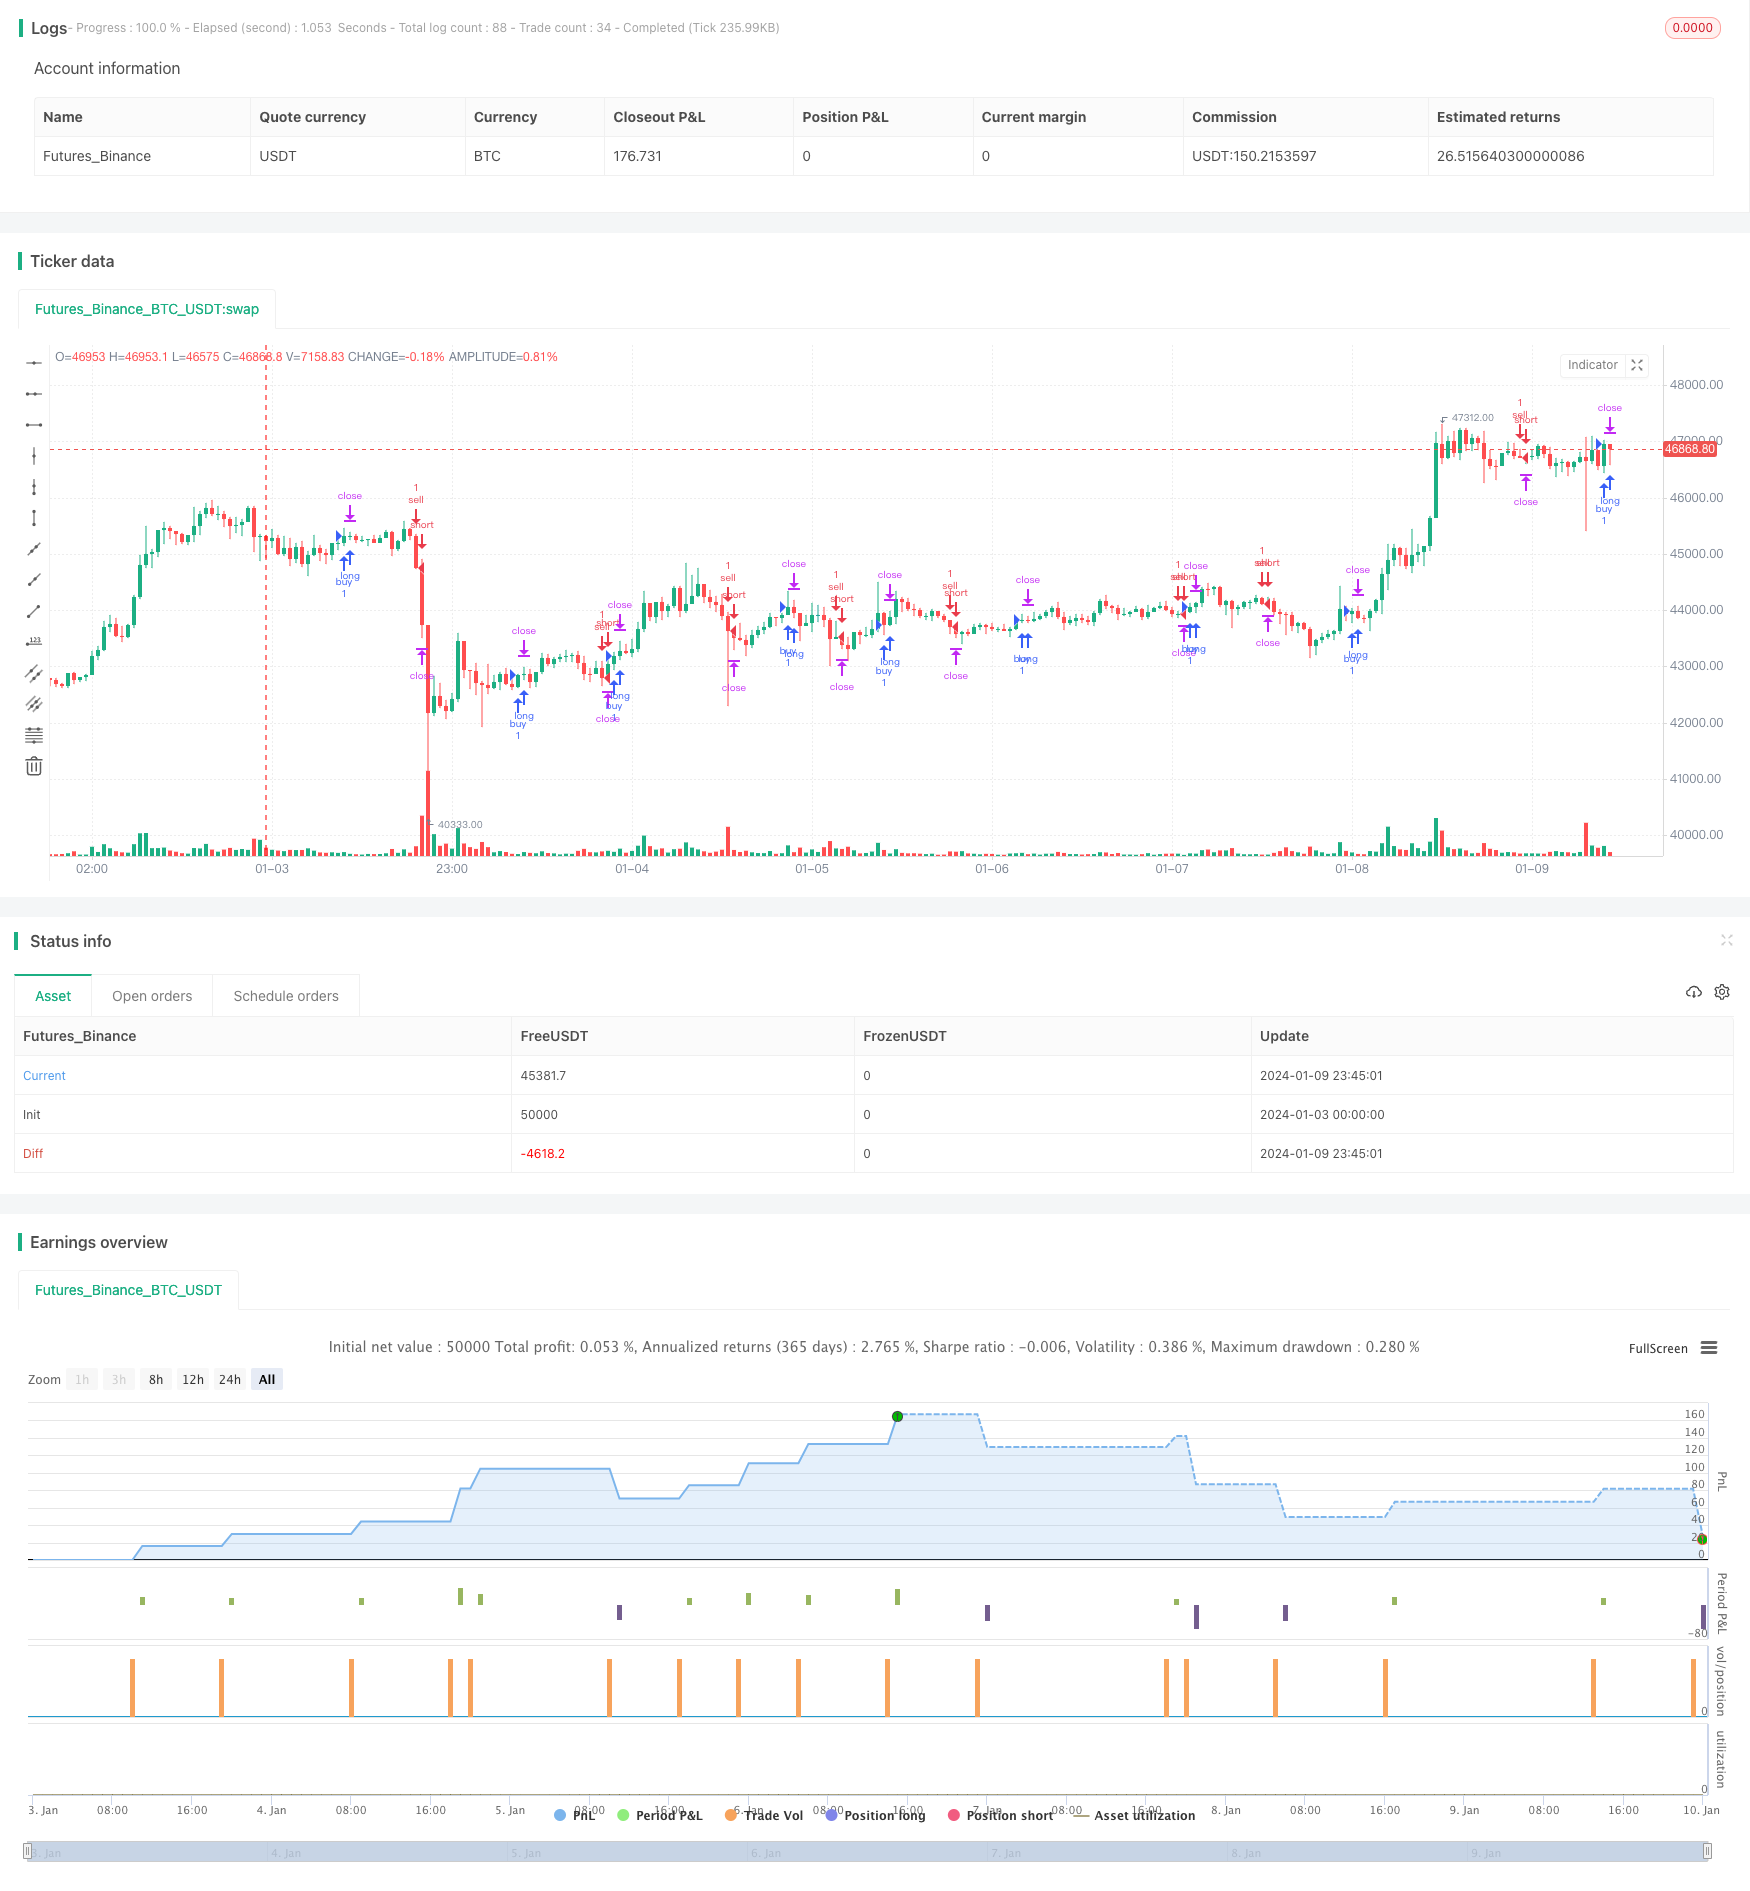
Overview
The core idea of this strategy is to use the crossover of EMA and WMA as entry signals, and incorporate take profit and stop loss based on points calculation for trading. Its biggest advantage is that it can very flexibly and precisely control risks by adjusting the number of points to control the amplitude of take profit and stop loss.
Strategy Principle
When EMA crosses WMA upwards, a long signal is generated. When EMA crosses WMA downwards, a short signal is generated. After entering positions, entry price will be calculated in real time, and stop loss and take profit will be set based on that. For example, set stop loss to 20 points and take profit to 100 points, then the specific stop loss price will be entry price minus 20 points * contract value, and take profit price will be entry price plus 100 points * contract value. This is how risk and profit are controlled.
At the same time, the strategy will also combine current market prices with historical stop loss to adjust the moving stop loss position and realize trailing stop loss.
Advantage Analysis
Compared with fixed points or percentage stop loss, the biggest advantage of this strategy is that it can very flexibly and precisely control risks. By adjusting the number of points, the amplitude of stop loss can be directly impacted. This applies very well to different varieties, and parameters can be fine tuned based on market fluctuation frequency and amplitude.
In addition, trailing stop loss is also a very practical function. It can track and adjust stop loss position based on real-time market changes, while ensuring risk control, and maximize possible profits.
Risk Analysis
The main risks of this strategy come from the EMA and WMA indicators themselves. When there is violent market movement, they often give out wrong signals, easily leading to stop loss. In this case, it is recommended to appropriately loosen the number of stop loss points, or consider replacing other indicator combinations.
Another risk point is that it is difficult to balance stop loss and take profit. Pursuing higher take profit often requires undertaking bigger risks, which can easily lead to stop loss when market turns. Therefore, the configuration of stop loss and take profit needs careful testing and evaluation.
Optimization Directions
This strategy can be optimized in the following aspects:
- Test different parameter combinations of EMA and WMA to find the optimal one;
- Try other indicators like MACD, KDJ etc. to replace or combine, and see if win rate can be improved;
- Evaluate risk reward of different points configurations for stop loss and take profit, and find the optimal setting;
- Study characteristics of different varieties, and adjust parameters to adapt to different markets;
- Incorporate machine learning algorithms to realize dynamic optimization of parameters.
Conclusion
The core idea of this strategy is simple and clear, using EMA and WMA as basis, and employing points based stop loss and take profit mechanism for risk control. The advantage of the strategy lies in precise and flexible risk control, which can be adjusted accordingly for different markets. Follow-up optimizations can be done in entry signals, parameter selection, stop loss mechanism etc., to make the strategy adapt better to the complex and ever-changing market environments.
Parameters
| Name | Default | What it controls |
|---|---|---|
| v_input_1 | 10 | EMA period |
| v_input_2 | 20 | WMA period |
| v_input_3 | 20 | (?PIP CALCULATION)TP PIP |
| v_input_4 | 20 | SL PIP |
Source Pine Script
/*backtest
start: 2024-01-03 00:00:00
end: 2024-01-10 00:00:00
period: 45m
basePeriod: 5m
exchanges: [{"eid":"Futures_Binance","currency":"BTC_USDT"}]
*/

// inspiration script from: @ahmad_naquib
// inspiration script link: https://www.tradingview.com/script/tGTV8MkY-Two-Take-Profits-and-Two-Stop-Loss/
// inspiration strategy script name: Two Take Profits and Two Stop Loss


////////////
// Do not use this strategy, it's just an exmaple !! The goal from this script is to show you TP and SL based on PIPS
////////////


//@version=5
strategy('SL & TP based on Pips', "PIP SL & TP", overlay=true, initial_capital=1000)

// MA
ema_period = input(title='EMA period', defval=10)
wma_period = input(title='WMA period', defval=20)
ema = ta.ema(close, ema_period)
wma = ta.wma(close, wma_period)

// Entry Conditions
long = ta.crossover(ema, wma) and nz(strategy.position_size) == 0
short = ta.crossunder(ema, wma) and nz(strategy.position_size) == 0

// Pips Calculation
pip1 = input(20, title = "TP PIP", group = "PIP CALCULATION") * 10 * syminfo.mintick
pip2 = input(20, title = "SL PIP", group = "PIP CALCULATION") * 10 * syminfo.mintick

// Trading parameters
var bool LS = na
var bool SS = na

var float EP = na // Entry Position
var float TVL = na
var float TVS = na
var float TSL = na
var float TSS = na

var float TP1 = na
//var float TP2 = na
var float SL1 = na
///var float SL2 = na

// SL & TP Values
// there's also SL2 and TP2 in case you want to add them to your script,
//also you can add a break event in the strategy.entry section.

if short or long and strategy.position_size == 0
    EP := close
    SL1 := EP - pip2 * (short ? -1 : 1)
    //SL2 := EP - pip2 * (short ? -1 : 1)

    TP1 := EP + pip1 * (short ? -1 : 1)
    //TP2 := EP + pip1 * 2 * (short ? -1 : 1)


// current trade direction
LS := long or strategy.position_size > 0
SS := short or strategy.position_size < 0

// adjust trade parameters and trailing stop calculations
TVL := math.max(TP1, open) - pip1[1]
TVS := math.min(TP1, open) + pip1[1]
TSL := open[1] > TSL[1] ? math.max(TVL, TSL[1]) : TVL
TSS := open[1] < TSS[1] ? math.min(TVS, TSS[1]) : TVS

//if LS and high > TP1
    //if open <= TP1
        //SL2 := math.min(EP, TSL)

//if SS and low < TP1
    //if open >= TP1
        //SL2 := math.max(EP, TSS)


// Closing conditions
// and those are a closing conditions in case you want to add them.

//close_long = LS and open < SL2
//close_short = SS and open > SL2

// Buy
if (long and not SS)
    strategy.entry('buy', strategy.long)
strategy.exit('exit1', from_entry='buy', stop=SL1, limit=TP1, qty_percent=100)
//strategy.exit('exit2', from_entry='buy', stop=SL2, limit=TP2)

// Sell
if (short and not LS)
    strategy.entry('sell', strategy.short)
strategy.exit('exit3', from_entry='sell', stop=SL1, limit=TP1, qty_percent=100)
//strategy.exit('exit4', from_entry='sell', stop=SL2, limit=TP2)

// Plots
// those are plots for the lines of The tp and sl. they are really useful, and in the next update I will use a filling option.

a = plot(strategy.position_size > 0 ? SL1 : na, color=color.new(#af0829, 30), linewidth = 2, style=plot.style_linebr)
b = plot(strategy.position_size < 0 ? SL1 : na, color=color.new(#af0829, 30), linewidth = 2, style=plot.style_linebr)

c = plot(strategy.position_size > 0 ? TP1 : na, color=color.new(#2e7e00, 30), linewidth = 2, style=plot.style_linebr)
d = plot(strategy.position_size < 0 ? TP1 : na, color=color.new(#2e7e00, 30), linewidth = 2, style=plot.style_linebr)

g = plot(strategy.position_size >= 0 ? na : EP, color=color.new(#ffffff, 50), style=plot.style_linebr)
h = plot(strategy.position_size <= 0 ? na : EP, color=color.new(#ffffff, 50), style=plot.style_linebr)


// those are plot for the TP2 and SL2, they are optional if you want to add them.

//e = plot(strategy.position_size > 0 ? TP2 : na, color=color.new(#00ced1, 0), style=plot.style_linebr)
//f = plot(strategy.position_size < 0 ? TP2 : na, color=color.new(#00ced1, 0), style=plot.style_linebr)


//those are the plot for the ema and wma strategy for short and long signal. they are not really a good strategy, I just used them as an example
//but you have the option to plot them or not.
// do not use this strategy, it's just an exmaple !! The goal from this script is to show you TP and SL based on PIPS

//plot(ema, title='ema', color=color.new(#fff176, 0))
//plot(wma, title='wma', color=color.new(#00ced1, 0))Published by ChaoZhang on the FMZ strategy square · last modified 2024-01-11. Collected in the Quant Trading Vault. Unvalidated research: re-test with your own data and costs before trusting it.
Build this with AgenKit
A spec is not a trading system. Paste this into your coding agent and AgenKit runs a specialist team — architecture, test-first build, risk gates, review — with paper trading on by default.
/agenkit build a production-grade trading bot with a backtest engine, risk controls and paper trading by default from strategies/Moving-Stop-Loss-Strategy-Based-on-Points-Take-Profit-and-Stop-Loss.md- npx agenkit install engineering-kit in your project
- Paste the command into your agent and approve each phase
- Get tests, backtest, risk controls and a paper-trading switch
Understand it first
Before you run this, read the lesson behind the idea and how to backtest it honestly. Specs like this one are the survivors of an unknown number of trials; deflate their results accordingly.
Related specs
- Adaptive ATR and RSI Trend Following Strategy with Trailing Stop LossPine Script · Trend following · 1h
- Advanced Multi Indicator Multi Dimensional Trend Cross Quantitative StrategyPine Script · Trend following · 3h
- Bollinger Bands and RSI Trend Following StrategyPine Script · Trend following · 1h
- Crossover EMA Short term Trading StrategyPine Script · Trend following · 1h
- Dual ATR Channel Trend Following StrategyPine Script · Trend following · 15m
- Dual EMA Crossover Oscillation Tracking StrategyPine Script · Trend following · 5m