Strategy vault / Trend following
Quantitative Trading Strategy Based on Double EMA Crossover
This strategy generates trading signals by calculating the crossover between two EMA lines of different periods to determine market trends. It will open long positions when the shorter period EMA crosses over the…
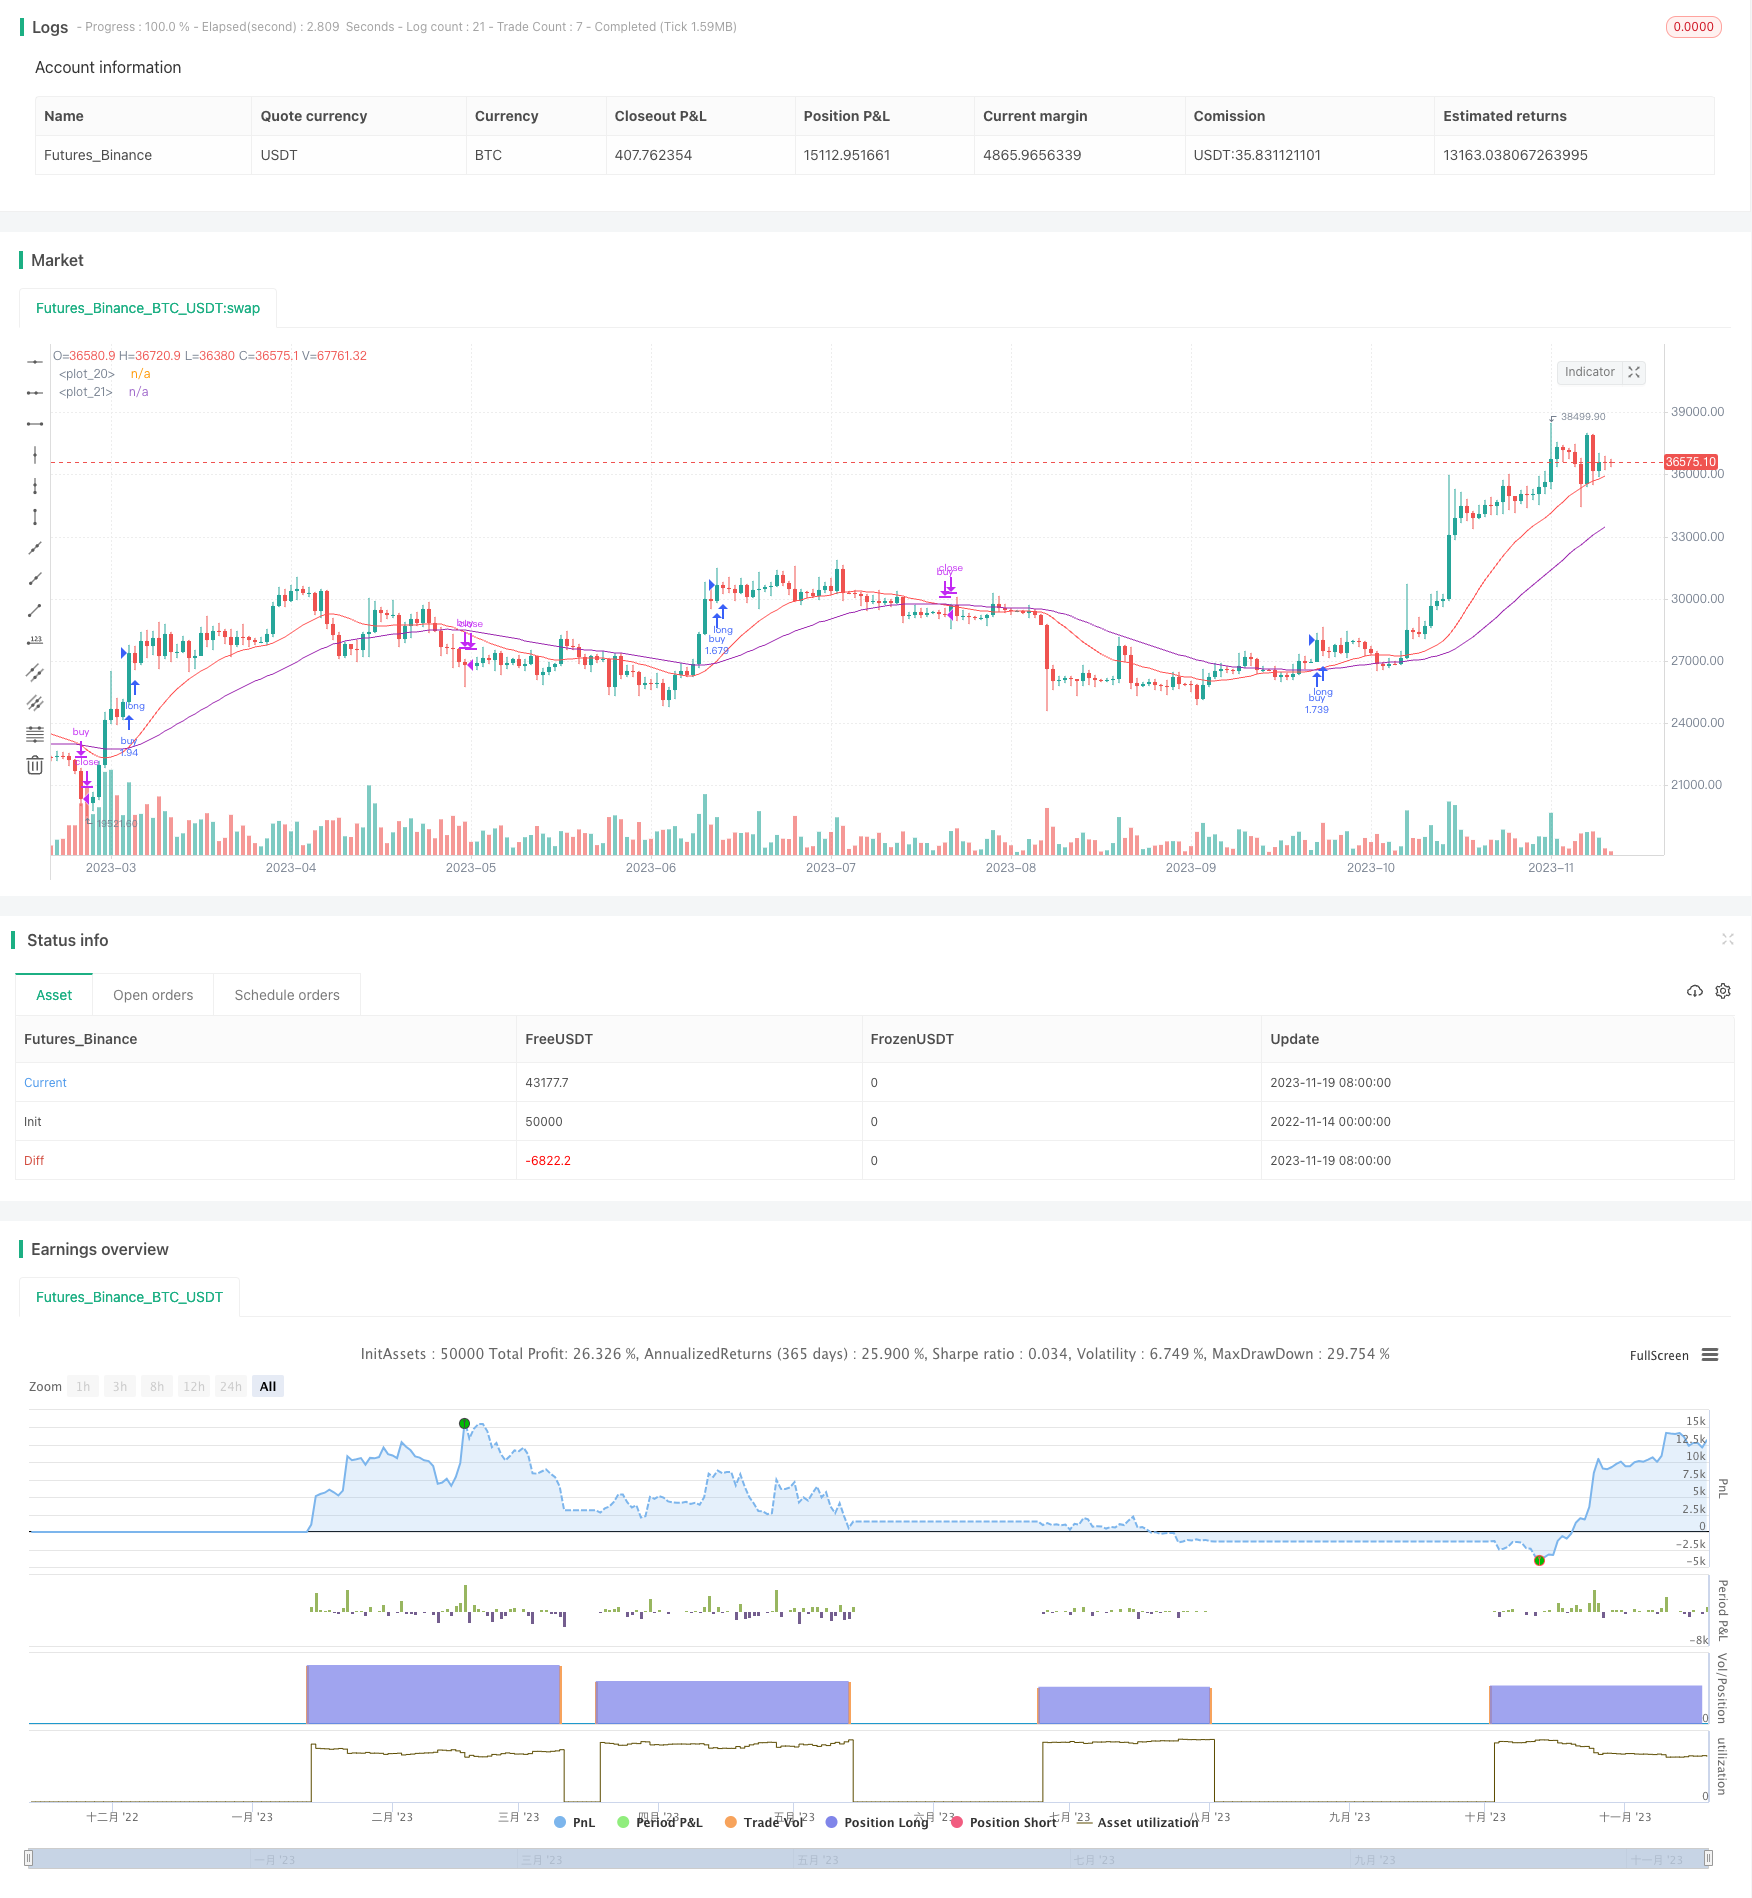
Overview
This strategy generates trading signals by calculating the crossover between two EMA lines of different periods to determine market trends. It will open long positions when the shorter period EMA crosses over the longer period EMA, indicating an uptrend, and it will close positions when the shorter period EMA crosses below the longer period EMA, indicating a downtrend.
Principles
The strategy mainly applies the golden cross and death cross theory of double EMA lines. The double EMA lines consist of a long EMA and a short EMA. The short EMA parameter is set to 10 days and the long EMA parameter is set to 21 days.
When the short EMA crosses over the long EMA, a buy signal is generated. When the short EMA crosses below the long EMA, a sell signal is generated. The strategy also sets growth rate thresholds, opening long positions only when growth exceeds a positive threshold and closing positions only when decline exceeds a negative threshold.
Specifically, the buy condition is when the short EMA is higher than the long EMA and the stock growth rate exceeds the positive threshold. The close position condition is when the short EMA is lower than the long EMA and the stock growth rate falls below the negative threshold.
Advantages
- Utilizes the golden cross and death cross theory of double EMA lines for simplicity and reliability
- Adds growth rate thresholds to avoid erroneous trades during weak growth
- Can strictly control maximum loss ratio
- EMA period parameters can be flexibly adjusted for different cycles
Risk Analysis
- EMA lines have lagging effects, possibly missing price reversal points
- Line crossovers have some lag, possibly missing best entry points
- Relies on parameter optimization, improper settings may cause overtrading or insufficient signals
Optimization Directions
- Combine with other indicators like MACD, KD etc. to improve signal accuracy
- Add stop loss strategies like trailing stop loss to maximize profits
- Optimize EMA period parameters for best settings across different products
- Incorporate real-time data and machine learning methods for dynamic parameter adjustment and optimization
Summary
The overall strategy is relatively simple and reliable, using double EMA crossovers to determine price trends and setting growth rate thresholds to generate trading signals. Compared to single line crossovers, it can filter out some false signals. But EMA lines themselves have lagging issues. Combining other indicators or dynamic parameter adjustment can further improve strategy performance.
Parameters
| Name | Default | What it controls |
|---|---|---|
| v_input_1 | false | Use Start Time Limiter? |
| v_input_2 | 2016 | Start From Year |
| v_input_3 | 5 | Start From Month |
| v_input_4 | true | Start From Day |
| v_input_5 | false | Start From Hour |
| v_input_6 | false | Start From Minute |
| v_input_7 | 10 | lenght0 |
| v_input_8 | 21 | lenght1 |
| v_input_9 | 0.05 | Threshold Up |
| v_input_10 | -0.165 | Threshold Down |
Source Pine Script
/*backtest
start: 2022-11-14 00:00:00
end: 2023-11-20 00:00:00
period: 1d
basePeriod: 1h
exchanges: [{"eid":"Futures_Binance","currency":"BTC_USDT"}]
*/

//@version=3
strategy(title="ema(ema10-21)", overlay=true, pyramiding = 0, default_qty_type = strategy.percent_of_equity, default_qty_value = 100, initial_capital = 15000, commission_type = strategy.commission.percent, commission_value = 0.2)

useTimeLimit    = input(defval = false, title = "Use Start Time Limiter?")
startYear       = input(defval = 2016, title = "Start From Year",  minval = 0, step = 1)
startMonth      = input(defval = 05, title = "Start From Month",  minval = 0,step = 1)
startDay        = input(defval = 01, title = "Start From Day",  minval = 0,step = 1)
startHour       = input(defval = 00, title = "Start From Hour",  minval = 0,step = 1)
startMinute     = input(defval = 00, title = "Start From Minute",  minval = 0,step = 1)

startTimeOk() => true

lenght0 = input(10)
lenght1 = input(21)

source = close

EmaShort = ema(ema(source, lenght0), lenght0)
EmaLong = ema(ema(source, lenght1),lenght1)
plot(EmaShort, color=red)
plot(EmaLong, color=purple)

growth = ((EmaShort-EmaLong)*100)/((EmaShort+EmaLong)/2)
thresholdUp = input(defval=0.05, title="Threshold Up", type=float, step=0.01)
thresholdDown = input(defval=-0.165, title="Threshold Down", type=float, step=0.001)

if( startTimeOk() )
    buy_condition = EmaShort > EmaLong and growth > thresholdUp
    buy_exit_condition = EmaShort < EmaLong and growth < thresholdDown
    strategy.entry("buy", strategy.long, comment="buy", when=buy_condition)
    strategy.close(id='buy', when=buy_exit_condition)
Published by ChaoZhang on the FMZ strategy square · last modified 2023-11-21. Collected in the Quant Trading Vault. Unvalidated research: re-test with your own data and costs before trusting it.
Build this with AgenKit
A spec is not a trading system. Paste this into your coding agent and AgenKit runs a specialist team — architecture, test-first build, risk gates, review — with paper trading on by default.
/agenkit build a production-grade trading bot with a backtest engine, risk controls and paper trading by default from strategies/Quantitative-Trading-Strategy-Based-on-Double-EMA-Crossover.md- npx agenkit install engineering-kit in your project
- Paste the command into your agent and approve each phase
- Get tests, backtest, risk controls and a paper-trading switch
Understand it first
Before you run this, read the lesson behind the idea and how to backtest it honestly. Specs like this one are the survivors of an unknown number of trials; deflate their results accordingly.
Related specs
- Adaptive ATR and RSI Trend Following Strategy with Trailing Stop LossPine Script · Trend following · 1h
- Advanced Multi Indicator Multi Dimensional Trend Cross Quantitative StrategyPine Script · Trend following · 3h
- Bollinger Bands and RSI Trend Following StrategyPine Script · Trend following · 1h
- Crossover EMA Short term Trading StrategyPine Script · Trend following · 1h
- Dual ATR Channel Trend Following StrategyPine Script · Trend following · 15m
- Dual EMA Crossover Oscillation Tracking StrategyPine Script · Trend following · 5m