Strategy vault / Trend following
Trend Following Strategy Based on EMA Lines
This strategy is based on 3 EMA lines of different periods. It judges the current trend direction by whether the price is above the EMA lines. When the short-term EMA line crosses above the long-term EMA line, a buy…
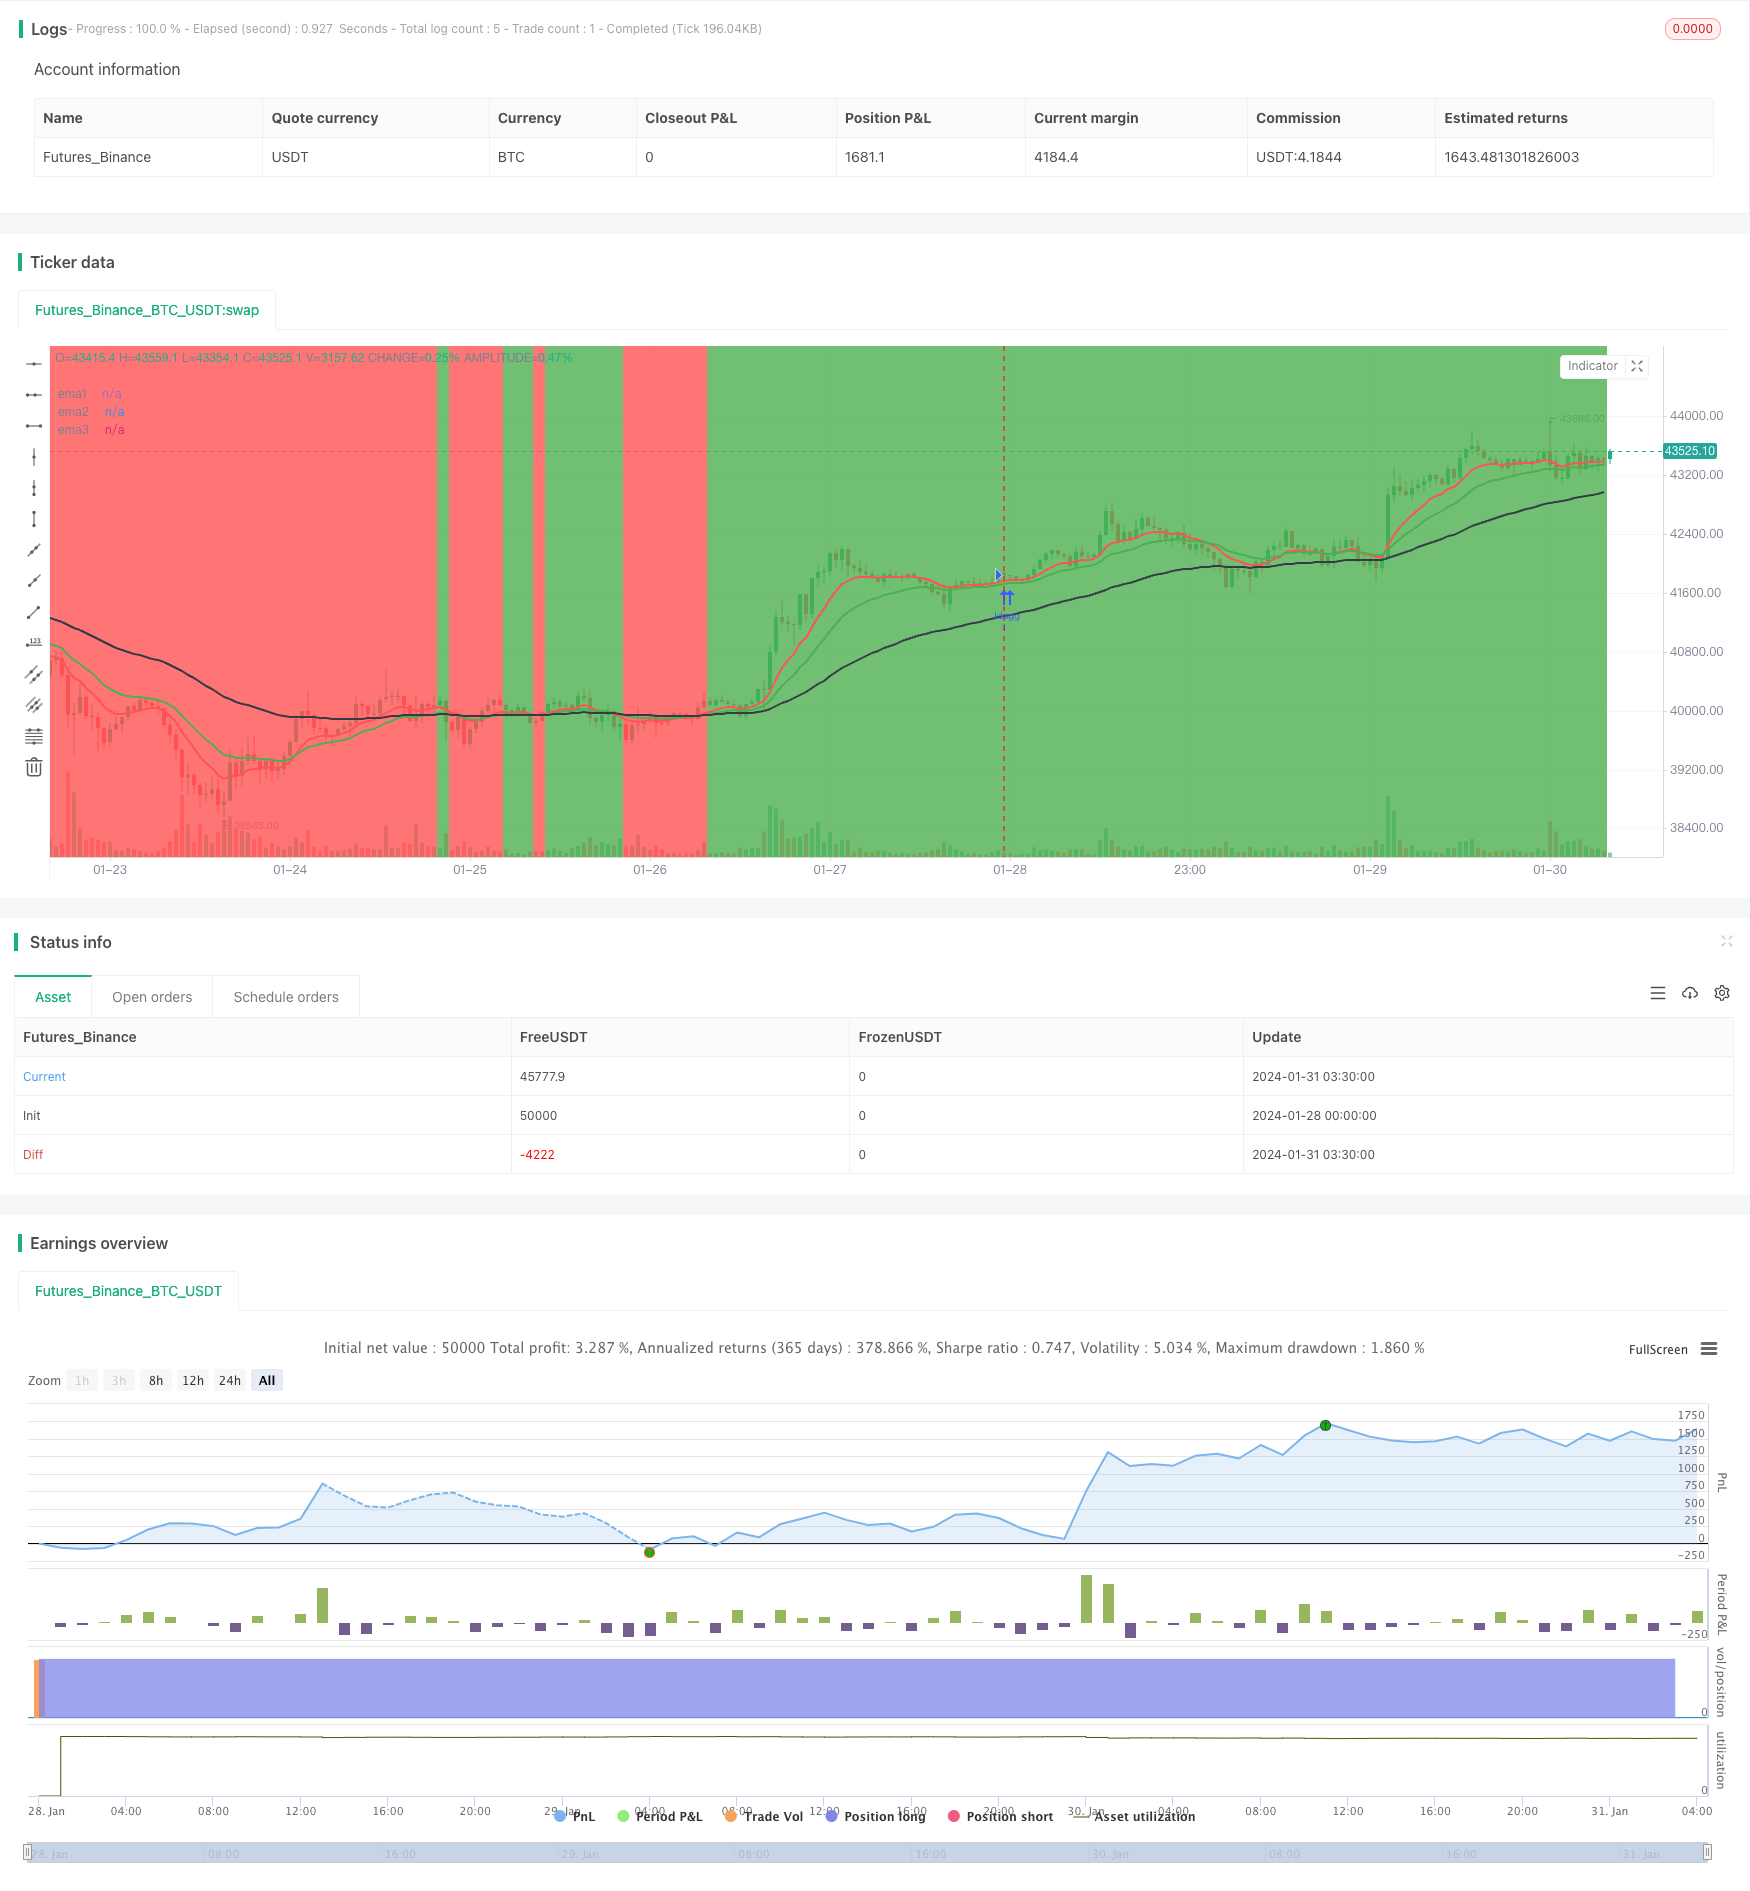
Overview
This strategy is based on 3 EMA lines of different periods. It judges the current trend direction by whether the price is above the EMA lines. When the short-term EMA line crosses above the long-term EMA line, a buy signal is generated. When the short-term EMA line crosses below the long-term EMA line, a sell signal is generated. This strategy tracks the trend runs and closes positions in time when trend reverses.
Strategy Logic
The strategy uses 3 EMA lines, which are 10-day, 20-day and 50-day respectively. The judging rules are:
When both 10-day EMA and 20-day EMA are above 50-day EMA, it is defined as an uptrend;
When both 10-day EMA and 20-day EMA are below 50-day EMA, it is defined as a downtrend;
When short-term EMA lines (10-day and 20-day) cross above long-term EMA line (50-day), a buy signal is generated;
When short-term EMA lines (10-day and 20-day) cross below long-term EMA line (50-day), a sell signal is generated;
Hold long position during uptrend and hold short position during downtrend;
Close current directional position when trend reverses (short-term EMA crosses long-term EMA).
The strategy captures profit by timely closing positions to lock in gains and alternating between long and short positions.
Advantage Analysis
The advantages of this strategy are:
- The rules are simple and clear, easy to understand and implement;
- Using EMA lines to determine trend avoids interference from short-term market fluctuations;
- Timely closing positions to track trend runs avoids expanding losses;
- No need to predict market direction with high winning rate by tracking trends.
Risk Analysis
There are also some risks in this strategy:
During range-bound markets, EMA lines may crossover frequently, resulting in high trading costs from frequently opening and closing positions;
Trend determination by EMA may fail after price gap, missing good entry opportunities.
To optimize the risks, some methods can be used:
Open position rules can be relaxed properly when EMAs are close to avoid over-trading;
Determine trend combining other indicators to avoid EMA failure.
Optimization Directions
The strategy can be optimized from the following aspects:
Parameter optimization. Test different EMA period combinations to find the optimal parameters;
Trading cost optimization. Optimize open position rules properly to reduce unnecessary frequent trading;
Stop loss strategy optimization. Set reasonable stop loss level to control single loss;
Combine other indicators. Use MACD, KDJ and other indicators to assist in determining optimal entry timing.
Summary
In general, this strategy is quite simple and practical. It uses EMA to determine trend direction with proper stop loss strategy to effectively control risks. There are also rooms for optimization. By combining parameter optimization, stop loss strategy and other indicators, the performance of this strategy can be further improved.
Parameters
| Name | Default | What it controls |
|---|---|---|
| v_input_1 | true | infoBox |
| v_input_2 | false | infoBox2 |
| v_input_3 | false | Buy & SellSignal |
| v_input_4 | 0 | infoBoxSize: size.large | size.tiny | size.small | size.normal | size.auto | size.huge |
| v_input_5 | 10 | ema1Value |
| v_input_6 | 20 | ema2Value |
| v_input_7 | 59 | ema3Value |
| v_input_8 | 3000 | maxLoss |
Source Pine Script
/*backtest
start: 2024-01-28 00:00:00
end: 2024-01-31 04:00:00
period: 45m
basePeriod: 5m
exchanges: [{"eid":"Futures_Binance","currency":"BTC_USDT"}]
*/

// This source code is subject to the terms of the Mozilla Public License 2.0 at https://mozilla.org/MPL/2.0/
// © mattehalen

//@version=4
//study("EMA 10,20 59",overlay=true)
strategy("EMA 10,20 59",overlay=true)
infoBox     = input(true, title="infoBox", type=input.bool)
infoBox2    = input(false, title="infoBox2", type=input.bool)
BuySellSignal_Bool = input(false, title="Buy & SellSignal", type=input.bool)
infoBoxSize = input(title="infoBoxSize", defval=size.large, options=[size.auto, size.tiny, size.small, size.normal, size.large, size.huge])
ema1Value   = input(10)
ema2Value   = input(20)
ema3Value   = input(59)
maxLoss = input(3000)
ema1        = ema(close,ema1Value)
ema2        = ema(close,ema2Value)
ema3        = ema(close,ema3Value)
objcnt      = 0
buyTitle    = tostring(close[1])
myProfit    = float(0)

plot(ema1,title="ema1",color=color.red,linewidth=2)
plot(ema2,title="ema2",color=color.green,linewidth=2)
plot(ema3,title="ema3",color=color.black,linewidth=2)

Buytrend = (ema1 and ema2 > ema3) and (ema1[1] and ema2[1] > ema3[1])
BarssinceBuyTrend = barssince(Buytrend)
BarssinceSellTrend = barssince(not Buytrend)
closeAtBuyTrend = close[1]
bgcolor(Buytrend ? color.green : color.red,transp=70)

BuySignal = Buytrend and not Buytrend[1] and BuySellSignal_Bool

BuySignalOut = Buytrend and (crossunder(ema1,ema2)) and BuySellSignal_Bool
BarssinceBuy = barssince(BuySignal)
bgcolor(BuySignal ? color.green : na , transp=30)
bgcolor(BuySignalOut ? color.black : na , transp=30)
plot(BarssinceBuy,title="BarssinceBuy",display=display.none)


SellSignal = not Buytrend and Buytrend[1] and BuySellSignal_Bool
SellSignalOut = not Buytrend and (crossover(ema1,ema2)) and BuySellSignal_Bool
BarssinceSell = barssince(SellSignal)
bgcolor(SellSignal ? color.red : na , transp=30)
bgcolor(SellSignalOut ? color.black : na , transp=30)
plot(BarssinceSell,title="BarssinceSell",display=display.none)


buyProfit   = float(0)
cntBuy      =0
sellProfit  = float(0)
cntSell     =0
buyProfit   := Buytrend and not Buytrend[1]? nz(buyProfit[1]) + (close[BarssinceBuyTrend[1]]-close) : nz(buyProfit[1])
cntBuy      := Buytrend and not Buytrend[1]? nz(cntBuy[1]) + 1: nz(cntBuy[1])
sellProfit  := not Buytrend and Buytrend[1]? nz(sellProfit[1]) + (close-close[BarssinceSellTrend[1]]) : nz(sellProfit[1])
cntSell     := not Buytrend and Buytrend[1]? nz(cntSell[1]) + 1 : nz(cntSell[1])
totalProfit = buyProfit + sellProfit

// if (Buytrend and not Buytrend[1] and infoBox==true)
//     l = label.new(bar_index - (BarssinceBuyTrend[1]/2), na,text="Close = " + tostring(close) + "\n" + "Start = "+tostring(close[BarssinceBuyTrend[1]]) + "\n" + "Profit = "+tostring(close[BarssinceBuyTrend[1]]-close) ,style=label.style_labelup, yloc=yloc.belowbar,color=color.red,size=infoBoxSize)
// if (not Buytrend and Buytrend[1] and infoBox==true)
//     l = label.new(bar_index - (BarssinceSellTrend[1]/2), na,text="Close = " + tostring(close) + "\n" + "Start = "+tostring(close[BarssinceSellTrend[1]]) + "\n" + "Profit = "+tostring(close-close[BarssinceSellTrend[1]]) ,style=label.style_labeldown, yloc=yloc.abovebar,color=color.green,size=infoBoxSize)

// if (BuySignalOut and not BuySignalOut[1] and infoBox2==true)
// //    l = label.new(bar_index - (BarssinceBuy[0]/2), na,text="Close = " + tostring(close) + "\n" + "Start = "+tostring(close[BarssinceBuy[0]]) + "\n" + "Profit = "+tostring(close-close[BarssinceBuy[0]]) ,style=label.style_labelup, yloc=yloc.belowbar,color=color.purple,size=infoBoxSize
//     l = label.new(bar_index, na,text="Close = " + tostring(close) + "\n" + "Start = "+tostring(close[BarssinceBuy[0]]) + "\n" + "Profit = "+tostring(close-close[BarssinceBuy[0]]) ,style=label.style_labelup, yloc=yloc.belowbar,color=color.lime,size=infoBoxSize)
// if (SellSignalOut and not SellSignalOut[1] and infoBox2==true)
// //    l = label.new(bar_index - (BarssinceSell[0]/2), na,text="Close = " + tostring(close) + "\n" + "Start = "+tostring(close[BarssinceSell[0]]) + "\n" + "Profit = "+tostring(close[BarssinceSell[0]]-close) ,style=label.style_labeldown, yloc=yloc.abovebar,color=color.purple,size=infoBoxSize)
//     l = label.new(bar_index, na,text="Close = " + tostring(close) + "\n" + "Start = "+tostring(close[BarssinceSell[0]]) + "\n" + "Profit = "+tostring(close[BarssinceSell[0]]-close) ,style=label.style_labeldown, yloc=yloc.abovebar,color=color.fuchsia,size=infoBoxSize)


// l2 = label.new(bar_index, na, 'buyProfit in pip = '+tostring(buyProfit)+"\n"+  'cntBuy = '+tostring(cntBuy) +"\n"+  'sellProfit in pip = '+tostring(sellProfit)+"\n"+  'cntSell = '+tostring(cntSell) +"\n"+  'totalProfit in pip = '+tostring(totalProfit)     ,
//   color=totalProfit>0 ? color.green : color.red,
//   textcolor=color.white,
//   style=label.style_labeldown, yloc=yloc.abovebar,
//   size=size.large)

// label.delete(l2[1])


//--------------------------------------------------
//--------------------------------------------------
if (Buytrend)
    strategy.close("short", comment = "Exit short")
    strategy.entry("long", true)
    strategy.exit("Max Loss", "long", loss = maxLoss)

//if BuySignalOut
   // strategy.close("long", comment = "Exit Long")
if (not Buytrend)
    // Enter trade and issue exit order on max loss.
    strategy.close("long", comment = "Exit Long")
    strategy.entry("short", false)
    strategy.exit("Max Loss", "short", loss = maxLoss)
//if SellSignalOut
    // Force trade exit.
    //strategy.close("short", comment = "Exit short")

//--------------------------------------------------
//--------------------------------------------------
//--------------------------------------------------
Published by ChaoZhang on the FMZ strategy square · last modified 2024-02-05. Collected in the Quant Trading Vault. Unvalidated research: re-test with your own data and costs before trusting it.
Build this with AgenKit
A spec is not a trading system. Paste this into your coding agent and AgenKit runs a specialist team — architecture, test-first build, risk gates, review — with paper trading on by default.
/agenkit build a production-grade trading bot with a backtest engine, risk controls and paper trading by default from strategies/Trend-Following-Strategy-Based-on-EMA-Lines.md- npx agenkit install engineering-kit in your project
- Paste the command into your agent and approve each phase
- Get tests, backtest, risk controls and a paper-trading switch
Understand it first
Before you run this, read the lesson behind the idea and how to backtest it honestly. Specs like this one are the survivors of an unknown number of trials; deflate their results accordingly.
Related specs
- Adaptive ATR and RSI Trend Following Strategy with Trailing Stop LossPine Script · Trend following · 1h
- Advanced Multi Indicator Multi Dimensional Trend Cross Quantitative StrategyPine Script · Trend following · 3h
- Bollinger Bands and RSI Trend Following StrategyPine Script · Trend following · 1h
- Crossover EMA Short term Trading StrategyPine Script · Trend following · 1h
- Dual ATR Channel Trend Following StrategyPine Script · Trend following · 15m
- Dual EMA Crossover Oscillation Tracking StrategyPine Script · Trend following · 5m